 🌊 Lakefront
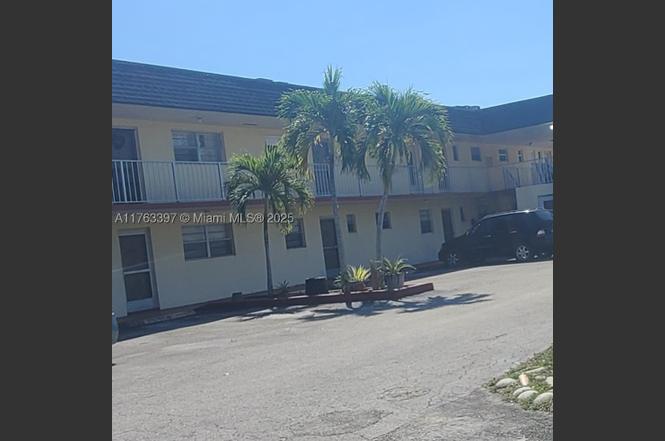
19305 NE 2 Ave #2323 · Ives Estates, FL
Flood risk 4/10 · Minor
- FEMA flood zone
- AE
- Chance of flooding over 30 yrs
- 0.21%
- Est. flood insurance / yr
- $1,737 – $8,500
Fire risk 1/10 · Minimal
- Est. fire insurance / yr
- $947 – $1,759
Heat risk 10/10 · Severe
- Hot days now (above 105°F)
- 6 days/yr
- Hot days in 30 yrs
- 20 days/yr
Wind risk 10/10 · Severe
- Chance of severe wind over 30 yrs
- 99.0%
Air-quality risk 2/10 · Minimal
- Unhealthy air days now
- 2 days/yr
- Unhealthy air days in 30 yrs
- 2 days/yr
Risk factors via First Street. Map © Google.
Why this score? — see what drove the B- grade
The composite is a weighted blend of 9 inputs, each scored 0–100. Each bar is that input's sub-score; the figure is the points it added to the 100-point composite (weight × sub-score).
- Cash flow +28.8/30.0
- 1% rule +10.0/10.0
- DSCR +10.0/10.0
- ARV discount +7.5/15.0
- Schools +4.2/10.0
- Livability +3.9/5.0
- Rent growth +2.6/5.0
- Condition / age +2.5/5.0
- Appreciation +0.0/10.0
$140,000
🖨 Deal sheet (PDF) 📄 Offer letter ✓ Due diligence
Listing remarks MLS
Spacious 2 bedroom/2 bathroom second floor condominium with ample living space, room for small office and/or play room.
Key facts
- $415 HOA
- Parking
- Built 1972
Property features AI
Finance
- HOA & community: Monthly association fee of $415 covering common areas; Pets allowed with size limit (maximum 20 lbs)
Exterior
- Parking: Guest parking available; One assigned parking space
- Security: Complex fenced
- Home design: 2 stories
- Construction: Block construction; Resale property
- Exterior features: Fenced exterior; Complex is fenced; Has a view; Property is attached
Interior
- Kitchen: Electric range; Refrigerator
- Flooring: Tile flooring
- Bathrooms: 1 full bathroom; 1 half bathroom
- Heating & cooling: Central air conditioning; Electric heating
- Interior features: Second-floor entry; Other interior features
Neighborhood map
What this means for you Summary
Snapshot
- This is a 2-bed/2.0-bath condo listed at $140k.
Deal economics
- At list price, monthly cash flow is $42 ($501/yr) — positive.
- The deal already cash-flows at list — no discount required.
- Meets the 1% rule at list price ($2k rent vs $140k).
- Recommended offer: $123k (12.0% below list) — sets the bar for market timing.
- Cap rate 10.3% vs local median 3.6% in Ives Estates — top-decile yield for the area; either an underpriced asset or a hidden risk that comps aren't pricing in. Stress-test before assuming the spread holds.
Location & tenants
- Location reads 77/100 on livability (#191 in FL, #3,061 nationally) — a middle-class / working-renter tenant base. Strengths: commute A+, housing A+, cost of living A-; Watch: employment C-, schools D+, amenities F.
- Miami-Dade (suburban): math 45% / reading 54% proficiency, ranked #40 of 73 in FL (top 55%) — families likely to look elsewhere, expect single-tenant / working-renter base with shorter leases; 64% free/reduced lunch — lower-income household profile, screen leases tightly.
- Market conditions: Rents flat; 572 active listings in the ZIP; 5 comparable units currently listed for rent nearby; rentals at typical pace (median 20d on market — plan ~3-4 weeks tenant-placement turnaround); 10,051 units permitted in Miami-Dade County in 2024 (7,758 in 5+ unit buildings).
- This rent runs 40% of the median local income ($65k/yr) — at the standard rent-burdened threshold; future hikes will face affordability resistance.
Forward outlook
- Local home prices are declining (-3.0%/yr); year-one equity from $968 of loan paydown is wiped out by about $4k of value loss. Plan a longer hold.
- Miami-Dade County population projected at +28% by 2050 — long-run rental-demand tailwind backs the buy-and-hold thesis.
Negotiation context
- It's been on market 460 days — a 12% lower offer ($123k) is reasonable based on typical stale-listing flexibility.
- 3 sale attempts since 9y ago; this cycle's ask is 7268% above the opening price — seller raised mid-cycle; expect resistance to lowballs.
- Current owner paid $80k; list at $140k implies a 75% gain — meaningful room to come down on a strong offer.
Risks & watch-outs
- Watch-outs: flood insurance adds $427/mo.
- Climate carrying-cost: in FEMA flood zone AE (mandatory federal flood insurance); severe wind risk, 99% chance of damaging wind over 30y; extreme-heat days projected 6→20/yr by 2055 (HVAC capex compounding) — expect insurance premiums to compound above CPI over the hold.
Questions for the listing agent
- It's been on market 460 days. Have you received any prior offers? Is the seller open to a 12% concession, seller financing, or rate buy-down credit?
- Built in 1972 — when were the roof, HVAC, electrical panel, plumbing, and water heater last replaced?
- What's the actual annual flood-insurance premium (NFIP or private), and is the property in a SFHA with mandatory coverage?
- What does the HOA fee cover, when was the last increase, and are there any pending special assessments or reserve-fund shortfalls?
- Any open or pending special assessments — roof, HVAC, plumbing, elevator, façade? What's the per-unit balance and payoff schedule, and is the seller paying it off at close or rolling it to the buyer?
- Why hasn't it sold? Are there any deal-killer items the seller is aware of (foundation, flood, title, zoning, code violations)?
- Is there a deadline driving the sale (1031 exchange, divorce, estate, relocation)? That informs how much negotiation room exists.
- Schools are D-rated, which usually means shorter tenancies and higher turnover. Who's the typical renter profile here, and what's been the actual vacancy rate?
- This sits on a lake — are riparian / water-frontage rights deeded with the parcel? Any dock permits, shoreline easements, or HOA water-use restrictions?
- What's the documented flood / surge / shoreline-erosion history here (FEMA AND non-FEMA — e.g., storm surge, creek backup, septic-field saturation)?
- Any water-quality or seasonal algae-bloom issues that affect tenant satisfaction or short-term-rental demand?
- What's the average days-on-market for RENTAL listings here right now (not sales)? A rising rental-DOM trend means longer vacancies and softer asking-rent achievability than the comps imply.
- What's the recent tenant-quality profile in this submarket — average credit score on applications, eviction rate, late-payment / NSF rate, and stable-employment percentage? A property-management company in the area should have these aggregated.
- How much new apartment / multifamily construction is in the pipeline within 1–3 miles? Heavy new supply (>2% of stock underway) typically softens rents 12–24 months out; light construction supports rent growth.
Investment metrics
- 1% rule
- 1.56% ✓
- Cap rate
- 10.31%
- Cash-on-cash
- 14.34%
- DSCR
- 1.64
- GRM
- 5.3
CMA / ARV
No comps found within radius.
Projected returns pro-forma
-3.0% appreciation · 0.22% rent growth · sell at horizon
- IRR
- -19.4%
- Equity multiple
- 0.35×
- Total profit
- $-25,505
- Equity at exit
- $20,874
- IRR
- -28.1%
- Equity multiple
- -0.02×
- Total profit
- $-39,970
- Equity at exit
- $12,105
Cash invested: $39,200 (down + closing). Projections, not guarantees.
Landlord ↔ Tenant lean methodology
- Overall (STATE)
- 87 Strongly Landlord-Friendly
- State Florida
- 87 Strongly Landlord-Friendly · R+3
- County
- — inherits STATE
- City
- — inherits STATE
ZIP-level market 33179
- Rents YoY
- 0.2%
- Active inventory
- 572
- Price-to-rent
- 5.3×
Monthly cashflow live
- Estimated rent
- $2,188 high interval (Pro) →
- Mortgage (P&I)
- −$734
- Tax from tax record
- −$53 /mo · $637/yr
- Insurance
- −$58
- Flood insurance flood zone
- −$427 /mo · $5,118/yr
- HOA
- −$415
- Vacancy / Maint / Mgmt
- −$460
- Net cashflow
- $42
Break-even live
Sensitivity live
| Price | -10% $121 | -5% $81 | +0% $42 | +5% $2 | +10% $-37 |
|---|---|---|---|---|---|
| Rent | -10% $-131 | -5% $-45 | +0% $42 | +5% $128 | +10% $215 |
| Rate | -1.0pp $112 | -0.5pp $77 | base $42 | +0.5pp $6 | +1.0pp $-31 |
UW: 25.0% down · 7.5% · 30yr · 1.5% tax · 5.0% vac · 8.0% maint · 8.0% mgmt
Financing live
Cash to close
- Down payment
- $35,000
- Closing costs
- $4,200
- Reserves months
- —
- Total cash needed
- —
Loan-product check · same deal, 3 products live
Conventional
25% down · 7.5% · 30yr
- Down + closing
- —
- Monthly P&I
- —
- Monthly cashflow
- —
- DSCR
- —
- Eligible?
- —
Personal DTI + credit; lowest rate.
DSCR
20% down · 8.5% · 30yr
- Down + closing
- —
- Monthly P&I
- —
- Monthly cashflow
- —
- DSCR
- —
- Eligible?
- —
No personal income docs; deal must DSCR.
Hard money
10% down · 12.0% · 12mo
- Down + closing
- —
- Monthly P&I
- —
- Monthly cashflow
- —
- DSCR
- —
- Eligible?
- —
Short-term bridge; refi at stabilization.
Rent comps 5 comps
| Address | Beds | Baths | Sqft | Rent | $/sqft | DOM | Units | Dist |
|---|---|---|---|---|---|---|---|---|
| 5721 SW 41st St West Park, FL | 3.0 | 1.0 | 839 | $2,650 | $3.16 | 25d | 1 | 1.41mi |
| 5525 SW 41st St Hollywood, FL | 2.0 | 2.0 | 1031 | $2,145 | $2.08 | 3d | 1 | 1.42mi |
| 5100 SW 41st St Pembroke Park, FL | 1.0–2.0 | 1.0–2.0 | 815 | $1,750 | $2.15 | 20d | 3 | 1.43mi |
| 5100 SW 41st St Pembroke Park, FL | 1.0–2.0 | 1.0–2.0 | 815 | $1,799 | $2.21 | 4d | 4 | 1.43mi |
| 3926 SW 52nd Ave Unit E5 Hollywood, FL | 3.0 | 2.5 | 1335 | $2,500 | $1.87 | 25d | 1 | 1.48mi |
HOA detail condo
- Monthly dues
- $415 · $4,980/yr
- Assessments
- None detected in remarks — confirm with the listing agent.
Listing history 26 events
-
2026-06-18days on market $140,000 Active 460 DOM
-
2026-06-17pricedays on market $140,000 Active 459 DOM
-
2026-06-16days on market $165,000 Active 458 DOM
-
2026-06-15days on market $165,000 Active 457 DOM
-
2026-06-13days on market $165,000 Active 455 DOM
-
2026-06-10price $165,000 Active 451 DOM
-
2026-06-09days on market $175,000 Active 451 DOM
-
2026-06-08days on market $175,000 Active 450 DOM
-
2026-06-08days on market $175,000 Active 449 DOM
-
2026-06-04days on market $175,000 Active 446 DOM
-
2026-06-03days on market $175,000 Active 445 DOM
-
2026-06-02days on market $175,000 Active 444 DOM
-
2026-06-01days on market $175,000 Active 443 DOM
-
2026-05-31days on market $175,000 Active 442 DOM
-
2026-05-24$1,900
-
2025-12-24price $175,000
-
2025-03-10$180,000 Active
-
2017-08-30soldstatus $80,000
-
2017-08-25soldstatus $80,000 Sold 119-char remark
Show marketing remark (119 chars)
Spacious 2 bedroom/2 bathroom second floor condominium with ample living space, room for small office and/or play room.
-
2017-07-11status Pending 119-char remark
Show marketing remark (119 chars)
Spacious 2 bedroom/2 bathroom second floor condominium with ample living space, room for small office and/or play room.
-
2017-06-22$78,000 Active 119-char remark
Show marketing remark (119 chars)
Spacious 2 bedroom/2 bathroom second floor condominium with ample living space, room for small office and/or play room.
-
2007-06-01soldstatus $122,500 112-char remark
Show marketing remark (112 chars)
Beautiful lake view from enclosed terrace! Recently painted. Tiled throughout. No age restriction. Easy to show.
-
2006-03-01soldstatus $122,500
-
2001-01-24soldstatus $40,000
-
1979-01-01soldstatus $28,000
-
1975-11-01soldstatus $22,800
ⓘ Source: listings_history table (triggers on properties + properties_extension) + one-shot
backfill from property_details.listing_events for pre-trigger history.
Tax reassessment forecast FL · Resets to sale price
- Current annual tax
- $637 · $53/mo
- Projected year-2 tax
- $1,162 · $97/mo
- Expected delta
- +$525/yr (+$44/mo · 82.5%)
ⓘ Screening estimate from a state-policy table — verify with the county assessor before closing.
Climate risk First Street
- Flood 4/10 Moderate FEMA zone AE · 21% chance over 30 yrs
- Wildfire 1/10 Low
- Heat 10/10 Extreme 6 d/yr ≥105°F today · 20 d/yr by 30 yrs out
- Wind 10/10 Extreme 99% chance of damaging wind over 30 yrs
- Air quality 2/10 Low 2 unhealthy d/yr today · 2 by 30 yrs out
Nearby sold comps map
Loading sold comps map…
Walkable amenities ~0.75 mi
Loading nearby amenities…
Taxation est. · year 1
- Rental income
- $26,262
- − Mortgage interest
- −$7,842
- − Property taxes
- −$637
- − Insurance
- −$5,818
- − Repairs & maintenance
- −$2,101
- − Management
- −$2,101
- − HOA
- −$4,980
- − Depreciation
- −$4,073
- Taxable loss
- −$1,290
- Est. tax savings @ 24.0%
- +$310
- After-tax cash flow
- $811/yr
For passive investors: Depreciation is non-cash, so a rental often shows a tax loss while cash-flowing — sheltering income. Rental losses are passive: they offset passive income freely, and up to $25,000/yr can offset ordinary (W-2) income if you actively participate and your MAGI is under $100k (phasing out to $0 by $150k); unused losses carry forward. On sale, claimed depreciation is recaptured at up to 25%, and gains may owe capital-gains tax (a 1031 exchange can defer both). Figures are a year-1 estimate at your 24.0% rate — not tax advice; consult a CPA.
Schools (NCES district)
- District
- Miami-Dade
- NCES district ID
- 1200390
- Math proficiency
- 45% ▼ -16.00%
- Reading proficiency
- 54% ▼ -5.00%
- Median HH income
- $43,928
- Composite
- 41.76/100
- National rank
- #3397
- State rank
- #40 of 73 in FL
Livability — Ives Estates
- Score
- 77/100
- State rank
- #191
- US rank
- #3061
Category grades
Schools grade is shown separately in the Schools card above.
Census & demographics
- County
- Miami-Dade County · 2,697,751 people
- City population
- 51,591
- Metro
- Miami-Fort Lauderdale-Pompano Beach, FL
- Population (ZIP)
- 51,591
- Household income
- $65,211
- Rent vs Own
- Severe rent burden
- 3123.0
Population outlook (Miami-Dade County) Hauer SSP2
- Today (2025)
- 3,126,439 people
- By 2030
- 3,325,765 · +6.4%
- By 2040
- 3,697,561 · +18.3%
- By 2050
- 4,012,134 · +28.3%
- By 2075
- 4,605,612 · +47.3%
- By 2100
- 4,866,598 · +55.7%
Race, ethnicity, and origin ACS 2023
- Neighborhood character
- Diverse neighborhood (Simpson 0.67)
- Race & ethnicity
- Black 39% Hispanic / Latino 38% Two or more races 23% White 19% Asian 1%
- Hispanic origin (detail)
- Mexican 1% Puerto Rican 2% Cuban 6% Dominican 3% Salvadoran 3%
- Common ancestry
- Hispanic 13% Scotch-Irish 2% Romanian 2%
- Foreign-born
- 48% · Canada, Jamaica, Dominican Republic
- Languages at home
- 42% English-only · Spanish 37% French/Haitian/Cajun 13% Other Indo-European 2%
Political lean MEDSL · Miami-Dade
- 2024 margin
- R (+11.4) · D 43.9% · R 55.4%
- 2008→2024 swing
- -27.6pp toward R · 2008: 16.1pp · 2024: -11.4pp
- All cycles
- 2024: R+11.4 2020: D+7.3 2016: D+29.6 2012: D+23.7 2008: D+16.1
Not yet ingested
- Civics
- —
Market trends
- HPI YoY
- ▼ -608.34%
- Current HPI
- 328.1733
- Rent YoY
- ▲ 0.22%
- Metro
- Miami-Fort Lauderdale-Pompano Beach, FL
- State GDP YoY
- ▲ 3.28%
- F500 in state
- 36
Industry mix (Fortune 500 HQ in FL)
| Industry | F500 HQs | Revenue |
|---|---|---|
| Industrial Technology | 2 | $29B |
|
||
| Insurance | 2 | $17B |
|
||
| Retail | 1 | $60B |
|
||
| Technology Distribution | 1 | $58B |
|
||
| Homebuilding | 1 | $35B |
|
||
| Technology Manufacturing | 1 | $35B |
|
||
Price history
-91.7% since first listed12 events — show timeline
- 2026-05-24 Listed for Rent $1,900 MARMLS
- 2025-12-24 Price Changed $175,000 MARMLS
- 2025-03-10 Listed $180,000 MARMLS
- 2017-08-30 Sold (Public Records) $80,000 Public Records
- 2017-08-25 Sold (MLS) $80,000 MARMLS
- 2017-07-11 Pending — MARMLS
- 2017-06-22 Listed $78,000 MARMLS
- 2007-06-01 Sold (MLS) $122,500 MARMLS
- 2006-03-01 Sold (Public Records) $122,500 Public Records
- 2001-01-24 Sold (Public Records) $40,000 Public Records
- 1979-01-01 Sold (Public Records) $28,000 Public Records
- 1975-11-01 Sold (Public Records) $22,800 Public Records
Property tax history
+9.0%/yrLatest (2025): $637 · +4.9% YoY. Source: county tax records.
Cash-flow waterfall
monthlySold comps — $/sqft
last 12 mo · ≤1 miLoading sold comps…