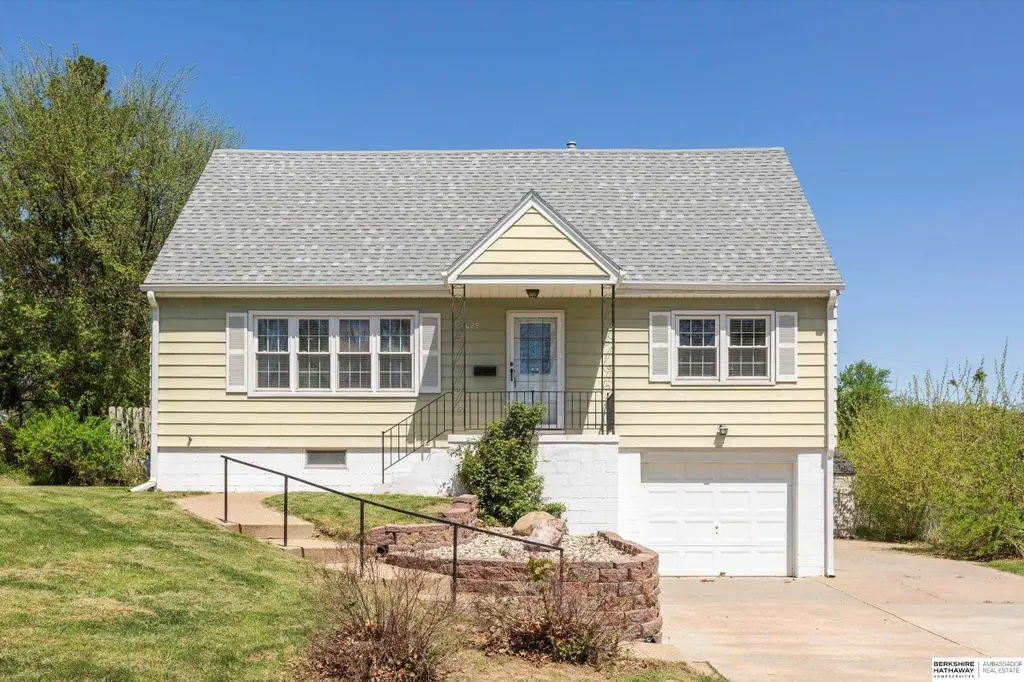
4028 Mary St · Omaha, NE
Flood risk 1/10 · Minimal
- FEMA flood zone
- X (unshaded)
- Chance of flooding over 30 yrs
- 0.0%
- Est. flood insurance / yr
- $473 – $860
Fire risk 2/10 · Minimal
- Est. fire insurance / yr
- $1,161 – $2,155
Heat risk 3/10 · Minor
- Hot days now (above 104°F)
- 7 days/yr
- Hot days in 30 yrs
- 15 days/yr
Wind risk 2/10 · Minimal
- Chance of severe wind over 30 yrs
- —
Air-quality risk 2/10 · Minimal
- Unhealthy air days now
- 0 days/yr
- Unhealthy air days in 30 yrs
- 1 days/yr
Risk factors via First Street. Map © Google.
Why this score? — see what drove the D grade
The composite is a weighted blend of 9 inputs, each scored 0–100. Each bar is that input's sub-score; the figure is the points it added to the 100-point composite (weight × sub-score).
- Cash flow +14.0/30.0
- ARV discount +7.5/15.0
- DSCR +4.2/10.0
- Livability +4.2/5.0
- 1% rule +3.7/10.0
- Rent growth +2.5/5.0
- Condition / age +2.5/5.0
- Schools +2.1/10.0
- Appreciation +0.0/10.0
$225,900
🖨 Deal sheet 📄 Offer letter ✓ Due diligence
Listing remarks MLS
Affordable 4-bedroom, 2-bath charmer in Florence! This home has been meticulously maintained with original hardwood floors throughout the home. Some lighting fixtures and plumbing fixtures have been updated as well! Just minutes from parks, shopping, and all amenities you could need. Priced to sell, don't miss out! AMA
Key facts
- Huge backyard
- New windows
- Built 1955
Tags
Neighborhood map
What this means for you Summary
Snapshot
- This is a 4-bed/1.5-bath other listed at $226k.
Deal economics
- At list price, monthly cash flow is $28 ($335/yr) — positive.
- The deal already cash-flows at list — no discount required.
- To meet the 1% rule (rent ≥ 1% of price), the offer needs to be $197k (12.7% below list).
- Recommended offer: $197k (12.7% below list) — sets the bar for 1% rule.
- Cap rate 6.4% vs local median 3.6% in Omaha — top-decile yield for the area; either an underpriced asset or a hidden risk that comps aren't pricing in. Stress-test before assuming the spread holds.
Location & tenants
- Location reads 84/100 on livability (#7 in NE, #663 nationally) — a professional / high-income tenant draw. Strengths: amenities A+, commute A+, cost of living A+; Watch: crime F.
- Omaha Public Schools (urban): math 20% / reading 28% proficiency, ranked #110 of 111 in NE (top 99%) — low school quality limits family demand, transient renter base, plan for 1-2y turnover; 62% free/reduced lunch — lower-income household profile, screen leases tightly.
- Market conditions: 57 active listings in the ZIP; 8 comparable units currently listed for rent nearby; rentals at typical pace (median 24d on market — plan ~3-4 weeks tenant-placement turnaround); 4,539 units permitted in Douglas County in 2024 (2,583 in 5+ unit buildings).
- This rent runs 42% of the median local income ($56k/yr) — at the standard rent-burdened threshold; future hikes will face affordability resistance.
Forward outlook
- Local home prices are declining (-3.0%/yr); year-one equity from $2k of loan paydown is wiped out by about $7k of value loss. Plan a longer hold.
- Douglas County population projected at +28% by 2050 — long-run rental-demand tailwind backs the buy-and-hold thesis.
Negotiation context
- It's been on market 20 days — a 2% lower offer ($223k) is reasonable based on typical stale-listing flexibility.
Risks & watch-outs
- Watch-outs: built in 1955 — expect roof / HVAC / electrical / plumbing capex.
Questions for the listing agent
- Built in 1955 — when were the roof, HVAC, electrical panel, plumbing, and water heater last replaced?
- Is there a deadline driving the sale (1031 exchange, divorce, estate, relocation)? That informs how much negotiation room exists.
- Crime grade is F in this area — have there been break-ins, vandalism, or insurance claims at this property in the last 3 years? What carrier currently insures it and at what premium?
- The area grade is low — what's the realistic commute time and amenity access for the typical tenant pool here? Any planned neighborhood developments (good or bad) we should know about?
- What's the average days-on-market for RENTAL listings here right now (not sales)? A rising rental-DOM trend means longer vacancies and softer asking-rent achievability than the comps imply.
- What's the recent tenant-quality profile in this submarket — average credit score on applications, eviction rate, late-payment / NSF rate, and stable-employment percentage? A property-management company in the area should have these aggregated.
- How much new for-sale + rental construction is in the pipeline within 1–3 miles? Heavy new supply typically softens prices + rents 12–24 months out; constrained supply supports both.
Investment metrics
- 1% rule
- 0.87% ✗
- Cap rate
- 6.44%
- Cash-on-cash
- 0.53%
- DSCR
- 1.02
- GRM
- 9.5
CMA / ARV
No comps found within radius.
Projected returns pro-forma
-3.0% appreciation · 3.0% rent growth · sell at horizon
- IRR
- -15.5%
- Equity multiple
- 0.45×
- Total profit
- $-34,819
- Equity at exit
- $33,682
- IRR
- -6.9%
- Equity multiple
- 0.56×
- Total profit
- $-27,990
- Equity at exit
- $19,532
Cash invested: $63,252 (down + closing). Projections, not guarantees.
Landlord ↔ Tenant lean methodology
- Overall (STATE)
- 83 Strongly Landlord-Friendly
- State Nebraska
- 83 Strongly Landlord-Friendly · R+13
- County
- — inherits STATE
- City
- — inherits STATE
ZIP-level market 68112
- Home prices YoY
- -29.4%
- Active inventory
- 57
- Price-to-rent
- 9.5×
Monthly cashflow live
- Estimated rent
- $1,971 high interval (Pro) →
- Mortgage (P&I)
- −$1,185
- Tax from tax record
- −$251 /mo · $3,008/yr
- Insurance
- −$94
- HOA
- −$0
- Vacancy / Maint / Mgmt
- −$414
- Net cashflow
- $28
Break-even live
UW: 25.0% down · 7.5% · 30yr · 1.5% tax · 5.0% vac · 8.0% maint · 8.0% mgmt
Financing live
Cash to close
- Down payment
- $56,475
- Closing costs
- $6,777
- Reserves months
- —
- Total cash needed
- —
Loan-product check · same deal, 3 products live
Conventional
25% down · 7.5% · 30yr
- Down + closing
- —
- Monthly P&I
- —
- Monthly cashflow
- —
- DSCR
- —
- Eligible?
- —
Personal DTI + credit; lowest rate.
DSCR
20% down · 8.5% · 30yr
- Down + closing
- —
- Monthly P&I
- —
- Monthly cashflow
- —
- DSCR
- —
- Eligible?
- —
No personal income docs; deal must DSCR.
Hard money
10% down · 12.0% · 12mo
- Down + closing
- —
- Monthly P&I
- —
- Monthly cashflow
- —
- DSCR
- —
- Eligible?
- —
Short-term bridge; refi at stabilization.
Rent comps 8 comps
| Address | Beds | Baths | Sqft | Rent | $/sqft | DOM | Units | Dist |
|---|---|---|---|---|---|---|---|---|
| 3501 Weber Cir Omaha, NE | 3.0 | 2.0 | 1600 | $1,700 | $1.06 | 10d | 1 | 0.51mi |
| 4655 Curtis Ave Omaha, NE | 3.0 | 2.0 | 2000 | $1,900 | $0.95 | 43d | 1 | 0.60mi |
| 4706 Kansas Ave Omaha, NE | 5.0 | 2.0 | 1412 | $1,750 | $1.24 | 14d | 1 | 0.71mi |
| 3188 Stone Ave Omaha, NE | 4.0 | 2.0 | 2285 | $2,050 | $0.90 | 43d | 1 | 0.75mi |
| 3030 Ernst St Omaha, NE | 3.0 | 2.0 | 1500 | $1,500 | $1.00 | 2d | 1 | 0.82mi |
| 7608 N 29th St Omaha, NE | 4.0 | 2.0 | 2040 | $2,200 | $1.08 | 2d | 1 | 1.03mi |
| 4240 Fowler Ave Omaha, NE | 4.0 | 2.0 | 1956 | $1,895 | $0.97 | 23d | 1 | 1.29mi |
| 2436 Laurel Ave Omaha, NE | 3.0 | 1.0 | 1582 | $1,495 | $0.95 | 23d | 1 | 1.37mi |
Listing history 14 events
-
2026-06-15days on market $225,900 Active 20 DOM
-
2026-06-13days on market $225,900 Active 18 DOM
-
2026-06-10days on market $225,900 Active 15 DOM
-
2026-06-09days on market $225,900 Active 14 DOM
-
2026-06-08days on market $225,900 Active 13 DOM
-
2026-06-07days on market $225,900 Active 12 DOM
-
2026-06-03days on market $225,900 Active 8 DOM
-
2026-06-03days on market $225,900 Active 7 DOM
-
2026-06-01days on market $225,900 Active 6 DOM
-
2026-06-01days on market $225,900 Active 5 DOM
-
2025-05-13soldstatus $200,000
-
2025-05-09soldstatus $200,000 Sold 320-char remark
Show marketing remark (320 chars)
Affordable 4-bedroom, 2-bath charmer in Florence! This home has been meticulously maintained with original hardwood floors throughout the home. Some lighting fixtures and plumbing fixtures have been updated as well! Just minutes from parks, shopping, and all amenities you could need. Priced to sell, don't miss out! AMA
-
2025-05-02status Pending 320-char remark
Show marketing remark (320 chars)
Affordable 4-bedroom, 2-bath charmer in Florence! This home has been meticulously maintained with original hardwood floors throughout the home. Some lighting fixtures and plumbing fixtures have been updated as well! Just minutes from parks, shopping, and all amenities you could need. Priced to sell, don't miss out! AMA
-
2025-04-30$210,000 New 320-char remark
Show marketing remark (320 chars)
Affordable 4-bedroom, 2-bath charmer in Florence! This home has been meticulously maintained with original hardwood floors throughout the home. Some lighting fixtures and plumbing fixtures have been updated as well! Just minutes from parks, shopping, and all amenities you could need. Priced to sell, don't miss out! AMA
ⓘ Source: listings_history table (triggers on properties + properties_extension) + one-shot
backfill from property_details.listing_events for pre-trigger history.
Tax reassessment forecast NE · Resets to sale price
- Current annual tax
- $3,008 · $251/mo
- Projected year-2 tax
- $3,908 · $326/mo
- Expected delta
- +$900/yr (+$75/mo · 29.9%)
ⓘ Screening estimate from a state-policy table — verify with the county assessor before closing.
Climate risk First Street
- Flood 1/10 Low FEMA zone X (unshaded) · 0% chance over 30 yrs
- Wildfire 2/10 Low
- Heat 3/10 Moderate 7 d/yr ≥104°F today · 15 d/yr by 30 yrs out
- Wind 2/10 Low
- Air quality 2/10 Low 0 unhealthy d/yr today · 1 by 30 yrs out
Nearby sold comps map
Loading sold comps map…
Walkable amenities ~0.75 mi
Loading nearby amenities…
Taxation est. · year 1
- Rental income
- $23,656
- − Mortgage interest
- −$12,654
- − Property taxes
- −$3,008
- − Insurance
- −$1,130
- − Repairs & maintenance
- −$1,892
- − Management
- −$1,892
- − Depreciation
- −$6,572
- Taxable loss
- −$3,492
- Est. tax savings @ 24.0%
- +$838
- After-tax cash flow
- $1,173/yr
For passive investors: Depreciation is non-cash, so a rental often shows a tax loss while cash-flowing — sheltering income. Rental losses are passive: they offset passive income freely, and up to $25,000/yr can offset ordinary (W-2) income if you actively participate and your MAGI is under $100k (phasing out to $0 by $150k); unused losses carry forward. On sale, claimed depreciation is recaptured at up to 25%, and gains may owe capital-gains tax (a 1031 exchange can defer both). Figures are a year-1 estimate at your 24.0% rate — not tax advice; consult a CPA.
Schools (NCES district)
- District
- Omaha Public Schools
- NCES district ID
- 3174820
- Math proficiency
- 20% ▼ -10.00%
- Reading proficiency
- 28% ▼ -5.00%
- Median HH income
- $46,039
- Composite
- 20.83/100
- National rank
- #8502
- State rank
- #110 of 111 in NE
Livability — Omaha
- Score
- 84/100
- State rank
- #7
- US rank
- #663
Category grades
Schools grade is shown separately in the Schools card above.
Census & demographics
- Census place
- Omaha, NE
- County
- Douglas County · 538,646 people
- City population
- 552,986
- Metro
- Omaha-Council Bluffs, NE-IA
- Population (ZIP)
- 12,071
- Household income
- $56,159
- Rent vs Own
- Severe rent burden
- 385.0
Population outlook (Douglas County) Hauer SSP2
- Today (2025)
- 625,245 people
- By 2030
- 661,613 · +5.8%
- By 2040
- 732,395 · +17.1%
- By 2050
- 801,988 · +28.3%
- By 2075
- 968,637 · +54.9%
- By 2100
- 1,101,871 · +76.2%
Race, ethnicity, and origin ACS 2023
- Neighborhood character
- Diverse neighborhood (Simpson 0.59)
- Race & ethnicity
- White 59% Black 23% Two or more races 11% Hispanic / Latino 11%
- Hispanic origin (detail)
- Mexican 9%
- Common ancestry
- Romanian 5% Lithuanian 2% Portuguese 2%
- Foreign-born
- 5% · Canada
- Languages at home
- 89% English-only · Spanish 9% Other Asian/Pacific 1%
Political lean MEDSL · Douglas
- 2024 margin
- D (+10.2) · D 54.4% · R 44.2% · Other 1.4%
- 2008→2024 swing
- +5.5pp toward D · 2008: 4.6pp · 2024: 10.2pp
- All cycles
- 2024: D+10.2 2020: D+11.3 2016: D+1.4 2012: R+4.3 2008: D+4.6
Not yet ingested
- Civics
- —
Market trends
- HPI YoY
- ▼ -105.85%
- Current HPI
- 254.385
- Rent YoY
- —
- Metro
- Omaha-Council Bluffs, NE-IA
- State GDP YoY
- ▲ 0.68%
- F500 in state
- 2
Industry mix (Fortune 500 HQ in NE)
| Industry | F500 HQs | Revenue |
|---|---|---|
| Conglomerate | 1 | $371B |
|
||
Price history
-4.8% since first listed4 events — show timeline
- 2025-05-13 Sold (Public Records) $200,000 Public Records
- 2025-05-09 Sold (MLS) $200,000 GPRMLS
- 2025-05-02 Pending — GPRMLS
- 2025-04-30 Listed $210,000 GPRMLS
Property tax history
+10.8%/yrLatest (2025): $3,008 · +12.6% YoY. Source: county tax records.
Cash-flow waterfall
monthlySold comps — $/sqft
last 12 mo · ≤1 miLoading sold comps…