556 Santa Fe · Bellevue, MI
Flood risk No data
- FEMA flood zone
- —
- Chance of flooding over 30 yrs
- —
- Est. flood insurance / yr
- —
Fire risk No data
- Est. fire insurance / yr
- —
Heat risk No data
- Hot days now (above threshold)
- —
- Hot days in 30 yrs
- —
Wind risk No data
- Chance of severe wind over 30 yrs
- —
Air-quality risk No data
- Unhealthy air days now
- —
- Unhealthy air days in 30 yrs
- —
Risk factors via First Street. Map © Google.
Why this score? — see what drove the C+ grade
The composite is a weighted blend of 9 inputs, each scored 0–100. Each bar is that input's sub-score; the figure is the points it added to the 100-point composite (weight × sub-score).
- Cash flow +25.9/30.0
- 1% rule +10.0/10.0
- DSCR +8.7/10.0
- ARV discount +7.5/15.0
- Livability +3.5/5.0
- Rent growth +2.5/5.0
- Condition / age +2.2/5.0
- Schools +2.0/10.0
- Appreciation +0.0/10.0
$39,000
🖨 Deal sheet 📄 Offer letter ✓ Due diligence
Listing remarks MLS
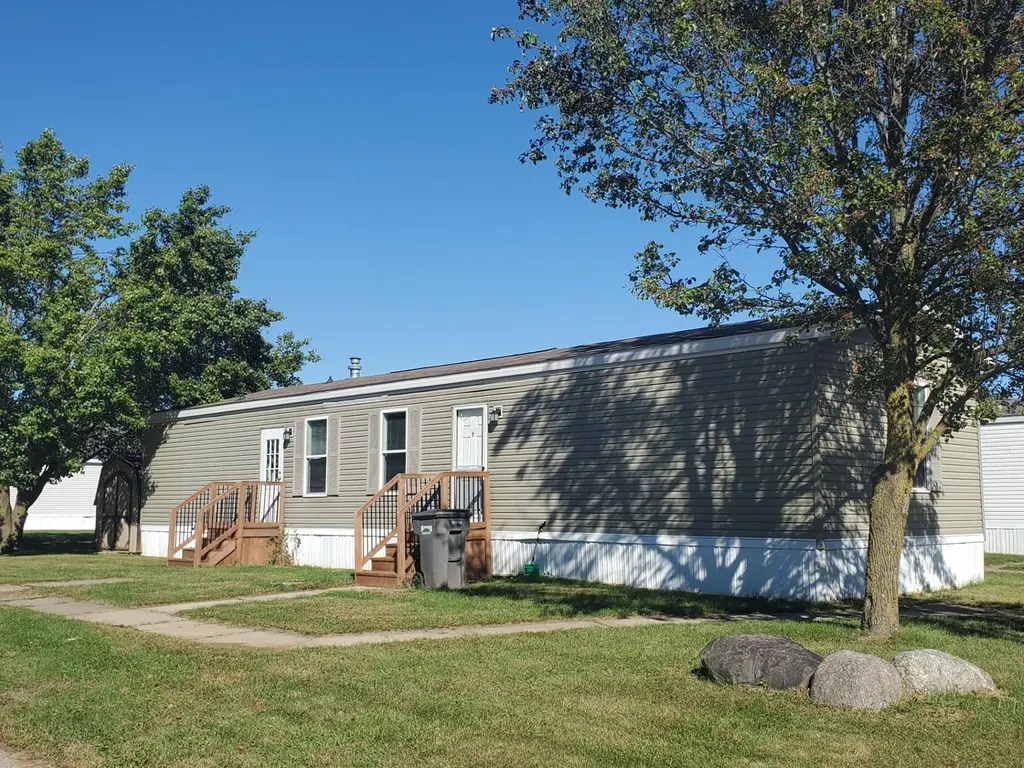
Year: 2014 Make: Harmony * * * * * Land is leased, not owned * * * * * *
Key facts
- Built 2025
- Listed 226 days
Neighborhood map
What this means for you Summary
Snapshot
- This is a 3-bed/1.0-bath manufactured listed at $39k. Condition is rated fair.
Deal economics
- At list price, monthly cash flow is $96 ($1k/yr) — positive.
- The deal already cash-flows at list — no discount required.
- Meets the 1% rule at list price ($1k rent vs $39k).
- Recommended offer: $34k (12.0% below list) — sets the bar for market timing.
- Cap rate 9.3% vs local median 3.3% in Bellevue — top-decile yield for the area; either an underpriced asset or a hidden risk that comps aren't pricing in. Stress-test before assuming the spread holds.
Location & tenants
- Location reads 69/100 on livability (#355 in MI) — a middle-class / working-renter tenant base. Strengths: cost of living A+, housing A+, crime A; Watch: schools D+, amenities F, commute F.
- Bellevue Community Schools (rural): math 14% / reading 30% proficiency, ranked #445 of 540 in MI (top 82%) — low school quality limits family demand, transient renter base, plan for 1-2y turnover.
- Market conditions: 56 active listings in the ZIP; 98 units permitted in Eaton County in 2024 (0 in 5+ unit buildings).
Forward outlook
- Local home prices are declining (-3.0%/yr); year-one equity from $270 of loan paydown is wiped out by about $1k of value loss. Plan a longer hold.
- Eaton County population projected to shrink 5% by 2050 — rents likely to lag national; underwrite the cash flow, not the appreciation.
- At projected returns (-3.0% appreciation + 3.0% rent growth), your $11k cash investment doubles in ~10 years — after that, you're playing with house money.
Negotiation context
- It's been on market 227 days — a 12% lower offer ($34k) is reasonable based on typical stale-listing flexibility.
Risks & watch-outs
- Watch-outs: HOA is 47% of rent.
Questions for the listing agent
- It's been on market 227 days. Have you received any prior offers? Is the seller open to a 12% concession, seller financing, or rate buy-down credit?
- Have any recent inspections been done? Can we get a copy of the seller's disclosures and any deferred-maintenance estimates?
- What does the HOA fee cover, when was the last increase, and are there any pending special assessments or reserve-fund shortfalls?
- Why hasn't it sold? Are there any deal-killer items the seller is aware of (foundation, flood, title, zoning, code violations)?
- Is there a deadline driving the sale (1031 exchange, divorce, estate, relocation)? That informs how much negotiation room exists.
- Schools are D-rated, which usually means shorter tenancies and higher turnover. Who's the typical renter profile here, and what's been the actual vacancy rate?
- What's the average days-on-market for RENTAL listings here right now (not sales)? A rising rental-DOM trend means longer vacancies and softer asking-rent achievability than the comps imply.
- What's the recent tenant-quality profile in this submarket — average credit score on applications, eviction rate, late-payment / NSF rate, and stable-employment percentage? A property-management company in the area should have these aggregated.
- How much new for-sale + rental construction is in the pipeline within 1–3 miles? Heavy new supply typically softens prices + rents 12–24 months out; constrained supply supports both.
Investment metrics
- 1% rule
- 2.97% ✓
- Cap rate
- 9.26%
- Cash-on-cash
- 10.58%
- DSCR
- 1.47
- GRM
- 2.8
CMA / ARV
No comps found within radius.
Projected returns pro-forma
-3.0% appreciation · 3.0% rent growth · sell at horizon
- IRR
- 0.4%
- Equity multiple
- 1.02×
- Total profit
- $168
- Equity at exit
- $5,815
- IRR
- 10.8%
- Equity multiple
- 1.87×
- Total profit
- $9,486
- Equity at exit
- $3,372
Cash invested: $10,920 (down + closing). Projections, not guarantees.
Landlord ↔ Tenant lean methodology
- Overall (STATE)
- 62 Landlord-Friendly
- State Michigan
- 62 Landlord-Friendly · EVEN
- County
- — inherits STATE
- City
- — inherits STATE
ZIP-level market 49021
- Home prices YoY
- -10.1%
- Active inventory
- 56
- Price-to-rent
- 2.8×
Monthly cashflow live
- Estimated rent
- $1,159 medium interval (Pro) →
- Mortgage (P&I)
- −$205
- Tax est. 1.5%
- −$49 /mo · $585/yr
- Insurance
- −$16
- HOA
- −$550
- Vacancy / Maint / Mgmt
- −$243
- Net cashflow
- $96
Break-even live
UW: 25.0% down · 7.5% · 30yr · 1.5% tax · 5.0% vac · 8.0% maint · 8.0% mgmt
Financing live
Cash to close
- Down payment
- $9,750
- Closing costs
- $1,170
- Reserves months
- —
- Total cash needed
- —
Loan-product check · same deal, 3 products live
Conventional
25% down · 7.5% · 30yr
- Down + closing
- —
- Monthly P&I
- —
- Monthly cashflow
- —
- DSCR
- —
- Eligible?
- —
Personal DTI + credit; lowest rate.
DSCR
20% down · 8.5% · 30yr
- Down + closing
- —
- Monthly P&I
- —
- Monthly cashflow
- —
- DSCR
- —
- Eligible?
- —
No personal income docs; deal must DSCR.
Hard money
10% down · 12.0% · 12mo
- Down + closing
- —
- Monthly P&I
- —
- Monthly cashflow
- —
- DSCR
- —
- Eligible?
- —
Short-term bridge; refi at stabilization.
HOA detail
- Monthly dues
- $550 · $6,600/yr
Listing history 18 events
-
2026-06-19days on market $39,000 Active 227 DOM
-
2026-06-18days on market $39,000 Active 226 DOM
-
2026-06-17days on market $39,000 Active 225 DOM
-
2026-06-16days on market $39,000 Active 224 DOM
-
2026-06-15days on market $39,000 Active 223 DOM
-
2026-06-14days on market $39,000 Active 221 DOM
-
2026-06-13days on market $39,000 Active 220 DOM
-
2026-06-10days on market $39,000 Active 218 DOM
-
2026-06-09days on market $39,000 Active 217 DOM
-
2026-06-08days on market $39,000 Active 216 DOM
-
2026-06-07days on market $39,000 Active 215 DOM
-
2026-06-05days on market $39,000 Active 212 DOM
-
2026-06-03days on market $39,000 Active 211 DOM
-
2026-06-02days on market $39,000 Active 210 DOM
-
2026-06-01days on market $39,000 Active 209 DOM
-
2026-05-31days on market $39,000 Active 208 DOM
-
2026-05-30days on market $39,000 Active 207 DOM
-
2025-11-04$39,000 Active 83-char remark
Show marketing remark (83 chars)
Year: 2014 Make: Harmony * * * * * Land is leased, not owned * * * * * *
ⓘ Source: listings_history table (triggers on properties + properties_extension) + one-shot
backfill from property_details.listing_events for pre-trigger history.
Nearby sold comps map
Loading sold comps map…
Walkable amenities ~0.75 mi
Loading nearby amenities…
Taxation est. · year 1
- Rental income
- $13,911
- − Mortgage interest
- −$2,185
- − Property taxes
- −$585
- − Insurance
- −$195
- − Repairs & maintenance
- −$1,113
- − Management
- −$1,113
- − HOA
- −$6,600
- − Depreciation
- −$1,135
- Taxable income
- $986
- Est. tax owed @ 24.0%
- −$237
- After-tax cash flow
- $919/yr
For passive investors: Depreciation is non-cash, so a rental often shows a tax loss while cash-flowing — sheltering income. Rental losses are passive: they offset passive income freely, and up to $25,000/yr can offset ordinary (W-2) income if you actively participate and your MAGI is under $100k (phasing out to $0 by $150k); unused losses carry forward. On sale, claimed depreciation is recaptured at up to 25%, and gains may owe capital-gains tax (a 1031 exchange can defer both). Figures are a year-1 estimate at your 24.0% rate — not tax advice; consult a CPA.
Condition & rehab AI · 2 photos
A manufactured home with cosmetic updates needed, offering a good starting point for a potential investor.
Repairs flagged
- Minor Paint — Light wear on walls
- Minor Siding — Light wear
Value-add opportunities
- Both Paint exterior and interior — Enhances curb appeal and interior aesthetics
- Both Replace carpet with hardwood or tile — Improves durability and adds value
- Both Install new windows — Enhances energy efficiency and curb appeal
Renovation cost estimate screening
| Repair item | Severity | Est. cost |
|---|---|---|
| Paint · Light wear on walls | Minor | $500–3,000 |
| Siding · Light wear | Minor | $500–3,000 |
| Total estimated repair cost · 2 items | $1,000–6,000 |
Value-add ROI direction
- Both Paint exterior and interior — Enhances curb appeal and interior aesthetics ↑
- Both Replace carpet with hardwood or tile — Improves durability and adds value ↑
- Both Install new windows — Enhances energy efficiency and curb appeal ↑
ⓘ Cost ranges are severity-bucket heuristics (US national rule-of-thumb). Get contractor quotes + a written scope before underwriting a rehab budget.
Schools (NCES district)
- District
- Bellevue Community Schools
- NCES district ID
- 2604650
- Math proficiency
- 14% ▼ -5.00%
- Reading proficiency
- 30% ▼ -7.00%
- Median HH income
- $50,826
- Composite
- 19.59/100
- National rank
- #8757
- State rank
- #445 of 540 in MI
Livability — Bellevue
- Score
- 69/100
- State rank
- #355
- US rank
- #9043
Category grades
Schools grade is shown separately in the Schools card above.
Census & demographics
- Census place
- Bellevue, MI
- Population (ZIP)
- 6,467
Population outlook (Eaton County) Hauer SSP2
- Today (2025)
- 110,811 people
- By 2030
- 110,598 · -0.2%
- By 2040
- 108,304 · -2.3%
- By 2050
- 104,961 · -5.3%
- By 2075
- 97,197 · -12.3%
- By 2100
- 85,150 · -23.2%
Race, ethnicity, and origin ACS 2023
- Neighborhood character
- Predominantly White (91%)
- Race & ethnicity
- White 91% Hispanic / Latino 4% Two or more races 4% Black 2%
- Common ancestry
- Iranian 4% Romanian 2% Lithuanian 2%
- Foreign-born
- 1% · Canada
- Languages at home
- 97% English-only · German/W. Germanic 1% Spanish 1%
Political lean MEDSL · Eaton
- 2024 margin
- Toss-up / Even · D 47.6% · R 50.8% · Other 1.6%
- 2008→2024 swing
- -11.6pp toward R · 2008: 8.4pp · 2024: -3.1pp
- All cycles
- 2024: R+3.1 2020: R+0.8 2016: R+5.5 2012: D+3.1 2008: D+8.4
Not yet ingested
- Civics
- —
Market trends
- HPI YoY
- ▼ -30.20%
- Current HPI
- 267.6519
- Rent YoY
- —
- Metro
- —
- State GDP YoY
- ▲ 1.37%
- F500 in state
- 28
Industry mix (Fortune 500 HQ in MI)
| Industry | F500 HQs | Revenue |
|---|---|---|
| Automotive Parts | 3 | $48B |
|
||
| Automotive | 2 | $372B |
|
||
| Chemicals | 1 | $45B |
|
||
| Automotive Retail | 1 | $29B |
|
||
| Healthcare / Medical Devices | 1 | $23B |
|
||
| Automotive Technology | 1 | $20B |
|
||
Price history
1 event — show timeline
- 2025-11-04 Listed $39,000 Zillow
Cash-flow waterfall
monthlySold comps — $/sqft
last 12 mo · ≤1 miLoading sold comps…