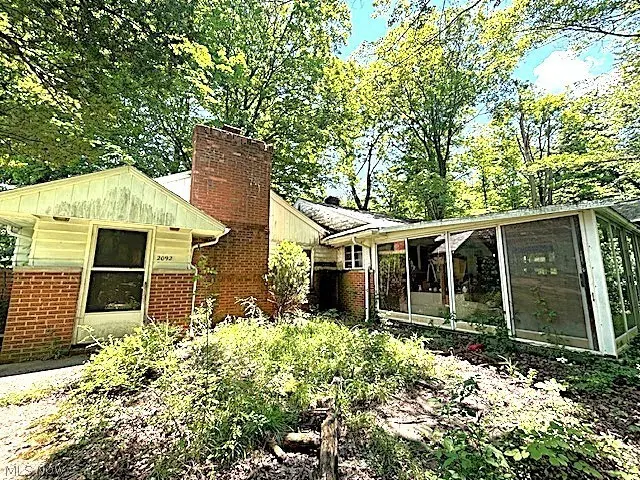
2092 Holmes Dr · Twinsburg, OH
Flood risk 1/10 · Minimal
- FEMA flood zone
- X (unshaded)
- Chance of flooding over 30 yrs
- 0.0%
- Est. flood insurance / yr
- $507 – $1,088
Fire risk 1/10 · Minimal
- Est. fire insurance / yr
- $713 – $1,323
Heat risk 2/10 · Minimal
- Hot days now (above 96°F)
- 7 days/yr
- Hot days in 30 yrs
- 16 days/yr
Wind risk 1/10 · Minimal
- Chance of severe wind over 30 yrs
- —
Air-quality risk 2/10 · Minimal
- Unhealthy air days now
- 1 days/yr
- Unhealthy air days in 30 yrs
- 3 days/yr
Risk factors via First Street. Map © Google.
Why this score? — see what drove the B grade
The composite is a weighted blend of 9 inputs, each scored 0–100. Each bar is that input's sub-score; the figure is the points it added to the 100-point composite (weight × sub-score).
- Cash flow +30.0/30.0
- 1% rule +10.0/10.0
- DSCR +10.0/10.0
- ARV discount +7.5/15.0
- Schools +6.2/10.0
- Livability +4.0/5.0
- Rent growth +2.5/5.0
- Condition / age +2.5/5.0
- Appreciation +0.0/10.0
$125,000
🖨 Deal sheet 📄 Offer letter ✓ Due diligence
Listing remarks
Location! Location! Location! Twinsburg! Look at this fantastic property opportunity! 4.94 ACRES! This property is nestled back at the end of Holmes Drive offering a secluded 2 Bedroom/1 bath Ranch home on acreage just short of 5 Acres! Beautiful wooded lot! Renovate the home to your liking or knock down and Build to Suit! The existing home on the property is in need of full renovation, good bones- with some TLC, bring this gem back to life! The existing home offers a large living room area with woodburning fireplace, open layout, private dining room, Large Kitchen, 2 full bedrooms, first floor laundry/utility area, closets, bonus room, one full bathroom and nice sized enclosed back patio a
Key facts
- 4.94 acre lot
- Built 1956
Property features AI
Finance
- Financial info: Annual tax amount listed
Exterior
- Utilities: Well water; Septic system
- Home design: Single-story home; Above-grade living area about 1,562 (public records)
- Construction: Asphalt/fiberglass roof; Year built per public records
- Exterior features: Rear porch; Lot about 4.94 acres
Interior
- Bedrooms: 2 main-level bedrooms
- Bathrooms: 1 full bathroom on the main level
- Heating & cooling: Gas heating
- Interior features: Fireplace (1)
- Laundry & utility: Washer hookup; Electric dryer hookup
Neighborhood map
What this means for you Summary
Snapshot
- This is a 2-bed/1.0-bath single-family listed at $125k.
Deal economics
- At list price, monthly cash flow is $481 ($6k/yr) — positive.
- The deal already cash-flows at list — no discount required.
- Meets the 1% rule at list price ($2k rent vs $125k).
- Cap rate 10.9% vs local median 3.7% in Twinsburg — top-decile yield for the area; either an underpriced asset or a hidden risk that comps aren't pricing in. Stress-test before assuming the spread holds.
Location & tenants
- Location reads 81/100 on livability (#95 in OH, #1,475 nationally) — a professional / high-income tenant draw. Strengths: schools A+, crime A+, employment A+; Watch: amenities F, commute F.
- Twinsburg City (suburban): math 67% / reading 75% proficiency, ranked #119 of 656 in OH (top 18%) — strong family-tenant draw, lease renewals of 3-5y typical; only 14% free/reduced lunch — higher-income household profile.
- Market conditions: 67 active listings in the ZIP; 3 comparable units currently listed for rent nearby; rentals at typical pace (median 17d on market — plan ~3-4 weeks tenant-placement turnaround); solid renter incomes; 1,114 units permitted in Summit County in 2024 (397 in 5+ unit buildings).
Forward outlook
- Local home prices are declining (-3.0%/yr); year-one equity from $864 of loan paydown is wiped out by about $4k of value loss. Plan a longer hold.
- Summit County population projected to shrink 6% by 2050 — rents likely to lag national; underwrite the cash flow, not the appreciation.
- At projected returns (-3.0% appreciation + 3.0% rent growth), your $35k cash investment doubles in ~8 years — after that, you're playing with house money.
Negotiation context
- Only 1 days on market — expect competitive offers; lowballing is unlikely to land.
- 3 sale attempts with the ask held roughly flat each time — persistent listings suggest the price (not the market) is what's stuck; bring a comps-based counter.
Risks & watch-outs
- Watch-outs: property tax is 3.0% of price; built in 1956 — expect roof / HVAC / electrical / plumbing capex.
Questions for the listing agent
- Built in 1956 — when were the roof, HVAC, electrical panel, plumbing, and water heater last replaced?
- Property tax is high relative to price — has the assessment been appealed recently, and will the sale trigger a re-assessment?
- Is there a deadline driving the sale (1031 exchange, divorce, estate, relocation)? That informs how much negotiation room exists.
- Schools are A-rated — typically a magnet for longer-tenancy family renters. What's the average tenant stay here, and is there a school-zone premium baked into asking?
- What's the average days-on-market for RENTAL listings here right now (not sales)? A rising rental-DOM trend means longer vacancies and softer asking-rent achievability than the comps imply.
- What's the recent tenant-quality profile in this submarket — average credit score on applications, eviction rate, late-payment / NSF rate, and stable-employment percentage? A property-management company in the area should have these aggregated.
- How much new for-sale + rental construction is in the pipeline within 1–3 miles? Heavy new supply typically softens prices + rents 12–24 months out; constrained supply supports both.
Investment metrics
- 1% rule
- 1.52% ✓
- Cap rate
- 10.91%
- Cash-on-cash
- 16.48%
- DSCR
- 1.73
- GRM
- 5.5
CMA / ARV
- ARV (on-the-fly)
- $296,780
- Comps found
- 9
Show comp detail 9 sales within ~0.75 mi
| Address | Dist | Beds/Ba | Sqft | Sold | Price | $/sf | Match |
|---|---|---|---|---|---|---|---|
| 9261 Gettysburg Dr | 0.19mi | 3/2.0 (+1) | 1,604 (+3%) | 19mo | $295,000 | $184 | 62 |
| 9415 Lawnfield Dr | 0.43mi | 3/2.0 (+1) | 1,448 (-7%) | 1mo | $340,000 | $235 | 58 |
| 9402 Gettysburg Dr | 0.24mi | 3/1.5 (+1) | 1,512 (-3%) | 23mo | $310,000 | $205 | 58 |
| 9410 Hyde Park Dr | 0.40mi | 3/2.0 (+1) | 1,556 (-0%) | 23mo | $266,000 | $171 | 52 |
| 1981 Presidential Pkwy | 0.39mi | 3/1.5 (+1) | 1,700 (+9%) | 21mo | $210,000 | $124 | 42 |
| 9097 Gettysburg Dr | 0.47mi | 3/2.0 (+1) | 1,754 (+12%) | 8mo | $214,000 | $122 | 41 |
| 9082 Merryvale Dr | 0.68mi | 2/2.0 | 1,451 (-7%) | 16mo | $295,000 | $203 | 39 |
| 8807 Gettysburg Dr | 0.68mi | 3/2.0 (+1) | 1,606 (+3%) | 22mo | $323,500 | $201 | 36 |
| 8838 Gettysburg Dr | 0.67mi | 3/2.5 (+1) | 1,658 (+6%) | 24mo | $315,000 | $190 | 28 |
Match score weights: distance 35% · size 25% · config 20% · recency 20%. Top-matched comps best support the ARV.
Projected returns pro-forma
-3.0% appreciation · 3.0% rent growth · sell at horizon
- IRR
- 7.7%
- Equity multiple
- 1.30×
- Total profit
- $10,488
- Equity at exit
- $18,638
- IRR
- 17.0%
- Equity multiple
- 2.40×
- Total profit
- $49,061
- Equity at exit
- $10,808
Cash invested: $35,000 (down + closing). Projections, not guarantees.
Landlord ↔ Tenant lean methodology
- Overall (STATE)
- 73 Landlord-Friendly
- State Ohio
- 73 Landlord-Friendly · R+6
- County
- — inherits STATE
- City
- — inherits STATE
ZIP-level market 44087
- Active inventory
- 67
- Price-to-rent
- 5.5×
Monthly cashflow live
- Estimated rent
- $1,897 medium interval (Pro) →
- Mortgage (P&I)
- −$656
- Tax from tax record
- −$310 /mo · $3,720/yr
- Insurance
- −$52
- HOA
- −$0
- Vacancy / Maint / Mgmt
- −$398
- Net cashflow
- $481
Break-even live
UW: 25.0% down · 7.5% · 30yr · 1.5% tax · 5.0% vac · 8.0% maint · 8.0% mgmt
Financing live
Cash to close
- Down payment
- $31,250
- Closing costs
- $3,750
- Reserves months
- —
- Total cash needed
- —
Loan-product check · same deal, 3 products live
Conventional
25% down · 7.5% · 30yr
- Down + closing
- —
- Monthly P&I
- —
- Monthly cashflow
- —
- DSCR
- —
- Eligible?
- —
Personal DTI + credit; lowest rate.
DSCR
20% down · 8.5% · 30yr
- Down + closing
- —
- Monthly P&I
- —
- Monthly cashflow
- —
- DSCR
- —
- Eligible?
- —
No personal income docs; deal must DSCR.
Hard money
10% down · 12.0% · 12mo
- Down + closing
- —
- Monthly P&I
- —
- Monthly cashflow
- —
- DSCR
- —
- Eligible?
- —
Short-term bridge; refi at stabilization.
Rent comps 3 comps
| Address | Beds | Baths | Sqft | Rent | $/sqft | DOM | Units | Dist |
|---|---|---|---|---|---|---|---|---|
| 2639 Arbor Glen Dr Twinsburg, OH | 1.0–2.0 | 1.0–2.0 | 1019 | $1,735 | $1.70 | 1d | 17 | 0.99mi |
| 2617 Aubrey Ln Twinsburg, OH | 2.0 | 2.0 | 1326 | $2,328 | $1.76 | 16d | 1 | 1.09mi |
| 9214 Blueberry Ln Macedonia, OH | 3.0 | 1.5 | 1176 | $1,500 | $1.28 | 20d | 1 | 1.28mi |
Listing history 6 events
-
2026-05-20status Pending
-
2026-05-19$125,000 Active
-
2026-04-25status Active
-
2026-04-25historical
-
2025-11-11status Pending
-
2025-10-29$160,000 Active
ⓘ Source: listings_history table (triggers on properties + properties_extension) + one-shot
backfill from property_details.listing_events for pre-trigger history.
Tax reassessment forecast OH · Partial reset (capped growth)
- Current annual tax
- $3,720 · $310/mo
- Projected year-2 tax
- $3,720 · $310/mo
- Expected delta
- $0/yr ($0/mo · 0.0%)
ⓘ Screening estimate from a state-policy table — verify with the county assessor before closing.
Climate risk First Street
- Flood 1/10 Low FEMA zone X (unshaded) · 0% chance over 30 yrs
- Wildfire 1/10 Low
- Heat 2/10 Low 7 d/yr ≥96°F today · 16 d/yr by 30 yrs out
- Wind 1/10 Low
- Air quality 2/10 Low 1 unhealthy d/yr today · 3 by 30 yrs out
Nearby sold comps map
Loading sold comps map…
Walkable amenities ~0.75 mi
Loading nearby amenities…
Taxation est. · year 1
- Rental income
- $22,759
- − Mortgage interest
- −$7,002
- − Property taxes
- −$3,720
- − Insurance
- −$625
- − Repairs & maintenance
- −$1,821
- − Management
- −$1,821
- − Depreciation
- −$3,636
- Taxable income
- $4,135
- Est. tax owed @ 24.0%
- −$992
- After-tax cash flow
- $4,777/yr
For passive investors: Depreciation is non-cash, so a rental often shows a tax loss while cash-flowing — sheltering income. Rental losses are passive: they offset passive income freely, and up to $25,000/yr can offset ordinary (W-2) income if you actively participate and your MAGI is under $100k (phasing out to $0 by $150k); unused losses carry forward. On sale, claimed depreciation is recaptured at up to 25%, and gains may owe capital-gains tax (a 1031 exchange can defer both). Figures are a year-1 estimate at your 24.0% rate — not tax advice; consult a CPA.
Schools (NCES district)
- District
- Twinsburg City
- NCES district ID
- 3905007
- Math proficiency
- 67% ▼ -17.00%
- Reading proficiency
- 75% ▼ -8.00%
- Median HH income
- $70,356
- Composite
- 62.11/100
- National rank
- #711
- State rank
- #119 of 656 in OH
Livability — Twinsburg
- Score
- 81/100
- State rank
- #95
- US rank
- #1475
Category grades
Schools grade is shown separately in the Schools card above.
Census & demographics
- Census place
- Twinsburg, OH
- County
- Summit County · 440,783 people
- City population
- 22,185
- Metro
- Akron, OH
- Population (ZIP)
- 22,185
- Household income
- $99,270
- Rent vs Own
- Severe rent burden
- 607.0
Population outlook (Summit County) Hauer SSP2
- Today (2025)
- 546,583 people
- By 2030
- 544,028 · -0.5%
- By 2040
- 531,363 · -2.8%
- By 2050
- 514,923 · -5.8%
- By 2075
- 481,765 · -11.9%
- By 2100
- 432,265 · -20.9%
Race, ethnicity, and origin ACS 2023
- Neighborhood character
- Diverse neighborhood (Simpson 0.55)
- Race & ethnicity
- White 63% Black 20% Asian 9% Two or more races 4% Hispanic / Latino 2%
- Common ancestry
- Romanian 5% Italian 1% Lithuanian 1%
- Foreign-born
- 9% · China, Canada, Vietnam
- Languages at home
- 91% English-only · Other Indo-European 4% Russian/Polish/Slavic 1% Tagalog/Filipino 1%
Political lean MEDSL · Summit
- 2024 margin
- Lean D (+7.0) · D 53.0% · R 46.0%
- 2008→2024 swing
- -9.6pp toward R · 2008: 16.6pp · 2024: 7.0pp
- All cycles
- 2024: D+7.0 2020: D+9.6 2016: D+8.2 2012: D+14.8 2008: D+16.6
Not yet ingested
- Civics
- —
Market trends
- HPI YoY
- ▼ -175.18%
- Current HPI
- 193.7614
- Rent YoY
- —
- Metro
- Akron, OH
- State GDP YoY
- ▲ 1.98%
- F500 in state
- 48
Industry mix (Fortune 500 HQ in OH)
| Industry | F500 HQs | Revenue |
|---|---|---|
| Insurance | 3 | $145B |
|
||
| Industrial Machinery | 3 | $49B |
|
||
| Financial Services | 3 | $24B |
|
||
| Consumer Goods | 2 | $93B |
|
||
| Aerospace / Defense | 2 | $47B |
|
||
| Utilities | 2 | $33B |
|
||
Price history
-21.9% since first listed6 events — show timeline
- 2026-05-20 Pending — MLSNOW
- 2026-05-19 Listed $125,000 MLSNOW
- 2026-04-25 Relisted — MLSNOW
- 2026-04-25 Listing Removed — MLSNOW
- 2025-11-11 Pending — MLSNOW
- 2025-10-29 Listed $160,000 MLSNOW
Property tax history
+2.7%/yrLatest (2025): $3,720 · -0.9% YoY. Source: county tax records.
Cash-flow waterfall
monthlySold comps — $/sqft
last 12 mo · ≤1 miLoading sold comps…