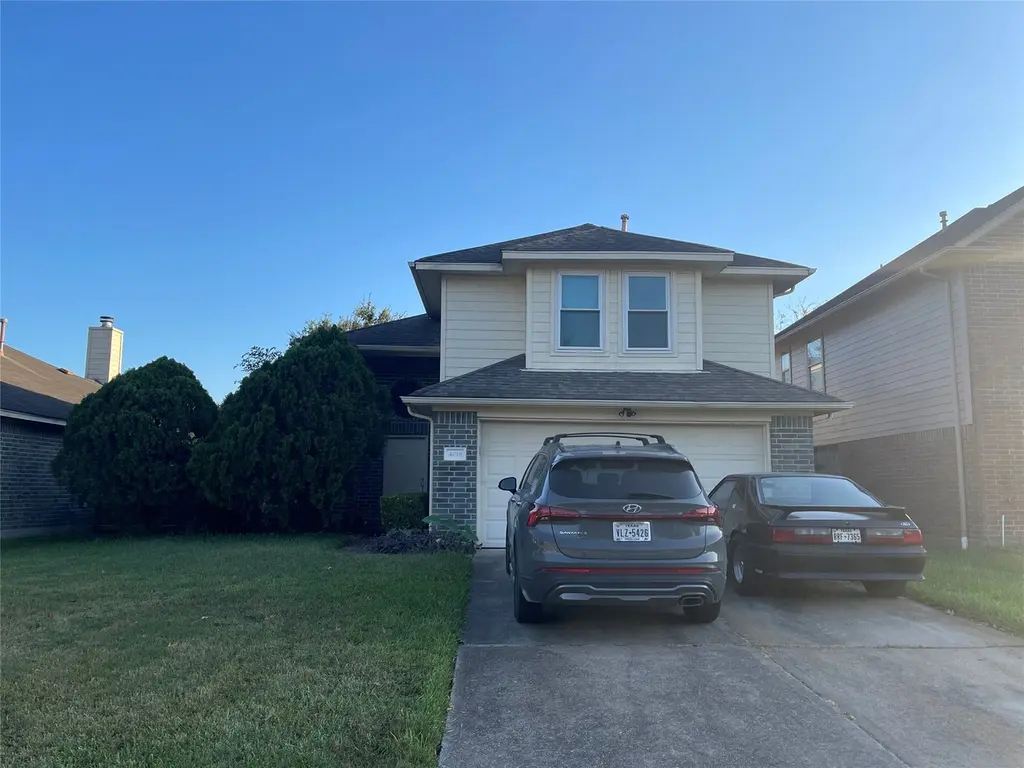
4018 Leighann Lane Dr · Houston, TX
Flood risk 6/10 · Moderate
- FEMA flood zone
- X (shaded)
- Chance of flooding over 30 yrs
- 0.68%
- Est. flood insurance / yr
- $507 – $1,088
Fire risk 3/10 · Minor
- Est. fire insurance / yr
- $1,222 – $2,270
Heat risk 9/10 · Severe
- Hot days now (above 109°F)
- 7 days/yr
- Hot days in 30 yrs
- 24 days/yr
Wind risk 9/10 · Severe
- Chance of severe wind over 30 yrs
- 99.0%
Air-quality risk 2/10 · Minimal
- Unhealthy air days now
- 2 days/yr
- Unhealthy air days in 30 yrs
- 2 days/yr
Risk factors via First Street. Map © Google.
Why this score? — see what drove the D grade
The composite is a weighted blend of 9 inputs, each scored 0–100. Each bar is that input's sub-score; the figure is the points it added to the 100-point composite (weight × sub-score).
- Cash flow +12.8/30.0
- ARV discount +12.2/15.0
- 1% rule +4.7/10.0
- DSCR +3.8/10.0
- Livability +3.7/5.0
- Schools +2.7/10.0
- Condition / age +2.5/5.0
- Rent growth +2.4/5.0
- Appreciation +0.0/10.0
$225,000
🖨 Deal sheet 📄 Offer letter ✓ Due diligence
Listing remarks MLS
Welcome to 4018 Leighann Lane — a spacious and well-designed 4-bedroom, 2.5-bath home offering comfort, functionality, and value in an established Houston community. This home features a highly desirable layout with the primary suite located on the first floor, providing privacy and convenience, while the remaining bedrooms are upstairs. The main living area offers an inviting space for both everyday living and entertaining, with a seamless flow into the kitchen and dining areas. This home also features solar panels that will be paid off at closing, allowing potential energy savings without taking on any existing solar loan or additional debt. Step outside to a spacious backyard with plenty of room to relax. Conveniently located near Beltway 8 and Highway 288, this home offers easy access to major Houston destinations. Whether you’re a first-time buyer or looking for more space at an affordable price point, this home presents a great opportunity. Schedule your private showing today
Key facts
- Spacious backyard
- Solar panels
- 6,000 sq ft lot
Tags
Neighborhood map
What this means for you Summary
Snapshot
- This is a 3-bed/2.5-bath single-family listed at $225k.
Deal economics
- At list price, monthly cash flow is $-23 ($-271/yr) — negative.
- To cash-flow at today's rent, offer at most $221k (1.8% below list).
- To meet the 1% rule (rent ≥ 1% of price), the offer needs to be $218k (3.2% below list).
- Recommended offer: $212k (6.0% below list) — sets the bar for market timing.
- Cap rate 6.2% vs local median 3.2% in Houston — top-decile yield for the area; either an underpriced asset or a hidden risk that comps aren't pricing in. Stress-test before assuming the spread holds.
Location & tenants
- Location reads 74/100 on livability (#184 in TX, #4,771 nationally) — a middle-class / working-renter tenant base. Strengths: amenities A+, cost of living A+, housing A+; Watch: schools D, crime F.
- Houston ISD (urban): math 27% / reading 35% proficiency, ranked #593 of 826 in TX (top 72%) — families likely to look elsewhere, expect single-tenant / working-renter base with shorter leases; 71% free/reduced lunch — lower-income household profile, screen leases tightly.
- Market conditions: Rents soft (-0.2%/yr); 280 active listings in the ZIP; 9 comparable units currently listed for rent nearby; rentals leasing fast (median 5d on market — plan ~1-2 weeks tenant-placement turnaround); solid renter incomes; 29,883 units permitted in Harris County in 2024 (8,621 in 5+ unit buildings).
- This rent runs 33% of the median local income ($79k/yr) — at the standard rent-burdened threshold; future hikes will face affordability resistance.
Forward outlook
- Local home prices are declining (-3.0%/yr); year-one equity from $2k of loan paydown is wiped out by about $7k of value loss. Plan a longer hold.
- Harris County population projected at +47% by 2050 — long-run rental-demand tailwind backs the buy-and-hold thesis.
Negotiation context
- It's been on market 79 days — a 6% lower offer ($212k) is reasonable based on typical stale-listing flexibility.
- 3 sale attempts since 8y ago with the ask held roughly flat each time — persistent listings suggest the price (not the market) is what's stuck; bring a comps-based counter.
Risks & watch-outs
- Climate carrying-cost: major flood risk; severe wind risk, 99% chance of damaging wind over 30y; extreme-heat days projected 7→24/yr by 2055 (HVAC capex compounding) — expect insurance premiums to compound above CPI over the hold.
Questions for the listing agent
- What do current leases actually rent for vs. the listed asking? Can we see a recent rent roll and the last 12 months of T-12 income?
- It's been on market 79 days. Have you received any prior offers? Is the seller open to a 6% concession, seller financing, or rate buy-down credit?
- What does the HOA fee cover, when was the last increase, and are there any pending special assessments or reserve-fund shortfalls?
- Why hasn't it sold? Are there any deal-killer items the seller is aware of (foundation, flood, title, zoning, code violations)?
- Is there a deadline driving the sale (1031 exchange, divorce, estate, relocation)? That informs how much negotiation room exists.
- Schools are D-rated, which usually means shorter tenancies and higher turnover. Who's the typical renter profile here, and what's been the actual vacancy rate?
- Crime grade is F in this area — have there been break-ins, vandalism, or insurance claims at this property in the last 3 years? What carrier currently insures it and at what premium?
- The area grade is low — what's the realistic commute time and amenity access for the typical tenant pool here? Any planned neighborhood developments (good or bad) we should know about?
- What's the average days-on-market for RENTAL listings here right now (not sales)? A rising rental-DOM trend means longer vacancies and softer asking-rent achievability than the comps imply.
- What's the recent tenant-quality profile in this submarket — average credit score on applications, eviction rate, late-payment / NSF rate, and stable-employment percentage? A property-management company in the area should have these aggregated.
- How much new for-sale + rental construction is in the pipeline within 1–3 miles? Heavy new supply typically softens prices + rents 12–24 months out; constrained supply supports both.
Investment metrics
- 1% rule
- 0.97% ✗
- Cap rate
- 6.17%
- Cash-on-cash
- -0.43%
- DSCR
- 0.98
- GRM
- 8.6
CMA / ARV
- ARV (median comp)
- $251,387
- List price
- $225,000
- Delta
- -10.50%
- Verdict
- UNDERPRICED
- Comps
- 20 within 1.0 mi
Show comp detail 12 sales within ~0.75 mi
| Address | Dist | Beds/Ba | Sqft | Sold | Price | $/sf | Match |
|---|---|---|---|---|---|---|---|
| 14606 Geronimo Lk | 0.12mi | 3/2.5 | 1,862 (+2%) | 2mo | $200,000 | $107 | 90 |
| 4114 Brunswick Crossing Ln | 0.37mi | 3/2.0 | 1,959 (+7%) | 5mo | $320,000 | $163 | 65 |
| 14635 County Cress Dr | 0.31mi | 4/2.5 (+1) | 1,747 (-4%) | 12mo | $265,000 | $152 | 63 |
| 3722 Flannery Ridge Ln | 0.52mi | 3/2.0 | 1,894 (+4%) | 6mo | $290,000 | $153 | 63 |
| 4147 Presidents Dr S | 0.18mi | 4/2.5 (+1) | 1,634 (-11%) | 8mo | $223,000 | $136 | 62 |
| 4214 Geronimo Lake Dr | 0.17mi | 3/2.0 | 1,629 (-11%) | 12mo | $265,000 | $163 | 61 |
| 4206 Brunswick Crossing Ln | 0.30mi | 3/2.0 | 1,692 (-7%) | 12mo | $299,500 | $177 | 61 |
| 14206 Long Meadow Dr | 0.64mi | 3/2.0 | 1,751 (-4%) | 7mo | $290,000 | $166 | 55 |
| 13935 Kenswick Key Ln | 0.72mi | 3/2.0 | 1,670 (-9%) | 3mo | $287,500 | $172 | 48 |
| 3802 Glover Meadows Ln | 0.67mi | 4/2.0 (+1) | 1,898 (+4%) | 12mo | $294,990 | $155 | 46 |
| 13915 Littleborne Birdwell Ln | 0.67mi | 3/2.5 | 2,050 (+12%) | 7mo | $265,000 | $129 | 43 |
| 3739 Glover Meadows Ln | 0.70mi | 3/2.0 | 1,676 (-8%) | 11mo | $280,000 | $167 | 43 |
Match score weights: distance 35% · size 25% · config 20% · recency 20%. Top-matched comps best support the ARV.
Projected returns pro-forma
-3.0% appreciation · 0.0% rent growth · sell at horizon
- IRR
- -20.8%
- Equity multiple
- 0.30×
- Total profit
- $-44,132
- Equity at exit
- $33,548
- IRR
- -24.4%
- Equity multiple
- -0.02×
- Total profit
- $-64,338
- Equity at exit
- $19,454
Cash invested: $63,000 (down + closing). Projections, not guarantees.
Landlord ↔ Tenant lean methodology
- Overall (STATE)
- 87 Strongly Landlord-Friendly
- State Texas
- 87 Strongly Landlord-Friendly · R+5
- County
- — inherits STATE
- City
- — inherits STATE
ZIP-level market 77047
- Home prices YoY
- -10.1%
- Rents YoY
- -0.2%
- Active inventory
- 280
- Price-to-rent
- 8.6×
Monthly cashflow live
- Estimated rent
- $2,177 high interval (Pro) →
- Mortgage (P&I)
- −$1,180
- Tax from tax record
- −$436 /mo · $5,230/yr
- Insurance
- −$94
- HOA
- −$33
- Vacancy / Maint / Mgmt
- −$457
- Net cashflow
- $-23
Break-even live
UW: 25.0% down · 7.5% · 30yr · 1.5% tax · 5.0% vac · 8.0% maint · 8.0% mgmt
Financing live
Cash to close
- Down payment
- $56,250
- Closing costs
- $6,750
- Reserves months
- —
- Total cash needed
- —
Loan-product check · same deal, 3 products live
Conventional
25% down · 7.5% · 30yr
- Down + closing
- —
- Monthly P&I
- —
- Monthly cashflow
- —
- DSCR
- —
- Eligible?
- —
Personal DTI + credit; lowest rate.
DSCR
20% down · 8.5% · 30yr
- Down + closing
- —
- Monthly P&I
- —
- Monthly cashflow
- —
- DSCR
- —
- Eligible?
- —
No personal income docs; deal must DSCR.
Hard money
10% down · 12.0% · 12mo
- Down + closing
- —
- Monthly P&I
- —
- Monthly cashflow
- —
- DSCR
- —
- Eligible?
- —
Short-term bridge; refi at stabilization.
Rent comps 9 comps
| Address | Beds | Baths | Sqft | Rent | $/sqft | DOM | Units | Dist |
|---|---|---|---|---|---|---|---|---|
| 4023 Almond Lake Dr Houston, TX | 3.0 | 2.0 | 1414 | $1,980 | $1.40 | 43d | 1 | 0.21mi |
| 4111 Oakview Creek Ln Houston, TX | 4.0 | 2.5 | 1885 | $2,150 | $1.14 | 43d | 1 | 0.63mi |
| 3403 Orchid Trace Ln Houston, TX | 3.0 | 2.5 | 1602 | $1,920 | $1.20 | 2d | 1 | 0.79mi |
| 1555 Cullen Blvd Unit 1592 Pearland, TX | 2.0 | 2.0 | 1309 | $2,053 | $1.57 | 2d | 1 | 1.03mi |
| 1555 Cullen Blvd Unit 421 Pearland, TX | 2.0 | 2.0 | 1309 | $2,061 | $1.57 | 5d | 1 | 1.03mi |
| 13958 Cottingham St Houston, TX | 1.0–2.0 | 1.0–2.0 | 1048 | $1,825 | $1.74 | 2d | 35 | 1.15mi |
| 3110 Kainer Meadows Ln Houston, TX | 3.0 | 2.0 | 1469 | $1,900 | $1.29 | 7d | 1 | 1.31mi |
| 3918 Almeda-Genoa Rd Houston, TX | 1.0–3.0 | 1.0–2.0 | 1038 | $2,220 | $2.14 | 1d | 26 | 1.31mi |
| 13802 Greyfield Ln Houston, TX | 4.0 | 2.5 | 2350 | $2,500 | $1.06 | 18d | 1 | 1.48mi |
HOA detail
- Monthly dues
- $33 · $396/yr
Listing history 21 events
-
2026-06-18days on market $225,000 Active 79 DOM
-
2026-06-17days on market $225,000 Active 78 DOM
-
2026-06-16days on market $225,000 Active 77 DOM
-
2026-06-15days on market $225,000 Active 76 DOM
-
2026-06-13days on market $225,000 Active 74 DOM
-
2026-06-10days on market $225,000 Active 70 DOM
-
2026-06-08days on market $225,000 Active 69 DOM
-
2026-06-07days on market $225,000 Active 68 DOM
-
2026-06-04days on market $225,000 Active 65 DOM
-
2026-06-01days on market $225,000 Active 62 DOM
-
2026-05-31days on market $225,000 Active 61 DOM
-
2026-03-31$235,000 Active 1011-char remark
Show marketing remark (1011 chars)
Welcome to 4018 Leighann Lane — a spacious and well-designed 4-bedroom, 2.5-bath home offering comfort, functionality, and value in an established Houston community. This home features a highly desirable layout with the primary suite located on the first floor, providing privacy and convenience, while the remaining bedrooms are upstairs. The main living area offers an inviting space for both everyday living and entertaining, with a seamless flow into the kitchen and dining areas. This home also features solar panels that will be paid off at closing, allowing potential energy savings without taking on any existing solar loan or additional debt. Step outside to a spacious backyard with plenty of room to relax. Conveniently located near Beltway 8 and Highway 288, this home offers easy access to major Houston destinations. Whether you’re a first-time buyer or looking for more space at an affordable price point, this home presents a great opportunity. Schedule your private showing today
-
2025-04-16historical
-
2025-03-23price $225,000
-
2024-10-20$245,000 Active
-
2018-07-16soldstatus
-
2018-07-11soldstatus Sold
-
2018-06-17status Pending
-
2018-06-08status Option Pending
-
2018-06-04$158,000 Active
-
2006-06-09soldstatus
ⓘ Source: listings_history table (triggers on properties + properties_extension) + one-shot
backfill from property_details.listing_events for pre-trigger history.
Tax reassessment forecast TX · Resets to sale price
- Current annual tax
- $5,230 · $436/mo
- Projected year-2 tax
- $5,230 · $436/mo
- Expected delta
- $0/yr ($0/mo · 0.0%)
ⓘ Screening estimate from a state-policy table — verify with the county assessor before closing.
Climate risk First Street
- Flood 6/10 Major FEMA zone X (shaded) · 68% chance over 30 yrs
- Wildfire 3/10 Moderate
- Heat 9/10 Extreme 7 d/yr ≥109°F today · 24 d/yr by 30 yrs out
- Wind 9/10 Extreme 99% chance of damaging wind over 30 yrs
- Air quality 2/10 Low 2 unhealthy d/yr today · 2 by 30 yrs out
Nearby sold comps map
Loading sold comps map…
Walkable amenities ~0.75 mi
Loading nearby amenities…
Taxation est. · year 1
- Rental income
- $26,125
- − Mortgage interest
- −$12,603
- − Property taxes
- −$5,230
- − Insurance
- −$1,125
- − Repairs & maintenance
- −$2,090
- − Management
- −$2,090
- − HOA
- −$396
- − Depreciation
- −$6,545
- Taxable loss
- −$3,955
- Est. tax savings @ 24.0%
- +$949
- After-tax cash flow
- $678/yr
For passive investors: Depreciation is non-cash, so a rental often shows a tax loss while cash-flowing — sheltering income. Rental losses are passive: they offset passive income freely, and up to $25,000/yr can offset ordinary (W-2) income if you actively participate and your MAGI is under $100k (phasing out to $0 by $150k); unused losses carry forward. On sale, claimed depreciation is recaptured at up to 25%, and gains may owe capital-gains tax (a 1031 exchange can defer both). Figures are a year-1 estimate at your 24.0% rate — not tax advice; consult a CPA.
Schools (NCES district)
- District
- Houston ISD
- NCES district ID
- 4823640
- Math proficiency
- 27% ▼ -18.00%
- Reading proficiency
- 35% ▼ -6.00%
- Median HH income
- $46,054
- Composite
- 26.63/100
- National rank
- #7173
- State rank
- #593 of 826 in TX
Livability — Houston
- Score
- 74/100
- State rank
- #184
- US rank
- #4771
Category grades
Schools grade is shown separately in the Schools card above.
Census & demographics
- County
- Harris County · 4,702,590 people
- City population
- 3,226,434
- Metro
- Houston-The Woodlands-Sugar Land, TX
- Population (ZIP)
- 34,987
- Household income
- $78,538
- Rent vs Own
- Severe rent burden
- 1109.0
Population outlook (Harris County) Hauer SSP2
- Today (2025)
- 5,571,493 people
- By 2030
- 6,089,821 · +9.3%
- By 2040
- 7,142,806 · +28.2%
- By 2050
- 8,185,864 · +46.9%
- By 2075
- 10,574,329 · +89.8%
- By 2100
- 12,109,958 · +117.4%
Race, ethnicity, and origin ACS 2023
- Neighborhood character
- Diverse neighborhood (Simpson 0.58)
- Race & ethnicity
- Black 57% Hispanic / Latino 29% Two or more races 15% White 6% Asian 3% Pacific Islander 1%
- Hispanic origin (detail)
- Mexican 24% Puerto Rican 1%
- Common ancestry
- Lithuanian 1%
- Foreign-born
- 15% · Canada, Vietnam
- Languages at home
- 70% English-only · Spanish 23% Vietnamese 1% Other Indo-European 1%
Political lean MEDSL · Harris
- 2024 margin
- Lean D (+5.5) · D 52.0% · R 46.4% · Other 1.6%
- 2008→2024 swing
- +3.9pp toward D · 2008: 1.6pp · 2024: 5.5pp
- All cycles
- 2024: D+5.5 2020: D+13.3 2016: D+12.4 2012: D+0.1 2008: D+1.6
Not yet ingested
- Civics
- —
Market trends
- HPI YoY
- ▼ -26.76%
- Current HPI
- 239.2287
- Rent YoY
- ▼ -0.21%
- Metro
- Houston-The Woodlands-Sugar Land, TX
- State GDP YoY
- ▲ 3.95%
- F500 in state
- 110
Industry mix (Fortune 500 HQ in TX)
| Industry | F500 HQs | Revenue |
|---|---|---|
| Energy | 16 | $1,198B |
|
||
| Technology | 5 | $198B |
|
||
| Engineering / Construction | 4 | $72B |
|
||
| Energy Services | 3 | $60B |
|
||
| Utilities | 3 | $41B |
|
||
| Healthcare | 2 | $330B |
|
||
Price history
+48.7% since first listed10 events — show timeline
- 2026-03-31 Listed $235,000 HARMLS
- 2025-04-16 Listing Removed — HARMLS
- 2025-03-23 Price Changed $225,000 HARMLS
- 2024-10-20 Listed $245,000 HARMLS
- 2018-07-16 Sold (Public Records) — Public Records
- 2018-07-11 Sold (MLS) — HARMLS
- 2018-06-17 Pending — HARMLS
- 2018-06-08 Pending — HARMLS
- 2018-06-04 Listed $158,000 HARMLS
- 2006-06-09 Sold (Public Records) — Public Records
Property tax history
+11.3%/yrLatest (2025): $5,230 · +0.6% YoY. Source: county tax records.
Cash-flow waterfall
monthlySold comps — $/sqft
last 12 mo · ≤1 miLoading sold comps…