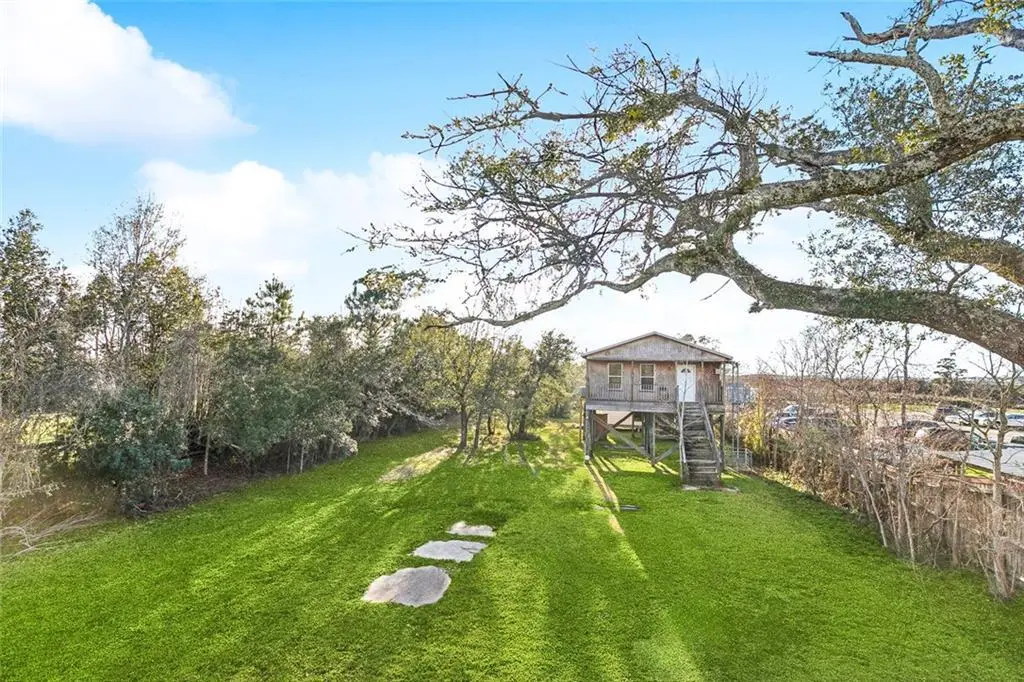
55259`` Hwy 433 · Slidell, LA
Flood risk 10/10 · Severe
- FEMA flood zone
- AE
- Chance of flooding over 30 yrs
- 0.99%
- Est. flood insurance / yr
- $1,737 – $8,500
Fire risk 3/10 · Minor
- Est. fire insurance / yr
- $1,269 – $2,357
Heat risk 10/10 · Severe
- Hot days now (above 108°F)
- 7 days/yr
- Hot days in 30 yrs
- 21 days/yr
Wind risk 10/10 · Severe
- Chance of severe wind over 30 yrs
- 99.0%
Air-quality risk 1/10 · Minimal
- Unhealthy air days now
- 0 days/yr
- Unhealthy air days in 30 yrs
- 0 days/yr
Risk factors via First Street. Map © Google.
Why this score? — see what drove the B+ grade
The composite is a weighted blend of 9 inputs, each scored 0–100. Each bar is that input's sub-score; the figure is the points it added to the 100-point composite (weight × sub-score).
- Cash flow +30.0/30.0
- ARV discount +15.0/15.0
- 1% rule +10.0/10.0
- DSCR +10.0/10.0
- Schools +4.3/10.0
- Livability +3.5/5.0
- Rent growth +2.9/5.0
- Condition / age +2.5/5.0
- Appreciation +0.0/10.0
$85,000
🖨 Deal sheet (PDF) 📄 Offer letter ✓ Due diligence
Listing remarks MLS
Investor or handyman special! With a little cosmetic TLC, this 2 bedroom, 1 bath home will be ready for all the possibilities! Situated on a deep, quiet lot with nothing but serene marshland behind it! Home has a treatment plant, a well, an elevator, washer/dryer hookups. Large shed in included and would be a great workshop.
Key facts
- Deep quiet lot
- Large shed
- Serene marshland
Tags
Neighborhood map
What this means for you Summary
Snapshot
- This is a 2-bed/1.0-bath single-family listed at $85k.
Deal economics
- At list price, monthly cash flow is $110 ($1k/yr) — positive.
- The deal already cash-flows at list — no discount required.
- Meets the 1% rule at list price ($1k rent vs $85k).
- Recommended offer: $75k (12.0% below list) — sets the bar for market timing.
- Cap rate 13.9% vs local median 5.9% in Slidell — top-decile yield for the area; either an underpriced asset or a hidden risk that comps aren't pricing in. Stress-test before assuming the spread holds.
Location & tenants
- Location reads 70/100 on livability (#57 in LA) — a middle-class / working-renter tenant base. Strengths: cost of living A+, housing A+, health & safety A+; Watch: amenities F, commute F.
- St. Tammany Parish (suburban): math 43% / reading 55% proficiency, ranked #11 of 98 in LA (top 11%) — families likely to look elsewhere, expect single-tenant / working-renter base with shorter leases.
- Zoned schools: W.L. Abney Elementary School (math 31% / reading 38%, grade F, #284 of 646 statewide, top 46%, 1,094 students, 70% FRL); St. Tammany Junior High School (math 19% / reading 41%, grade F, #114 of 218 statewide, top 53%, 793 students, 68% FRL); Salmen High School (math 15% / reading 27%, grade F, #179 of 265 statewide, top 68%, 1,216 students, 62% FRL) — zoned schools average 67% FRL vs 40% district-wide (27 pts higher); higher-poverty schools than district average — tighter screening recommended.
- Zoned-school proficiency averages 28% at this address vs 49% district-wide (-20 pts) — the specific schools serving this property underperform the St. Tammany Parish average; the district grade overstates school quality for this exact location.
- Market conditions: Rents rising (+1.7%/yr); 594 active listings in the ZIP; 1 comparable units currently listed for rent nearby; solid renter incomes; 1,064 units permitted in St. Tammany Parish in 2024 (0 in 5+ unit buildings).
Forward outlook
- Local home prices are declining (-3.0%/yr); year-one equity from $588 of loan paydown is wiped out by about $3k of value loss. Plan a longer hold.
- St. Tammany County population projected at +27% by 2050 — long-run rental-demand tailwind backs the buy-and-hold thesis.
Negotiation context
- It's been on market 159 days — a 12% lower offer ($75k) is reasonable based on typical stale-listing flexibility.
- 2 sale attempts with the ask held roughly flat each time — persistent listings suggest the price (not the market) is what's stuck; bring a comps-based counter.
- Current owner paid $70k; 21% above their basis — modest negotiation headroom, anchor on the comps not their cost.
Risks & watch-outs
- Watch-outs: flood insurance adds $427/mo.
- Climate carrying-cost: in FEMA flood zone AE (mandatory federal flood insurance); severe wind risk, 99% chance of damaging wind over 30y; extreme-heat days projected 7→21/yr by 2055 (HVAC capex compounding) — expect insurance premiums to compound above CPI over the hold.
Questions for the listing agent
- It's been on market 159 days. Have you received any prior offers? Is the seller open to a 12% concession, seller financing, or rate buy-down credit?
- What's the actual annual flood-insurance premium (NFIP or private), and is the property in a SFHA with mandatory coverage?
- Why hasn't it sold? Are there any deal-killer items the seller is aware of (foundation, flood, title, zoning, code violations)?
- Is there a deadline driving the sale (1031 exchange, divorce, estate, relocation)? That informs how much negotiation room exists.
- Schools are B-rated — typically a magnet for longer-tenancy family renters. What's the average tenant stay here, and is there a school-zone premium baked into asking?
- What's the average days-on-market for RENTAL listings here right now (not sales)? A rising rental-DOM trend means longer vacancies and softer asking-rent achievability than the comps imply.
- What's the recent tenant-quality profile in this submarket — average credit score on applications, eviction rate, late-payment / NSF rate, and stable-employment percentage? A property-management company in the area should have these aggregated.
- How much new for-sale + rental construction is in the pipeline within 1–3 miles? Heavy new supply typically softens prices + rents 12–24 months out; constrained supply supports both.
Investment metrics
- 1% rule
- 1.66% ✓
- Cap rate
- 13.87%
- Cash-on-cash
- 27.06%
- DSCR
- 2.20
- GRM
- 5.0
CMA / ARV
- ARV (on-the-fly)
- $165,480
- Comps found
- 4
Show comp detail 4 sales within ~0.75 mi
| Address | Dist | Beds/Ba | Sqft | Sold | Price | $/sf | Match |
|---|---|---|---|---|---|---|---|
| 3827 Seagull Cir | 0.46mi | 2/1.0 | 899 (+7%) | 9mo | $176,280 | $196 | 60 |
| 3874 Seagull Cir | 0.52mi | 2/1.0 | 899 (+7%) | 14mo | $177,525 | $197 | 52 |
| 3885 Seagull Cir | 0.55mi | 2/1.0 | 899 (+7%) | 15mo | $175,000 | $195 | 50 |
| 3842 Seagull Cir | 0.47mi | 2/1.0 | 899 (+7%) | 20mo | $189,900 | $211 | 50 |
Match score weights: distance 35% · size 25% · config 20% · recency 20%. Top-matched comps best support the ARV.
Projected returns pro-forma
-3.0% appreciation · 1.72% rent growth · sell at horizon
- IRR
- -9.7%
- Equity multiple
- 0.65×
- Total profit
- $-8,275
- Equity at exit
- $12,674
- IRR
- -2.9%
- Equity multiple
- 0.82×
- Total profit
- $-4,213
- Equity at exit
- $7,349
Cash invested: $23,800 (down + closing). Projections, not guarantees.
Landlord ↔ Tenant lean methodology
- Overall (STATE)
- 90 Strongly Landlord-Friendly
- State Louisiana
- 90 Strongly Landlord-Friendly · R+12
- County
- — inherits STATE
- City
- — inherits STATE
ZIP-level market 70461
- Home prices YoY
- -33.0%
- Rents YoY
- 1.7%
- Active inventory
- 594
- Price-to-rent
- 5.0×
Monthly cashflow live
- Estimated rent
- $1,407 medium interval (Pro) →
- Mortgage (P&I)
- −$446
- Tax from tax record
- −$94 /mo · $1,126/yr
- Insurance
- −$35
- Flood insurance flood zone
- −$427 /mo · $5,118/yr
- HOA
- −$0
- Vacancy / Maint / Mgmt
- −$295
- Net cashflow
- $110
Break-even live
Sensitivity live
| Price | -10% $158 | -5% $134 | +0% $110 | +5% $86 | +10% $62 |
|---|---|---|---|---|---|
| Rent | -10% $-1 | -5% $55 | +0% $110 | +5% $166 | +10% $221 |
| Rate | -1.0pp $153 | -0.5pp $132 | base $110 | +0.5pp $88 | +1.0pp $66 |
UW: 25.0% down · 7.5% · 30yr · 1.5% tax · 5.0% vac · 8.0% maint · 8.0% mgmt
Financing live
Cash to close
- Down payment
- $21,250
- Closing costs
- $2,550
- Reserves months
- —
- Total cash needed
- —
Loan-product check · same deal, 3 products live
Conventional
25% down · 7.5% · 30yr
- Down + closing
- —
- Monthly P&I
- —
- Monthly cashflow
- —
- DSCR
- —
- Eligible?
- —
Personal DTI + credit; lowest rate.
DSCR
20% down · 8.5% · 30yr
- Down + closing
- —
- Monthly P&I
- —
- Monthly cashflow
- —
- DSCR
- —
- Eligible?
- —
No personal income docs; deal must DSCR.
Hard money
10% down · 12.0% · 12mo
- Down + closing
- —
- Monthly P&I
- —
- Monthly cashflow
- —
- DSCR
- —
- Eligible?
- —
Short-term bridge; refi at stabilization.
Rent comps 1 comps
| Address | Beds | Baths | Sqft | Rent | $/sqft | DOM | Units | Dist |
|---|---|---|---|---|---|---|---|---|
| 200 Long St Slidell, LA | 2.0–4.0 | 2.0 | 1112 | $1,207 | $1.08 | 3d | 1 | 0.46mi |
Listing history 17 events
-
2026-06-21days on market $85,000 Active 159 DOM
-
2026-06-18days on market $85,000 Active 156 DOM
-
2026-06-17days on market $85,000 Active 155 DOM
-
2026-06-16days on market $85,000 Active 154 DOM
-
2026-06-15days on market $85,000 Active 153 DOM
-
2026-06-13days on market $85,000 Active 151 DOM
-
2026-06-10days on market $85,000 Active 148 DOM
-
2026-06-09days on market $85,000 Active 147 DOM
-
2026-06-08days on market $85,000 Active 146 DOM
-
2026-06-07days on market $85,000 Active 145 DOM
-
2026-06-03days on market $85,000 Active 141 DOM
-
2026-06-02days on market $85,000 Active 140 DOM
-
2026-06-01days on market $85,000 Active 139 DOM
-
2026-05-31days on market $85,000 Active 138 DOM
-
2026-01-13$85,000 Active 329-char remark
Show marketing remark (326 chars)
Investor or handyman special! With a little cosmetic TLC, this 2 bedroom, 1 bath home will be ready for all the possibilities! Situated on a deep, quiet lot with nothing but serene marshland behind it! Home has a treatment plant, a well, an elevator, washer/dryer hookups. Large shed in included and would be a great workshop.
-
2026-01-13$85,000 Active 326-char remark
Show marketing remark (326 chars)
Investor or handyman special! With a little cosmetic TLC, this 2 bedroom, 1 bath home will be ready for all the possibilities! Situated on a deep, quiet lot with nothing but serene marshland behind it! Home has a treatment plant, a well, an elevator, washer/dryer hookups. Large shed in included and would be a great workshop.
-
2019-02-15soldstatus $70,000
ⓘ Source: listings_history table (triggers on properties + properties_extension) + one-shot
backfill from property_details.listing_events for pre-trigger history.
Tax reassessment forecast LA · Resets to sale price
- Current annual tax
- $1,126 · $94/mo
- Projected year-2 tax
- $1,126 · $94/mo
- Expected delta
- $0/yr ($0/mo · 0.0%)
ⓘ Screening estimate from a state-policy table — verify with the county assessor before closing.
Climate risk First Street
- Flood 10/10 Extreme FEMA zone AE · 99% chance over 30 yrs
- Wildfire 3/10 Moderate
- Heat 10/10 Extreme 7 d/yr ≥108°F today · 21 d/yr by 30 yrs out
- Wind 10/10 Extreme 99% chance of damaging wind over 30 yrs
- Air quality 1/10 Low 0 unhealthy d/yr today · 0 by 30 yrs out
Nearby sold comps map
Loading sold comps map…
Walkable amenities ~0.75 mi
Loading nearby amenities…
Taxation est. · year 1
- Rental income
- $16,886
- − Mortgage interest
- −$4,761
- − Property taxes
- −$1,126
- − Insurance
- −$5,544
- − Repairs & maintenance
- −$1,351
- − Management
- −$1,351
- − Depreciation
- −$2,473
- Taxable income
- $280
- Est. tax owed @ 24.0%
- −$67
- After-tax cash flow
- $1,254/yr
For passive investors: Depreciation is non-cash, so a rental often shows a tax loss while cash-flowing — sheltering income. Rental losses are passive: they offset passive income freely, and up to $25,000/yr can offset ordinary (W-2) income if you actively participate and your MAGI is under $100k (phasing out to $0 by $150k); unused losses carry forward. On sale, claimed depreciation is recaptured at up to 25%, and gains may owe capital-gains tax (a 1031 exchange can defer both). Figures are a year-1 estimate at your 24.0% rate — not tax advice; consult a CPA.
Schools (NCES district)
- District
- St. Tammany Parish
- NCES district ID
- 2201650
- Math proficiency
- 43% ▼ -32.00%
- Reading proficiency
- 55% ▼ -26.00%
- Median HH income
- $61,752
- Composite
- 43.04/100
- National rank
- #3098
- State rank
- #11 of 98 in LA
Livability — Slidell
- Score
- 70/100
- State rank
- #57
- US rank
- #7673
Category grades
Schools grade is shown separately in the Schools card above.
Census & demographics
- County
- Saint Tammany Parish · 228,296 people
- City population
- 95,511
- Metro
- New Orleans-Metairie, LA
- Population (ZIP)
- 34,808
- Household income
- $89,003
- Rent vs Own
- Severe rent burden
- 328.0
Population outlook (St. Tammany County) Hauer SSP2
- Today (2025)
- 286,725 people
- By 2030
- 304,175 · +6.1%
- By 2040
- 336,203 · +17.3%
- By 2050
- 364,590 · +27.2%
- By 2075
- 433,362 · +51.1%
- By 2100
- 470,333 · +64.0%
Race, ethnicity, and origin ACS 2023
- Neighborhood character
- Diverse neighborhood (Simpson 0.63)
- Race & ethnicity
- White 55% Black 24% Two or more races 14% Hispanic / Latino 11% Asian 3%
- Hispanic origin (detail)
- Common ancestry
- Lithuanian 9% Italian 1% Romanian 1%
- Foreign-born
- 8% · Canada, China, Vietnam
- Languages at home
- 89% English-only · Spanish 7% Chinese 1% Vietnamese 1%
Political lean MEDSL · St. Tammany
- 2024 margin
- Solid R (+43.8) · D 27.3% · R 71.1% · Other 1.6%
- 2008→2024 swing
- +9.6pp toward D · 2008: -53.4pp · 2024: -43.8pp
- All cycles
- 2024: R+43.8 2020: R+44.2 2016: R+50.8 2012: R+52.2 2008: R+53.4
Not yet ingested
- Civics
- —
Market trends
- HPI YoY
- ▼ -74.47%
- Current HPI
- 151.3353
- Rent YoY
- ▲ 1.72%
- Metro
- New Orleans-Metairie, LA
- State GDP YoY
- ▲ 3.29%
- F500 in state
- 10
Industry mix (Fortune 500 HQ in LA)
| Industry | F500 HQs | Revenue |
|---|---|---|
| Telecommunications | 2 | $23B |
|
||
| Utilities | 1 | $12B |
|
||
| Wholesale / Distribution | 1 | $5B |
|
||
| Advertising | 1 | $2B |
|
||
Price history
+21.4% since first listed3 events — show timeline
- 2026-01-13 Listed $85,000 AcadianaMLS
- 2026-01-13 Listed $85,000 GSREIN
- 2019-02-15 Sold (Public Records) $70,000 Public Records
Property tax history
+0.9%/yrLatest (2025): $1,126 · -3.8% YoY. Source: county tax records.
Cash-flow waterfall
monthlySold comps — $/sqft
last 12 mo · ≤1 miLoading sold comps…