 Multi-family
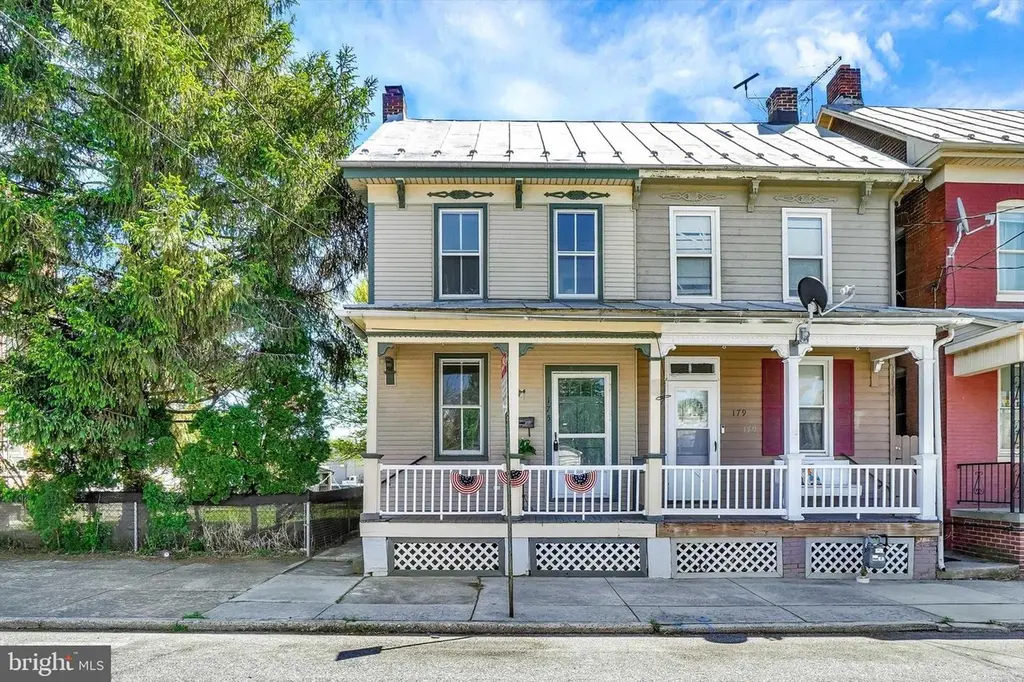
175 S East St · Spring Grove, PA
Flood risk 1/10 · Minimal
- FEMA flood zone
- X (unshaded)
- Chance of flooding over 30 yrs
- 0.0%
- Est. flood insurance / yr
- $473 – $860
Fire risk 1/10 · Minimal
- Est. fire insurance / yr
- $511 – $949
Heat risk 6/10 · Moderate
- Hot days now (above 103°F)
- 7 days/yr
- Hot days in 30 yrs
- 16 days/yr
Wind risk 4/10 · Minor
- Chance of severe wind over 30 yrs
- 11.0%
Air-quality risk 3/10 · Minor
- Unhealthy air days now
- 2 days/yr
- Unhealthy air days in 30 yrs
- 4 days/yr
Risk factors via First Street. Map © Google.
Why this score? — see what drove the B- grade
The composite is a weighted blend of 9 inputs, each scored 0–100. Each bar is that input's sub-score; the figure is the points it added to the 100-point composite (weight × sub-score).
- Cash flow +30.0/30.0
- 1% rule +10.0/10.0
- DSCR +10.0/10.0
- Schools +4.8/10.0
- Livability +3.9/5.0
- ARV discount +3.8/15.0
- Rent growth +2.5/5.0
- Condition / age +2.5/5.0
- Appreciation +0.5/10.0
$179,900
🖨 Deal sheet 📄 Offer letter ✓ Due diligence
Multi-family units
County records classify this as Multi-Family (2-4 Unit). Listing-text estimate: 1 unit. estimate disagrees with records
Listing remarks MLS
This semi-detached home is located in the boro of Spring Grove and would be cheaper than renting. Nice fenced back yard with private balcony and back porch. The property also has off street parking.
Key facts
- Covered front porch
- Fenced yard
- Updated lvp floors
Tags
Property features AI
Finance
- Other: Not in a federal flood zone; Finished above-grade area (estimated); Below-grade unfinished area (estimated)
Exterior
- Parking: Off-street parking
- Utilities: Public water; Public sewer; Electric service
- Home design: Semi-detached; Two-story (multiple upper levels implied); Fee simple ownership
- Construction: Vinyl siding; Metal and rubber roof; Permanent foundation; Built (year source: Assessor)
- Exterior features: Sidewalks; Outside basement entrance
Interior
- Kitchen: Electric oven/range; Refrigerator
- Bedrooms: Two bedrooms on the first upper level; One bedroom on the second upper level
- Flooring: Hardwood; Luxury vinyl plank; Vinyl; Laminate plank
- Bathrooms: Two full bathrooms (both on upper levels); One half bathroom on the main level
- Heating & cooling: Hot water heating; Oil-fired heating; Electric hot water
- Interior features: Ceiling fans; Combination dining and living area; Eat-in kitchen; Master bathroom; Tub with shower; Wood floors
- Laundry & utility: Sump pump
Neighborhood map
What this means for you Summary
Snapshot
- This is a 3-bed/1.5-bath multifamily listed at $180k.
Deal economics
- At list price, monthly cash flow is $2k ($23k/yr) — positive.
- The deal already cash-flows at list — no discount required.
- Meets the 1% rule at list price ($4k rent vs $180k).
- Cap rate 19.3% vs local median 3.2% in Spring Grove — top-decile yield for the area; either an underpriced asset or a hidden risk that comps aren't pricing in. Stress-test before assuming the spread holds.
Location & tenants
- Location reads 77/100 on livability (#325 in PA, #3,000 nationally) — a middle-class / working-renter tenant base. Strengths: crime A+, housing A+, health & safety A+; Watch: amenities F, commute F.
- Spring Grove Area SD (suburban): math 45% / reading 65% proficiency, ranked #98 of 539 in PA (top 18%) — acceptable for families but not a draw, mixed tenant base, ~2y average lease.
- Zoned schools: Spring Grove Area Hs (math 71%, 1,166 students, 32% FRL).
- Market conditions: 71 active listings in the ZIP; 5 comparable units currently listed for rent nearby; rentals leasing fast (median 14d on market — plan ~1-2 weeks tenant-placement turnaround); solid renter incomes; 1,328 units permitted in York County in 2024 (338 in 5+ unit buildings).
- At $4,010/mo this rent would consume 49% of the median local household income ($99k/yr) (locally 98% of renters already pay >50% of income on rent) — very limited rent-growth headroom before tenants either downsize or default.
Forward outlook
- Local home prices are declining (-3.0%/yr); year-one equity from $1k of loan paydown is wiped out by about $5k of value loss. Plan a longer hold.
- At projected returns (-3.0% appreciation + 3.0% rent growth), your $50k cash investment doubles in ~3 years — after that, you're playing with house money.
Negotiation context
- Only 5 days on market — expect competitive offers; lowballing is unlikely to land.
- 6 sale attempts since 11y ago with the ask held roughly flat each time — persistent listings suggest the price (not the market) is what's stuck; bring a comps-based counter.
- Current owner paid $60k; list at $180k implies a 200% gain — meaningful room to come down on a strong offer.
Risks & watch-outs
- Watch-outs: built in 1920 — expect roof / HVAC / electrical / plumbing capex.
- Climate carrying-cost: extreme-heat days projected 7→16/yr by 2055 (HVAC capex compounding) — expect insurance premiums to compound above CPI over the hold.
Questions for the listing agent
- Built in 1920 — when were the roof, HVAC, electrical panel, plumbing, and water heater last replaced?
- Is there a deadline driving the sale (1031 exchange, divorce, estate, relocation)? That informs how much negotiation room exists.
- Schools are A-rated — typically a magnet for longer-tenancy family renters. What's the average tenant stay here, and is there a school-zone premium baked into asking?
- What's the average days-on-market for RENTAL listings here right now (not sales)? A rising rental-DOM trend means longer vacancies and softer asking-rent achievability than the comps imply.
- What's the recent tenant-quality profile in this submarket — average credit score on applications, eviction rate, late-payment / NSF rate, and stable-employment percentage? A property-management company in the area should have these aggregated.
- How much new apartment / multifamily construction is in the pipeline within 1–3 miles? Heavy new supply (>2% of stock underway) typically softens rents 12–24 months out; light construction supports rent growth.
Investment metrics
- 1% rule
- 2.23% ✓
- Cap rate
- 19.31%
- Cash-on-cash
- 46.48%
- DSCR
- 3.07
- GRM
- 3.7
CMA / ARV
- ARV (median comp)
- $166,264
- List price
- $179,900
- Delta
- 8.20%
- Verdict
- FAIR
- Comps
- 20 within 1.0 mi
Projected returns pro-forma
-3.0% appreciation · 3.0% rent growth · sell at horizon
- IRR
- 43.8%
- Equity multiple
- 2.89×
- Total profit
- $95,160
- Equity at exit
- $26,824
- IRR
- 49.8%
- Equity multiple
- 5.83×
- Total profit
- $243,057
- Equity at exit
- $15,554
Cash invested: $50,372 (down + closing). Projections, not guarantees.
Landlord ↔ Tenant lean methodology
- Overall (STATE)
- 62 Landlord-Friendly
- State Pennsylvania
- 62 Landlord-Friendly · EVEN
- County
- — inherits STATE
- City
- — inherits STATE
ZIP-level market 17362
- Home prices YoY
- -3.4%
- Active inventory
- 71
- Price-to-rent
- 11.2×
Monthly cashflow live
- Estimated rent
- $4,010 medium interval (Pro) →
- Mortgage (P&I)
- −$943
- Tax from tax record
- −$198 /mo · $2,381/yr
- Insurance
- −$75
- HOA
- −$0
- Vacancy / Maint / Mgmt
- −$842
- Net cashflow
- $1,951
Break-even live
3-unit breakdown (identical units grouped — click to expand)
| Units | Beds | Baths | Est. rent |
|---|---|---|---|
| 3× units | 3 | 2.5 | $4,011 |
| #1 | 3 | 2.5 | $1,337 |
| #2 | 3 | 2.5 | $1,337 |
| #3 | 3 | 2.5 | $1,337 |
| Total (3 units) | $4,010 | ||
UW: 25.0% down · 7.5% · 30yr · 1.5% tax · 5.0% vac · 8.0% maint · 8.0% mgmt
Financing live
Cash to close
- Down payment
- $44,975
- Closing costs
- $5,397
- Reserves months
- —
- Total cash needed
- —
Loan-product check · same deal, 3 products live
Conventional
25% down · 7.5% · 30yr
- Down + closing
- —
- Monthly P&I
- —
- Monthly cashflow
- —
- DSCR
- —
- Eligible?
- —
Personal DTI + credit; lowest rate.
DSCR
20% down · 8.5% · 30yr
- Down + closing
- —
- Monthly P&I
- —
- Monthly cashflow
- —
- DSCR
- —
- Eligible?
- —
No personal income docs; deal must DSCR.
Hard money
10% down · 12.0% · 12mo
- Down + closing
- —
- Monthly P&I
- —
- Monthly cashflow
- —
- DSCR
- —
- Eligible?
- —
Short-term bridge; refi at stabilization.
Rent comps 5 comps
| Address | Beds | Baths | Sqft | Rent | $/sqft | DOM | Units | Dist |
|---|---|---|---|---|---|---|---|---|
| 78 S Main St Unit 78 1/2 Back Spring Grove, PA | 2.0 | 1.0 | 1100 | $1,195 | $1.09 | 21d | 1 | 0.17mi |
| 50 N East St Spring Grove, PA | 1.0–2.0 | 1.0 | 1149 | $1,495 | $1.30 | 13d | 1 | 0.23mi |
| 327 N Pine Ave Spring Grove, PA | 2.0 | 1.0 | 1050 | $1,295 | $1.23 | 13d | 1 | 0.67mi |
| 1377 Village Dr Spring Grove, PA | 2.0 | 2.0 | 1494 | $1,800 | $1.20 | 21d | 1 | 1.15mi |
| 1377 Village Dr Unit 17 Spring Grove, PA | 2.0 | 2.0 | 1494 | $1,800 | $1.20 | 13d | 1 | 1.15mi |
Listing history 15 events
-
2026-05-05status Pending 1487-char remark
-
2026-04-29$179,900 Active 1487-char remark
-
2025-01-24historical $1,525
-
2024-10-16$1,525
-
2023-06-22historical
-
2017-06-01soldstatus $59,900
-
2017-05-25soldstatus $59,900 198-char remark
Show marketing remark (198 chars)
This semi-detached home is located in the boro of Spring Grove and would be cheaper than renting. Nice fenced back yard with private balcony and back porch. The property also has off street parking.
-
2017-04-01historical 198-char remark
Show marketing remark (198 chars)
This semi-detached home is located in the boro of Spring Grove and would be cheaper than renting. Nice fenced back yard with private balcony and back porch. The property also has off street parking.
-
2017-01-24$59,900 198-char remark
Show marketing remark (198 chars)
This semi-detached home is located in the boro of Spring Grove and would be cheaper than renting. Nice fenced back yard with private balcony and back porch. The property also has off street parking.
-
2017-01-08historical
-
2017-01-08historical
-
2016-10-13$59,900
-
2016-07-08$62,000
-
2016-05-20historical
-
2015-08-28$82,900
ⓘ Source: listings_history table (triggers on properties + properties_extension) + one-shot
backfill from property_details.listing_events for pre-trigger history.
Tax reassessment forecast PA · Partial reset (capped growth)
- Current annual tax
- $2,381 · $198/mo
- Projected year-2 tax
- $2,612 · $218/mo
- Expected delta
- +$231/yr (+$19/mo · 9.7%)
ⓘ Screening estimate from a state-policy table — verify with the county assessor before closing.
Climate risk First Street
- Flood 1/10 Low FEMA zone X (unshaded) · 0% chance over 30 yrs
- Wildfire 1/10 Low
- Heat 6/10 Major 7 d/yr ≥103°F today · 16 d/yr by 30 yrs out
- Wind 4/10 Moderate 11% chance of damaging wind over 30 yrs
- Air quality 3/10 Moderate 2 unhealthy d/yr today · 4 by 30 yrs out
Nearby sold comps map
Loading sold comps map…
Walkable amenities ~0.75 mi
Loading nearby amenities…
Taxation est. · year 1
- Rental income
- $48,120
- − Mortgage interest
- −$10,077
- − Property taxes
- −$2,381
- − Insurance
- −$900
- − Repairs & maintenance
- −$3,850
- − Management
- −$3,850
- − Depreciation
- −$5,233
- Taxable income
- $21,830
- Est. tax owed @ 24.0%
- −$5,239
- After-tax cash flow
- $18,174/yr
For passive investors: Depreciation is non-cash, so a rental often shows a tax loss while cash-flowing — sheltering income. Rental losses are passive: they offset passive income freely, and up to $25,000/yr can offset ordinary (W-2) income if you actively participate and your MAGI is under $100k (phasing out to $0 by $150k); unused losses carry forward. On sale, claimed depreciation is recaptured at up to 25%, and gains may owe capital-gains tax (a 1031 exchange can defer both). Figures are a year-1 estimate at your 24.0% rate — not tax advice; consult a CPA.
Schools (NCES district)
- District
- Spring Grove Area SD
- NCES district ID
- 4222590
- Math proficiency
- 45% ▼ -14.00%
- Reading proficiency
- 65% ▼ -9.00%
- Median HH income
- $64,950
- Composite
- 48.28/100
- National rank
- #2155
- State rank
- #98 of 539 in PA
Livability — Spring Grove
- Score
- 77/100
- State rank
- #325
- US rank
- #3000
Category grades
Schools grade is shown separately in the Schools card above.
Census & demographics
- Census place
- Spring Grove, PA
- County
- York County · 278,806 people
- City population
- 14,730
- Metro
- York-Hanover, PA
- Population (ZIP)
- 14,730
- Household income
- $98,702
- Rent vs Own
- Severe rent burden
- 98.0
Population outlook (York County) Hauer SSP2
- Today (2025)
- 454,205 people
- By 2030
- 457,407 · +0.7%
- By 2040
- 457,529 · +0.7%
- By 2050
- 448,261 · -1.3%
- By 2075
- 427,388 · -5.9%
- By 2100
- 384,218 · -15.4%
Race, ethnicity, and origin ACS 2023
- Neighborhood character
- Predominantly White (92%)
- Race & ethnicity
- White 92% Hispanic / Latino 3% Two or more races 3% Black 2%
- Common ancestry
- Romanian 2% Serbian 1% Lithuanian 1%
- Foreign-born
- 1% · Canada
- Languages at home
- 98% English-only · Spanish 1%
Political lean MEDSL · York
- 2024 margin
- Strong R (+25.3) · D 36.9% · R 62.1%
- 2008→2024 swing
- -11.7pp toward R · 2008: -13.6pp · 2024: -25.3pp
- All cycles
- 2024: R+25.3 2020: R+24.6 2016: R+29.3 2012: R+21.2 2008: R+13.6
Not yet ingested
- Civics
- —
Market trends
- HPI YoY
- ▼ -9.05%
- Current HPI
- 256.2217
- Rent YoY
- —
- Metro
- York-Hanover, PA
- State GDP YoY
- ▲ 1.68%
- F500 in state
- 34
Industry mix (Fortune 500 HQ in PA)
| Industry | F500 HQs | Revenue |
|---|---|---|
| Healthcare | 2 | $309B |
|
||
| Insurance | 2 | $27B |
|
||
| Telecommunications / Media | 1 | $124B |
|
||
| Industrial Distribution | 1 | $22B |
|
||
| Financial Services | 1 | $20B |
|
||
| Chemicals / Materials | 1 | $18B |
|
||
Price history
+117.0% since first listed15 events — show timeline
- 2026-05-05 Pending — BRIGHT MLS
- 2026-04-29 Listed $179,900 BRIGHT MLS
- 2025-01-24 Rental Removed $1,525 APPFOLIO
- 2024-10-16 Listed for Rent $1,525 APPFOLIO
- 2023-06-22 Rental Removed — APPFOLIO
- 2017-06-01 Sold (Public Records) $59,900 Public Records
- 2017-05-25 Sold (MLS) $59,900 BRIGHT MLS
- 2017-04-01 Listing Removed — BRIGHT MLS
- 2017-01-24 Listed $59,900 BRIGHT MLS
- 2017-01-08 Listing Removed — BRIGHT MLS
- 2017-01-08 Listing Removed — BRIGHT MLS
- 2016-10-13 Listed $59,900 BRIGHT MLS
- 2016-07-08 Listed $62,000 BRIGHT MLS
- 2016-05-20 Listing Removed — BRIGHT MLS
- 2015-08-28 Listed $82,900 BRIGHT MLS
Property tax history
+2.6%/yrLatest (2026): $2,381 · +4.3% YoY. Source: county tax records.
Cash-flow waterfall
monthlySold comps — $/sqft
last 12 mo · ≤1 miLoading sold comps…