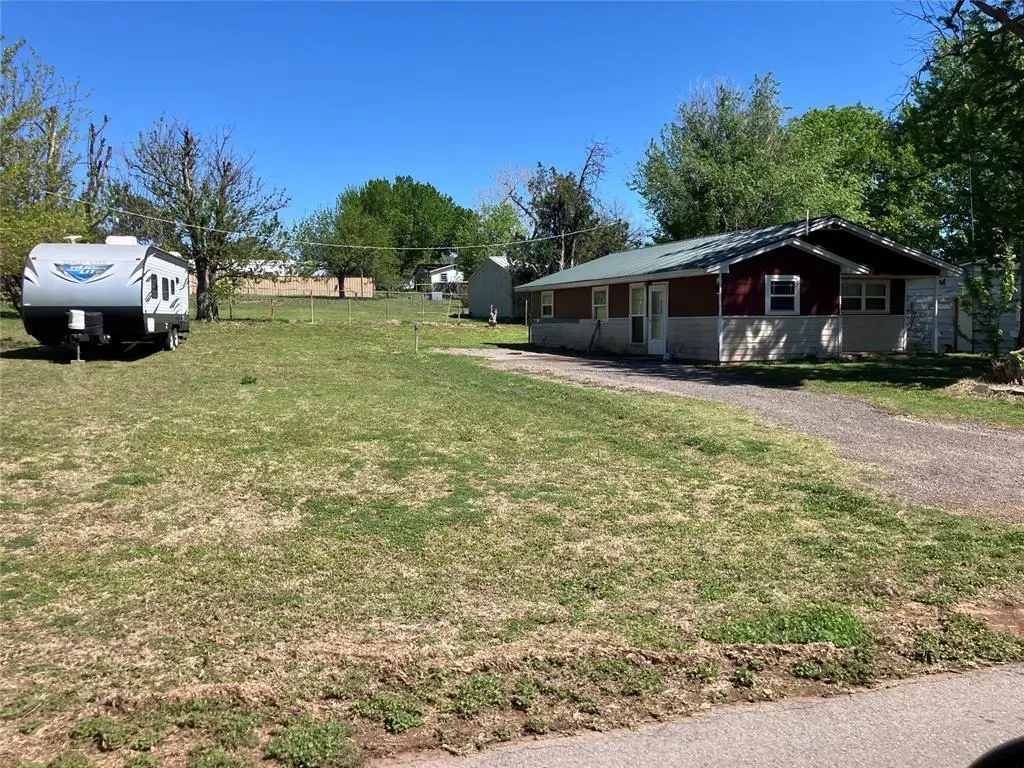
306 S 2nd St · Rush Springs, OK
Flood risk 1/10 · Minimal
- FEMA flood zone
- X (unshaded)
- Chance of flooding over 30 yrs
- 0.0%
- Est. flood insurance / yr
- $507 – $1,088
Fire risk 5/10 · Moderate
- Est. fire insurance / yr
- $2,463 – $4,575
Heat risk 6/10 · Moderate
- Hot days now (above 107°F)
- 7 days/yr
- Hot days in 30 yrs
- 19 days/yr
Wind risk 3/10 · Minor
- Chance of severe wind over 30 yrs
- 6.0%
Air-quality risk 2/10 · Minimal
- Unhealthy air days now
- 1 days/yr
- Unhealthy air days in 30 yrs
- 1 days/yr
Risk factors via First Street. Map © Google.
Why this score? — see what drove the A- grade
The composite is a weighted blend of 9 inputs, each scored 0–100. Each bar is that input's sub-score; the figure is the points it added to the 100-point composite (weight × sub-score).
- Cash flow +30.0/30.0
- ARV discount +15.0/15.0
- 1% rule +10.0/10.0
- DSCR +10.0/10.0
- Appreciation +9.8/10.0
- Livability +3.2/5.0
- Rent growth +2.5/5.0
- Condition / age +2.2/5.0
- Schools +1.6/10.0
$25,000
🖨 Deal sheet 📄 Offer letter ✓ Due diligence
Listing remarks
Investor special in the heart of Marlow! Located at 306 S 2nd St, this fixer-upper offers a great opportunity to bring your vision to life. Home is being sold as-is and is ideal for investors or buyers looking for a renovation project. Conveniently situated with easy access to local shops, dining, and schools, this property has solid potential for the right buyer
Key facts
- 0.24 acre lot
- Built 1970
- Listed 4 days
Tags
Neighborhood map
What this means for you Summary
Snapshot
- This is a 3-bed/1.0-bath single-family listed at $25k. Condition is rated fair.
Deal economics
- At list price, monthly cash flow is $634 ($8k/yr) — positive.
- The deal already cash-flows at list — no discount required.
- Meets the 1% rule at list price ($1k rent vs $25k).
Location & tenants
- Location reads 63/100 on livability (#224 in OK) — a middle-class / working-renter tenant base. Strengths: crime A+, cost of living A+, housing A+; Watch: amenities F, commute F, employment F.
- Rush Springs (rural): math 14% / reading 25% proficiency, ranked #181 of 270 in OK (top 67%) — low school quality limits family demand, transient renter base, plan for 1-2y turnover.
- Zoned schools: Rush Springs Es (math 17% / reading 27%, grade F, #413 of 845 statewide, top 54%, 244 students, 0% FRL); Rush Springs Hs (math 10% / reading 30%, grade F, #236 of 447 statewide, top 61%, 130 students, 0% FRL) — zoned schools average 0% FRL vs 53% district-wide (53 pts lower); this property's tenant base skews higher-income than the district average.
- Market conditions: 34 active listings in the ZIP; 224 units permitted in Grady County in 2024 (0 in 5+ unit buildings).
Forward outlook
- In year one you build about $3k of equity ($173 loan paydown + $2k appreciation (9.6% local appreciation)).
- Grady County population projected at +20% by 2050 — long-run rental-demand tailwind backs the buy-and-hold thesis.
- At projected returns (9.6% appreciation + 3.0% rent growth), your $7k cash investment doubles in ~1 year — after that, you're playing with house money.
- By year 10, paydown + projected appreciation supports a ~$31k cash-out refi (75% LTV) — recoverable capital for the next deal without selling this one.
Negotiation context
- Only 4 days on market — expect competitive offers; lowballing is unlikely to land.
Risks & watch-outs
- Climate carrying-cost: moderate wildfire risk; extreme-heat days projected 7→19/yr by 2055 (HVAC capex compounding) — expect insurance premiums to compound above CPI over the hold.
Questions for the listing agent
- Have any recent inspections been done? Can we get a copy of the seller's disclosures and any deferred-maintenance estimates?
- Built in 1970 — when were the roof, HVAC, electrical panel, plumbing, and water heater last replaced?
- Is there a deadline driving the sale (1031 exchange, divorce, estate, relocation)? That informs how much negotiation room exists.
- Schools are F-rated, which usually means shorter tenancies and higher turnover. Who's the typical renter profile here, and what's been the actual vacancy rate?
- What's the average days-on-market for RENTAL listings here right now (not sales)? A rising rental-DOM trend means longer vacancies and softer asking-rent achievability than the comps imply.
- What's the recent tenant-quality profile in this submarket — average credit score on applications, eviction rate, late-payment / NSF rate, and stable-employment percentage? A property-management company in the area should have these aggregated.
- How much new for-sale + rental construction is in the pipeline within 1–3 miles? Heavy new supply typically softens prices + rents 12–24 months out; constrained supply supports both.
Investment metrics
- 1% rule
- 4.08% ✓
- Cap rate
- 36.71%
- Cash-on-cash
- 108.62%
- DSCR
- 5.83
- GRM
- 2.0
CMA / ARV
- ARV (on-the-fly)
- $39,664
- Comps found
- 3
Show comp detail 3 sales within ~0.75 mi
| Address | Dist | Beds/Ba | Sqft | Sold | Price | $/sf | Match |
|---|---|---|---|---|---|---|---|
| 401 S 1st | 0.06mi | 2/1.0 (-1) | 1,196 (+12%) | 12mo | $44,000 | $37 | 63 |
| 104 W Walnut | 0.45mi | 2/1.0 (-1) | 1,148 (+7%) | 7mo | $38,000 | $33 | 56 |
| 204 N Hampton | 0.25mi | 2/1.0 (-1) | 952 (-11%) | 15mo | $40,000 | $42 | 52 |
Match score weights: distance 35% · size 25% · config 20% · recency 20%. Top-matched comps best support the ARV.
Projected returns pro-forma
9.59% appreciation · 3.0% rent growth · sell at horizon
- IRR
- —
- Equity multiple
- 8.61×
- Total profit
- $53,280
- Equity at exit
- $21,769
- IRR
- —
- Equity multiple
- 18.86×
- Total profit
- $125,020
- Equity at exit
- $46,165
Cash invested: $7,000 (down + closing). Projections, not guarantees.
Landlord ↔ Tenant lean methodology
- Overall (STATE)
- 83 Strongly Landlord-Friendly
- State Oklahoma
- 83 Strongly Landlord-Friendly · R+20
- County
- — inherits STATE
- City
- — inherits STATE
ZIP-level market 73082
- Home prices YoY
- 3.0%
- Active inventory
- 34
- Price-to-rent
- 2.0×
Monthly cashflow live
- Estimated rent
- $1,021 medium interval (Pro) →
- Mortgage (P&I)
- −$131
- Tax est. 1.5%
- −$31 /mo · $375/yr
- Insurance
- −$10
- HOA
- −$0
- Vacancy / Maint / Mgmt
- −$214
- Net cashflow
- $634
Break-even live
UW: 25.0% down · 7.5% · 30yr · 1.5% tax · 5.0% vac · 8.0% maint · 8.0% mgmt
Financing live
Cash to close
- Down payment
- $6,250
- Closing costs
- $750
- Reserves months
- —
- Total cash needed
- —
Loan-product check · same deal, 3 products live
Conventional
25% down · 7.5% · 30yr
- Down + closing
- —
- Monthly P&I
- —
- Monthly cashflow
- —
- DSCR
- —
- Eligible?
- —
Personal DTI + credit; lowest rate.
DSCR
20% down · 8.5% · 30yr
- Down + closing
- —
- Monthly P&I
- —
- Monthly cashflow
- —
- DSCR
- —
- Eligible?
- —
No personal income docs; deal must DSCR.
Hard money
10% down · 12.0% · 12mo
- Down + closing
- —
- Monthly P&I
- —
- Monthly cashflow
- —
- DSCR
- —
- Eligible?
- —
Short-term bridge; refi at stabilization.
Listing history 2 events
-
2026-04-24status Pending
-
2026-04-20$25,000 Active
ⓘ Source: listings_history table (triggers on properties + properties_extension) + one-shot
backfill from property_details.listing_events for pre-trigger history.
Climate risk First Street
- Flood 1/10 Low FEMA zone X (unshaded) · 0% chance over 30 yrs
- Wildfire 5/10 Major
- Heat 6/10 Major 7 d/yr ≥107°F today · 19 d/yr by 30 yrs out
- Wind 3/10 Moderate 6% chance of damaging wind over 30 yrs
- Air quality 2/10 Low 1 unhealthy d/yr today · 1 by 30 yrs out
Nearby sold comps map
Loading sold comps map…
Walkable amenities ~0.75 mi
Loading nearby amenities…
Taxation est. · year 1
- Rental income
- $12,249
- − Mortgage interest
- −$1,400
- − Property taxes
- −$375
- − Insurance
- −$125
- − Repairs & maintenance
- −$980
- − Management
- −$980
- − Depreciation
- −$727
- Taxable income
- $7,662
- Est. tax owed @ 24.0%
- −$1,839
- After-tax cash flow
- $5,765/yr
For passive investors: Depreciation is non-cash, so a rental often shows a tax loss while cash-flowing — sheltering income. Rental losses are passive: they offset passive income freely, and up to $25,000/yr can offset ordinary (W-2) income if you actively participate and your MAGI is under $100k (phasing out to $0 by $150k); unused losses carry forward. On sale, claimed depreciation is recaptured at up to 25%, and gains may owe capital-gains tax (a 1031 exchange can defer both). Figures are a year-1 estimate at your 24.0% rate — not tax advice; consult a CPA.
Condition & rehab AI · 13 photos
This fixer-upper requires significant repairs and updates to its roof, exterior, interior, and landscaping. While it has potential, the extensive work needed makes it a moderate rehab project.
Repairs flagged
- Major roof — The independent image shows significant damage to the roof.
- Major exterior siding — The independent image shows weathered siding and peeling paint.
- Major interior walls — The independent image shows peeling paint and worn carpeting.
- Major landscaping — The independent image shows dated landscaping and fencing that could be updated for curb appeal.
Value-add opportunities
- Both Paint the exterior and interior walls — Fresh paint can improve the home's curb appeal and interior aesthetics.
- Both Replace the roof — A new roof will protect the home from weather damage and improve its overall appearance.
- Both Upgrade the flooring — New flooring will enhance the home's interior and make it more appealing to potential buyers.
- Both Update the landscaping and fencing — Fresh landscaping and updated fencing will improve the home's curb appeal and make it more attractive to potential buyers and renters.
Renovation cost estimate screening
| Repair item | Severity | Est. cost |
|---|---|---|
| roof · The independent image shows significant damage to the roof. | Major | $15,000–50,000 |
| exterior siding · The independent image shows weathered siding and peeling paint. | Major | $15,000–50,000 |
| interior walls · The independent image shows peeling paint and worn carpeting. | Major | $15,000–50,000 |
| landscaping · The independent image shows dated landscaping and fencing that could be updated for curb appeal. | Major | $15,000–50,000 |
| Total estimated repair cost · 4 items | $60,000–200,000 |
Value-add ROI direction
- Both Paint the exterior and interior walls — Fresh paint can improve the home's curb appeal and interior aesthetics. ↑
- Both Replace the roof — A new roof will protect the home from weather damage and improve its overall appearance. ↑
- Both Upgrade the flooring — New flooring will enhance the home's interior and make it more appealing to potential buyers. ↑
- Both Update the landscaping and fencing — Fresh landscaping and updated fencing will improve the home's curb appeal and make it more attractive to potential buyers and renters. ↑
ⓘ Cost ranges are severity-bucket heuristics (US national rule-of-thumb). Get contractor quotes + a written scope before underwriting a rehab budget.
Schools (NCES district)
- District
- Rush Springs
- NCES district ID
- 4026550
- Math proficiency
- 14% ▼ -16.00%
- Reading proficiency
- 25% ▼ -10.00%
- Median HH income
- $37,999
- Composite
- 16.31/100
- National rank
- #9211
- State rank
- #181 of 270 in OK
Livability — Rush Springs
- Score
- 63/100
- State rank
- #224
- US rank
- #15766
Category grades
Schools grade is shown separately in the Schools card above.
Census & demographics
- Census place
- Rush Springs, OK
- Population (ZIP)
- 2,836
Population outlook (Grady County) Hauer SSP2
- Today (2025)
- 59,962 people
- By 2030
- 62,513 · +4.3%
- By 2040
- 67,338 · +12.3%
- By 2050
- 71,719 · +19.6%
- By 2075
- 82,684 · +37.9%
- By 2100
- 89,387 · +49.1%
Race, ethnicity, and origin ACS 2023
- Neighborhood character
- Predominantly White (86%)
- Race & ethnicity
- White 86% Two or more races 7% Hispanic / Latino 4% Native American 2% Black 1%
- Common ancestry
- Lithuanian 3% Slovak 2% Scottish 2%
- Foreign-born
- 1% · Canada
- Languages at home
- 99% English-only · Spanish 1%
Political lean MEDSL · Grady
- 2024 margin
- Solid R (+62.7) · D 17.9% · R 80.6% · Other 1.5%
- 2008→2024 swing
- -16.0pp toward R · 2008: -46.7pp · 2024: -62.7pp
- All cycles
- 2024: R+62.7 2020: R+62.3 2016: R+60.3 2012: R+51.2 2008: R+46.7
Not yet ingested
- Civics
- —
Market trends
- HPI YoY
- ▲ 9.59%
- Current HPI
- 331.627
- Rent YoY
- —
- Metro
- —
- State GDP YoY
- ▲ 1.55%
- F500 in state
- 6
Industry mix (Fortune 500 HQ in OK)
| Industry | F500 HQs | Revenue |
|---|---|---|
| Energy | 3 | $48B |
|
||
Price history
2 events — show timeline
- 2026-04-24 Pending — MLSOK
- 2026-04-20 Listed $25,000 MLSOK
Cash-flow waterfall
monthlySold comps — $/sqft
last 12 mo · ≤1 miLoading sold comps…