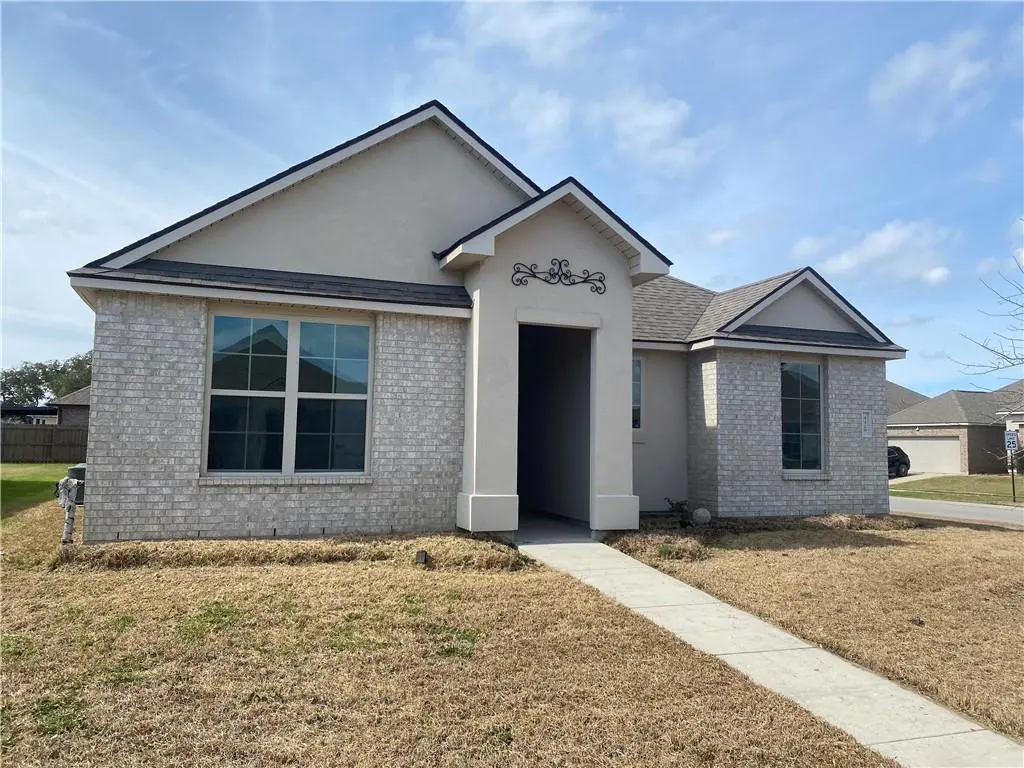
4429 Marais River Dr · Slidell, LA
Flood risk No data
- FEMA flood zone
- —
- Chance of flooding over 30 yrs
- —
- Est. flood insurance / yr
- —
Fire risk No data
- Est. fire insurance / yr
- —
Heat risk No data
- Hot days now (above threshold)
- —
- Hot days in 30 yrs
- —
Wind risk No data
- Chance of severe wind over 30 yrs
- —
Air-quality risk No data
- Unhealthy air days now
- —
- Unhealthy air days in 30 yrs
- —
Risk factors via First Street. Map © Google.
Why this score? — see what drove the C- grade
The composite is a weighted blend of 9 inputs, each scored 0–100. Each bar is that input's sub-score; the figure is the points it added to the 100-point composite (weight × sub-score).
- Cash flow +14.2/30.0
- ARV discount +12.7/15.0
- DSCR +4.3/10.0
- Schools +4.3/10.0
- 1% rule +4.0/10.0
- Condition / age +4.0/5.0
- Livability +3.5/5.0
- Rent growth +2.9/5.0
- Appreciation +0.0/10.0
$244,500
🖨 Deal sheet 📄 Offer letter ✓ Due diligence
Listing remarks MLS
Home is nestled in a quiet Slidell neighborhood. The property offers a functional layout with comfortable living spaces, generous lighting, and flow ideal for everyday living. The kitchen opens to the main living area and the bedrooms provide flexibility for family and guests. Home is located near shopping, dining, and easy access to I-10 for commuting. Schedule your showing today.
Key facts
- Near dining
- Near shopping
- Functional layout
Tags
Neighborhood map
What this means for you Summary
Snapshot
- This is a 3-bed/2.0-bath single-family listed at $244k. Condition is rated good.
Deal economics
- At list price, monthly cash flow is $42 ($502/yr) — positive.
- The deal already cash-flows at list — no discount required.
- To meet the 1% rule (rent ≥ 1% of price), the offer needs to be $220k (9.8% below list).
- Recommended offer: $215k (12.0% below list) — sets the bar for market timing.
Location & tenants
- Location reads 70/100 on livability (#57 in LA) — a middle-class / working-renter tenant base. Strengths: cost of living A+, housing A+, health & safety A+; Watch: amenities F, commute F.
- St. Tammany Parish (suburban): math 43% / reading 55% proficiency, ranked #11 of 98 in LA (top 11%) — families likely to look elsewhere, expect single-tenant / working-renter base with shorter leases.
- Market conditions: Rents rising (+1.7%/yr); 589 active listings in the ZIP; 16 comparable units currently listed for rent nearby; rentals at typical pace (median 24d on market — plan ~3-4 weeks tenant-placement turnaround); solid renter incomes; 1,064 units permitted in St. Tammany Parish in 2024 (0 in 5+ unit buildings).
Forward outlook
- Local home prices are declining (-3.0%/yr); year-one equity from $2k of loan paydown is wiped out by about $7k of value loss. Plan a longer hold.
- St. Tammany County population projected at +27% by 2050 — long-run rental-demand tailwind backs the buy-and-hold thesis.
Negotiation context
- It's been on market 128 days — a 12% lower offer ($215k) is reasonable based on typical stale-listing flexibility.
- 5 sale attempts since 2y ago with the ask held roughly flat each time — persistent listings suggest the price (not the market) is what's stuck; bring a comps-based counter.
Questions for the listing agent
- It's been on market 128 days. Have you received any prior offers? Is the seller open to a 12% concession, seller financing, or rate buy-down credit?
- What does the HOA fee cover, when was the last increase, and are there any pending special assessments or reserve-fund shortfalls?
- Why hasn't it sold? Are there any deal-killer items the seller is aware of (foundation, flood, title, zoning, code violations)?
- Is there a deadline driving the sale (1031 exchange, divorce, estate, relocation)? That informs how much negotiation room exists.
- Schools are B-rated — typically a magnet for longer-tenancy family renters. What's the average tenant stay here, and is there a school-zone premium baked into asking?
- What's the average days-on-market for RENTAL listings here right now (not sales)? A rising rental-DOM trend means longer vacancies and softer asking-rent achievability than the comps imply.
- What's the recent tenant-quality profile in this submarket — average credit score on applications, eviction rate, late-payment / NSF rate, and stable-employment percentage? A property-management company in the area should have these aggregated.
- How much new for-sale + rental construction is in the pipeline within 1–3 miles? Heavy new supply typically softens prices + rents 12–24 months out; constrained supply supports both.
Investment metrics
- 1% rule
- 0.90% ✗
- Cap rate
- 6.50%
- Cash-on-cash
- 0.73%
- DSCR
- 1.03
- GRM
- 9.2
CMA / ARV
- ARV (median comp)
- $276,689
- List price
- $244,500
- Delta
- -11.63%
- Verdict
- UNDERPRICED
- Comps
- 20 within 1.0 mi
Show comp detail 12 sales within ~0.75 mi
| Address | Dist | Beds/Ba | Sqft | Sold | Price | $/sf | Match |
|---|---|---|---|---|---|---|---|
| 4426 Marais River Dr | 0.03mi | 3/2.0 | 1,455 (-7%) | 2mo | $215,000 | $148 | 86 |
| 4658 Marais River Dr | 0.25mi | 4/2.0 (+1) | 1,506 (-4%) | 1mo | $234,900 | $156 | 76 |
| 4664 Marais River Dr | 0.25mi | 4/2.0 (+1) | 1,506 (-4%) | 2mo | $234,900 | $156 | 76 |
| 4670 Marais River Dr | 0.25mi | 4/2.0 (+1) | 1,506 (-4%) | 3mo | $234,900 | $156 | 75 |
| 4679 Marais River Dr | 0.27mi | 4/2.0 (+1) | 1,506 (-4%) | 2mo | $229,900 | $153 | 75 |
| 4686 Marais River Dr | 0.25mi | 4/2.0 (+1) | 1,506 (-4%) | 6mo | $225,750 | $150 | 72 |
| 3381 Bellwick Bay Dr | 0.41mi | 4/2.0 (+1) | 1,610 (+3%) | 2mo | $239,900 | $149 | 70 |
| 4612 Marais River Dr | 0.25mi | 3/2.0 | 1,392 (-11%) | 1mo | $229,900 | $165 | 69 |
| 5149 Clarkston Grove Dr | 0.53mi | 3/2.0 | 1,613 (+3%) | 6mo | $214,000 | $133 | 65 |
| 949 Channel Bend Ct | 0.58mi | 3/2.5 | 1,644 (+5%) | 2mo | $262,181 | $159 | 61 |
| 4778 Cotton Grass Dr | 0.62mi | 4/2.0 (+1) | 1,425 (-9%) | 1mo | $216,900 | $152 | 51 |
| 54293 Highway 433 | 0.57mi | 2/2.5 (-1) | 1,363 (-13%) | 6mo | $205,000 | $150 | 40 |
Match score weights: distance 35% · size 25% · config 20% · recency 20%. Top-matched comps best support the ARV.
Projected returns pro-forma
-3.0% appreciation · 1.72% rent growth · sell at horizon
- IRR
- -16.6%
- Equity multiple
- 0.42×
- Total profit
- $-39,722
- Equity at exit
- $36,456
- IRR
- -10.8%
- Equity multiple
- 0.38×
- Total profit
- $-42,213
- Equity at exit
- $21,140
Cash invested: $68,460 (down + closing). Projections, not guarantees.
Landlord ↔ Tenant lean methodology
- Overall (STATE)
- 90 Strongly Landlord-Friendly
- State Louisiana
- 90 Strongly Landlord-Friendly · R+12
- County
- — inherits STATE
- City
- — inherits STATE
ZIP-level market 70461
- Home prices YoY
- -33.0%
- Rents YoY
- 1.7%
- Active inventory
- 589
- Price-to-rent
- 9.2×
Monthly cashflow live
- Estimated rent
- $2,205 high interval (Pro) →
- Mortgage (P&I)
- −$1,282
- Tax from tax record
- −$266 /mo · $3,189/yr
- Insurance
- −$102
- HOA
- −$50
- Vacancy / Maint / Mgmt
- −$463
- Net cashflow
- $42
Break-even live
UW: 25.0% down · 7.5% · 30yr · 1.5% tax · 5.0% vac · 8.0% maint · 8.0% mgmt
Financing live
Cash to close
- Down payment
- $61,125
- Closing costs
- $7,335
- Reserves months
- —
- Total cash needed
- —
Loan-product check · same deal, 3 products live
Conventional
25% down · 7.5% · 30yr
- Down + closing
- —
- Monthly P&I
- —
- Monthly cashflow
- —
- DSCR
- —
- Eligible?
- —
Personal DTI + credit; lowest rate.
DSCR
20% down · 8.5% · 30yr
- Down + closing
- —
- Monthly P&I
- —
- Monthly cashflow
- —
- DSCR
- —
- Eligible?
- —
No personal income docs; deal must DSCR.
Hard money
10% down · 12.0% · 12mo
- Down + closing
- —
- Monthly P&I
- —
- Monthly cashflow
- —
- DSCR
- —
- Eligible?
- —
Short-term bridge; refi at stabilization.
Rent comps 16 comps
| Address | Beds | Baths | Sqft | Rent | $/sqft | DOM | Units | Dist |
|---|---|---|---|---|---|---|---|---|
| 713 Lakeshore Vlg E Slidell, LA | 3.0 | 2.0 | 1563 | $2,100 | $1.34 | 43d | 1 | 0.08mi |
| 3635 Trestle Crossing Ave Slidell, LA | 4.0 | 3.0 | 2208 | $2,600 | $1.18 | 43d | 1 | 0.18mi |
| 7535 1st Lake Dr Slidell, LA | 3.0 | 2.0 | 1564 | $2,195 | $1.40 | 17d | 1 | 0.27mi |
| 5579 Grand Springs Rd Slidell, LA | 4.0 | 2.0 | 1867 | $2,200 | $1.18 | 43d | 1 | 0.39mi |
| 289 Grand Isle Ct Slidell, LA | 4.0 | 2.0 | 1980 | $2,300 | $1.16 | 23d | 1 | 0.44mi |
| 289 Grand Isle Ct Slidell, LA | 4.0 | 2.0 | 1980 | $2,300 | $1.16 | 43d | 1 | 0.44mi |
| 5169 Clarkston Grove Dr Slidell, LA | 4.0 | 3.0 | 2107 | $2,250 | $1.07 | 17d | 1 | 0.49mi |
| 479 Lakeshore Vlg E Slidell, LA | 4.0 | 2.0 | 1893 | $2,400 | $1.27 | 23d | 1 | 0.58mi |
| 109 Oak Landing Ln Slidell, LA | 4.0 | 2.0 | 1884 | $2,350 | $1.25 | 17d | 1 | 0.61mi |
| 200 Long St Slidell, LA | 2.0–4.0 | 2.0 | 1112 | $1,373 | $1.23 | 1d | 1 | 0.62mi |
| 408 Lakeshore Vlg E Slidell, LA | 3.0 | 2.0 | 1785 | $2,395 | $1.34 | 11d | 1 | 0.74mi |
| 5225 Summer Pecan Rd Slidell, LA | 4.0 | 2.0 | 2079 | $2,300 | $1.11 | 23d | 1 | 1.07mi |
| 3604 Spruce Key Ln Slidell, LA | 3.0–4.0 | 2.0 | 1539 | $2,150 | $1.40 | 44d | 1 | 1.14mi |
| 3604 Spruce Key Ln Slidell, LA | 3.0–4.0 | 2.0 | 1586 | $2,195 | $1.38 | 1d | 14 | 1.14mi |
| 5265 Summer Pecan Rd Slidell, LA | 4.0 | 2.0 | 1647 | $2,300 | $1.40 | 2d | 1 | 1.15mi |
| 3616 Spruce Key Ln Slidell, LA | 3.0 | 2.0 | 1635 | $2,395 | $1.46 | 1d | 1 | 1.17mi |
HOA detail
- Monthly dues
- $50 · $600/yr
Listing history 21 events
-
2026-06-18days on market $244,500 Active 128 DOM
-
2026-06-17price $244,500 Active 127 DOM
-
2026-06-17days on market $250,000 Active 127 DOM
-
2026-06-16days on market $250,000 Active 126 DOM
-
2026-06-15days on market $250,000 Active 125 DOM
-
2026-06-13days on market $250,000 Active 123 DOM
-
2026-06-10days on market $250,000 Active 120 DOM
-
2026-06-09days on market $250,000 Active 119 DOM
-
2026-06-08days on market $250,000 Active 118 DOM
-
2026-06-07days on market $250,000 Active 117 DOM
-
2026-06-03days on market $250,000 Active 113 DOM
-
2026-06-02days on market $250,000 Active 112 DOM
-
2026-06-01days on market $250,000 Active 111 DOM
-
2026-05-31days on market $250,000 Active 110 DOM
-
2026-02-10$250,000 Active 384-char remark
Show marketing remark (384 chars)
Home is nestled in a quiet Slidell neighborhood. The property offers a functional layout with comfortable living spaces, generous lighting, and flow ideal for everyday living. The kitchen opens to the main living area and the bedrooms provide flexibility for family and guests. Home is located near shopping, dining, and easy access to I-10 for commuting. Schedule your showing today.
-
2025-09-03$240,000 Active
-
2025-01-27$245,000 Active
-
2024-11-20price $247,000
-
2024-11-20price $247,000
-
2024-07-25$252,000 Active
ⓘ Source: listings_history table (triggers on properties + properties_extension) + one-shot
backfill from property_details.listing_events for pre-trigger history.
Tax reassessment forecast LA · Resets to sale price
- Current annual tax
- $3,189 · $266/mo
- Projected year-2 tax
- $3,189 · $266/mo
- Expected delta
- $0/yr ($0/mo · 0.0%)
ⓘ Screening estimate from a state-policy table — verify with the county assessor before closing.
Nearby sold comps map
Loading sold comps map…
Walkable amenities ~0.75 mi
Loading nearby amenities…
Taxation est. · year 1
- Rental income
- $26,455
- − Mortgage interest
- −$13,696
- − Property taxes
- −$3,189
- − Insurance
- −$1,222
- − Repairs & maintenance
- −$2,116
- − Management
- −$2,116
- − HOA
- −$600
- − Depreciation
- −$7,113
- Taxable loss
- −$3,598
- Est. tax savings @ 24.0%
- +$864
- After-tax cash flow
- $1,365/yr
For passive investors: Depreciation is non-cash, so a rental often shows a tax loss while cash-flowing — sheltering income. Rental losses are passive: they offset passive income freely, and up to $25,000/yr can offset ordinary (W-2) income if you actively participate and your MAGI is under $100k (phasing out to $0 by $150k); unused losses carry forward. On sale, claimed depreciation is recaptured at up to 25%, and gains may owe capital-gains tax (a 1031 exchange can defer both). Figures are a year-1 estimate at your 24.0% rate — not tax advice; consult a CPA.
Condition & rehab AI · 9 photos
This home is in good condition with a good condition score of 80. It has a modern kitchen and bathrooms, and is located in a quiet neighborhood. The home is move-in ready with minimal repairs and maintenance needed. The highest-ROI updates would be to improve the landscaping and curb appeal, paint the interior walls, replace the flooring in the bathrooms, and update the kitchen backsplash and countertops.
Value-add opportunities
- Both Landscaping and curb appeal improvements — Enhanced landscaping can improve the home's curb appeal and attract more potential buyers or renters.
- Both Painting interior walls — Fresh paint can make the interior look more inviting and modern, appealing to both buyers and renters.
- Both Flooring replacement in bathrooms — Replacing dated flooring in bathrooms can significantly improve the home's appearance and functionality.
- Both Kitchen backsplash and countertop replacement — Updating the backsplash and countertops can modernize the kitchen and add value to the home.
Renovation cost estimate screening
Value-add ROI direction
- Both Landscaping and curb appeal improvements — Enhanced landscaping can improve the home's curb appeal and attract more potential buyers or renters. ↑
- Both Painting interior walls — Fresh paint can make the interior look more inviting and modern, appealing to both buyers and renters. ↑
- Both Flooring replacement in bathrooms — Replacing dated flooring in bathrooms can significantly improve the home's appearance and functionality. ↑
- Both Kitchen backsplash and countertop replacement — Updating the backsplash and countertops can modernize the kitchen and add value to the home. ↑
ⓘ Cost ranges are severity-bucket heuristics (US national rule-of-thumb). Get contractor quotes + a written scope before underwriting a rehab budget.
Schools (NCES district)
- District
- St. Tammany Parish
- NCES district ID
- 2201650
- Math proficiency
- 43% ▼ -32.00%
- Reading proficiency
- 55% ▼ -26.00%
- Median HH income
- $61,752
- Composite
- 43.04/100
- National rank
- #3098
- State rank
- #11 of 98 in LA
Livability — Slidell
- Score
- 70/100
- State rank
- #57
- US rank
- #7673
Category grades
Schools grade is shown separately in the Schools card above.
Census & demographics
- County
- Saint Tammany Parish · 228,296 people
- City population
- 95,511
- Metro
- New Orleans-Metairie, LA
- Population (ZIP)
- 34,808
- Household income
- $89,003
- Rent vs Own
- Severe rent burden
- 328.0
Population outlook (St. Tammany County) Hauer SSP2
- Today (2025)
- 286,725 people
- By 2030
- 304,175 · +6.1%
- By 2040
- 336,203 · +17.3%
- By 2050
- 364,590 · +27.2%
- By 2075
- 433,362 · +51.1%
- By 2100
- 470,333 · +64.0%
Race, ethnicity, and origin ACS 2023
- Neighborhood character
- Diverse neighborhood (Simpson 0.63)
- Race & ethnicity
- White 55% Black 24% Two or more races 14% Hispanic / Latino 11% Asian 3%
- Hispanic origin (detail)
- Common ancestry
- Lithuanian 9% Italian 1% Romanian 1%
- Foreign-born
- 8% · Canada, China, Vietnam
- Languages at home
- 89% English-only · Spanish 7% Chinese 1% Vietnamese 1%
Political lean MEDSL · St. Tammany
- 2024 margin
- Solid R (+43.8) · D 27.3% · R 71.1% · Other 1.6%
- 2008→2024 swing
- +9.6pp toward D · 2008: -53.4pp · 2024: -43.8pp
- All cycles
- 2024: R+43.8 2020: R+44.2 2016: R+50.8 2012: R+52.2 2008: R+53.4
Not yet ingested
- Civics
- —
Market trends
- HPI YoY
- ▼ -74.47%
- Current HPI
- 151.3353
- Rent YoY
- ▲ 1.72%
- Metro
- New Orleans-Metairie, LA
- State GDP YoY
- ▲ 3.29%
- F500 in state
- 10
Industry mix (Fortune 500 HQ in LA)
| Industry | F500 HQs | Revenue |
|---|---|---|
| Telecommunications | 2 | $23B |
|
||
| Utilities | 1 | $12B |
|
||
| Wholesale / Distribution | 1 | $5B |
|
||
| Advertising | 1 | $2B |
|
||
Price history
-0.8% since first listed7 events — show timeline
- 2026-02-10 Listed $250,000 GSREIN
- 2026-02-10 Listed $250,000 AcadianaMLS
- 2025-09-03 Listed $240,000 AcadianaMLS
- 2025-01-27 Listed $245,000 AcadianaMLS
- 2024-11-20 Price Changed $247,000 AcadianaMLS
- 2024-11-20 Price Changed $247,000 GSREIN
- 2024-07-25 Listed $252,000 AcadianaMLS
Property tax history
+7.2%/yrLatest (2025): $3,189 · -0.5% YoY. Source: county tax records.
Cash-flow waterfall
monthlySold comps — $/sqft
last 12 mo · ≤1 miLoading sold comps…