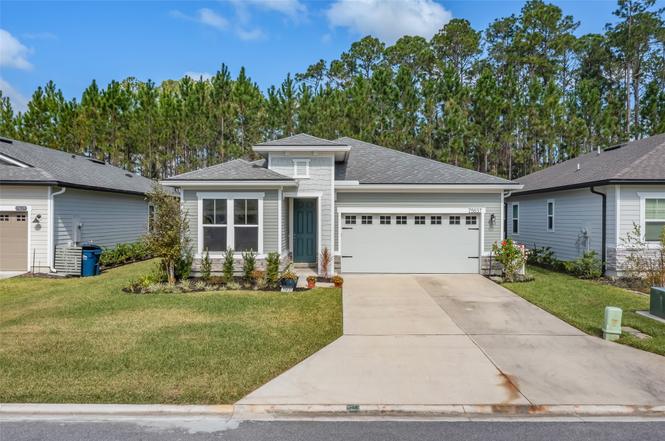
75637 Spoonbill Ln · Jacksonville, FL
Flood risk 1/10 · Minimal
- FEMA flood zone
- X (unshaded)
- Chance of flooding over 30 yrs
- 0.0%
- Est. flood insurance / yr
- $507 – $1,088
Fire risk 7/10 · Major
- Est. fire insurance / yr
- $947 – $1,759
Heat risk 9/10 · Severe
- Hot days now (above 107°F)
- 7 days/yr
- Hot days in 30 yrs
- 20 days/yr
Wind risk 9/10 · Severe
- Chance of severe wind over 30 yrs
- 99.0%
Air-quality risk 5/10 · Moderate
- Unhealthy air days now
- 8 days/yr
- Unhealthy air days in 30 yrs
- 10 days/yr
Risk factors via First Street. Map © Google.
Why this score? — see what drove the D grade
The composite is a weighted blend of 9 inputs, each scored 0–100. Each bar is that input's sub-score; the figure is the points it added to the 100-point composite (weight × sub-score).
- Appreciation +10.0/10.0
- ARV discount +6.8/15.0
- Cash flow +6.0/30.0
- Schools +6.0/10.0
- Livability +4.2/5.0
- Rent growth +3.2/5.0
- Condition / age +2.5/5.0
- 1% rule +1.5/10.0
- DSCR +0.3/10.0
$425,000
🖨 Deal sheet (PDF) 📄 Offer letter ✓ Due diligence
Listing remarks
Price Reduction!!! Better than new construction with an assumable 5% FHA loan. This 2 year new stunning home offers spacious living with an open-concept layout, and a beautifully designed kitchen perfect for entertaining. This home also boast several upgrades to include large glass shower enclosure, larger tinted patio doors, taller commodes and raised countertops throughout. Don’t forget to check out the Master bedroom chandelier ceiling fan! This homes is ready for a fast and efficient home office with CAT 5 cable installed throughout. Nestled up to a Nature Preserve (No one behind you. ) The patio is plumbed with natural gas and filtered water for an outdoor kitchen. Tributary prov
Key facts
- Open-concept design
- Covered lanai
- 5,998 sq ft lot
Tags
Property features AI
Finance
- HOA & community: Homeowners association with $150 annual fee; Community pool
Exterior
- Parking: Two-car garage with garage door opener
- Utilities: Public water; Public sewer; Cable available
- Home design: Single-story home; Resale property; PUD zoning; 120 x 50 lot dimensions; Paved road frontage; Preservation frontage type
- Construction: Built by Richmond American; Fiber cement and frame construction; Shingle roof
- Exterior features: Sprinkler / irrigation system; Rear covered porch and patio; Community pool
Interior
- Kitchen: Dishwasher; Disposal; Microwave; Oven; Stove; Refrigerator; Water softener (owned); Some gas appliances
- Bathrooms: 3 full bathrooms
- Heating & cooling: Central heating (electric); Central air conditioning (electric)
- Interior features: Ceiling fans; Cable TV connection; Window treatments (blinds, drapes); Insulated windows
- Laundry & utility: Washer; Dryer
Neighborhood map
What this means for you Summary
Snapshot
- This is a 4-bed/3.0-bath single-family listed at $425k.
Deal economics
- At list price, monthly cash flow is $-818 ($-10k/yr) — negative.
- To cash-flow at today's rent, offer at most $280k (34.0% below list).
- To meet the 1% rule (rent ≥ 1% of price), the offer needs to be $277k (34.7% below list).
- Recommended offer: $277k (34.7% below list) — sets the bar for 1% rule.
Location & tenants
- Location reads 83/100 on livability (#50 in FL, #911 nationally) — a professional / high-income tenant draw. Strengths: amenities A+, commute A+, housing A+.
- Nassau (town): math 74% / reading 65% proficiency, ranked #4 of 73 in FL (top 6%) — acceptable for families but not a draw, mixed tenant base, ~2y average lease.
- Market conditions: Rents rising (+2.9%/yr); 601 active listings in the ZIP; 11 comparable units currently listed for rent nearby; rentals at typical pace (median 22d on market — plan ~3-4 weeks tenant-placement turnaround); solid renter incomes; 953 units permitted in Nassau County in 2024 (24 in 5+ unit buildings).
- This rent runs 36% of the median local income ($93k/yr) — at the standard rent-burdened threshold; future hikes will face affordability resistance.
Forward outlook
- In year one you build about $45k of equity ($3k loan paydown + $42k appreciation (10.0% local appreciation)).
- Nassau County population projected at +17% by 2050 — long-run rental-demand tailwind backs the buy-and-hold thesis.
- By year 2, paydown + projected appreciation supports a ~$73k cash-out refi (75% LTV) — recoverable capital for the next deal without selling this one.
Negotiation context
- It's been on market 419 days — a 12% lower offer ($374k) is reasonable based on typical stale-listing flexibility.
- 5 sale attempts since 2y ago; this cycle's ask has dropped $50k (11%) from the opening price — seller is motivated, your offer sets the floor, not the list.
Risks & watch-outs
- Climate carrying-cost: severe wind risk, 99% chance of damaging wind over 30y; major wildfire risk; extreme-heat days projected 7→20/yr by 2055 (HVAC capex compounding) — expect insurance premiums to compound above CPI over the hold.
Questions for the listing agent
- What do current leases actually rent for vs. the listed asking? Can we see a recent rent roll and the last 12 months of T-12 income?
- It's been on market 419 days. Have you received any prior offers? Is the seller open to a 35% concession, seller financing, or rate buy-down credit?
- What does the HOA fee cover, when was the last increase, and are there any pending special assessments or reserve-fund shortfalls?
- Why hasn't it sold? Are there any deal-killer items the seller is aware of (foundation, flood, title, zoning, code violations)?
- Is there a deadline driving the sale (1031 exchange, divorce, estate, relocation)? That informs how much negotiation room exists.
- Schools are B-rated — typically a magnet for longer-tenancy family renters. What's the average tenant stay here, and is there a school-zone premium baked into asking?
- The area grade is low — what's the realistic commute time and amenity access for the typical tenant pool here? Any planned neighborhood developments (good or bad) we should know about?
- What's the average days-on-market for RENTAL listings here right now (not sales)? A rising rental-DOM trend means longer vacancies and softer asking-rent achievability than the comps imply.
- What's the recent tenant-quality profile in this submarket — average credit score on applications, eviction rate, late-payment / NSF rate, and stable-employment percentage? A property-management company in the area should have these aggregated.
- How much new for-sale + rental construction is in the pipeline within 1–3 miles? Heavy new supply typically softens prices + rents 12–24 months out; constrained supply supports both.
Investment metrics
- 1% rule
- 0.65% ✗
- Cap rate
- 3.98%
- Cash-on-cash
- -8.25%
- DSCR
- 0.63
- GRM
- 12.8
CMA / ARV
- ARV (on-the-fly)
- $418,600
- Comps found
- 12
Show comp detail 12 sales within ~0.75 mi
| Address | Dist | Beds/Ba | Sqft | Sold | Price | $/sf | Match |
|---|---|---|---|---|---|---|---|
| 75767 Spoonbill Ln | 0.16mi | 4/3.0 | 2,006 (-4%) | 2mo | $412,500 | $206 | 84 |
| 75276 Pondside Ln | 0.28mi | 3/2.0 (-1) | 2,126 (+2%) | 2mo | $390,000 | $183 | 74 |
| 75315 Plumbago | 0.16mi | 4/2.0 | 1,811 (-14%) | 1mo | $387,500 | $214 | 65 |
| 75735 Bayley Pl | 0.52mi | 3/2.0 (-1) | 2,116 (+1%) | 2mo | $422,400 | $200 | 63 |
| 75713 Walking Path Ln | 0.61mi | 4/3.0 | 2,173 (+4%) | 3mo | $435,000 | $200 | 63 |
| 75631 Bayley Pl | 0.56mi | 3/2.0 (-1) | 2,116 (+1%) | 2mo | $409,350 | $193 | 62 |
| 75705 Walking Path Ln | 0.61mi | 4/3.0 | 2,226 (+6%) | 1mo | $459,980 | $207 | 60 |
| 75263 Weathersford Pl | 0.53mi | 4/3.0 | 2,288 (+9%) | 1mo | $440,000 | $192 | 59 |
| 75598 Banyan Way | 0.36mi | 4/3.0 | 2,390 (+14%) | 2mo | $469,290 | $196 | 58 |
| 75743 Bayley Pl | 0.52mi | 3/2.0 (-1) | 1,970 (-6%) | 3mo | $406,138 | $206 | 55 |
| 75791 Bayley Pl | 0.50mi | 4/3.0 | 2,390 (+14%) | 2mo | $461,780 | $193 | 51 |
| 75013 Pondside Ln | 0.62mi | 4/2.5 | 2,295 (+10%) | 3mo | $378,000 | $165 | 51 |
Match score weights: distance 35% · size 25% · config 20% · recency 20%. Top-matched comps best support the ARV.
Projected returns pro-forma
10.0% appreciation · 2.88% rent growth · sell at horizon
- IRR
- 18.4%
- Equity multiple
- 2.51×
- Total profit
- $179,112
- Equity at exit
- $382,874
- IRR
- 17.1%
- Equity multiple
- 5.77×
- Total profit
- $567,927
- Equity at exit
- $825,682
Cash invested: $119,000 (down + closing). Projections, not guarantees.
Landlord ↔ Tenant lean methodology
- Overall (STATE)
- 87 Strongly Landlord-Friendly
- State Florida
- 87 Strongly Landlord-Friendly · R+3
- County
- — inherits STATE
- City
- — inherits STATE
ZIP-level market 32097
- Home prices YoY
- 19.5%
- Rents YoY
- 2.9%
- Active inventory
- 601
- Price-to-rent
- 12.8×
Monthly cashflow live
- Estimated rent
- $2,773 high interval (Pro) →
- Mortgage (P&I)
- −$2,229
- Tax from tax record
- −$590 /mo · $7,081/yr
- Insurance
- −$177
- HOA
- −$13
- Vacancy / Maint / Mgmt
- −$582
- Net cashflow
- $-818
Break-even live
Sensitivity live
| Price | -10% $-578 | -5% $-698 | +0% $-818 | +5% $-938 | +10% $-1,059 |
|---|---|---|---|---|---|
| Rent | -10% $-1,037 | -5% $-928 | +0% $-818 | +5% $-709 | +10% $-599 |
| Rate | -1.0pp $-604 | -0.5pp $-710 | base $-818 | +0.5pp $-928 | +1.0pp $-1,040 |
UW: 25.0% down · 7.5% · 30yr · 1.5% tax · 5.0% vac · 8.0% maint · 8.0% mgmt
Financing live
Cash to close
- Down payment
- $106,250
- Closing costs
- $12,750
- Reserves months
- —
- Total cash needed
- —
Loan-product check · same deal, 3 products live
Conventional
25% down · 7.5% · 30yr
- Down + closing
- —
- Monthly P&I
- —
- Monthly cashflow
- —
- DSCR
- —
- Eligible?
- —
Personal DTI + credit; lowest rate.
DSCR
20% down · 8.5% · 30yr
- Down + closing
- —
- Monthly P&I
- —
- Monthly cashflow
- —
- DSCR
- —
- Eligible?
- —
No personal income docs; deal must DSCR.
Hard money
10% down · 12.0% · 12mo
- Down + closing
- —
- Monthly P&I
- —
- Monthly cashflow
- —
- DSCR
- —
- Eligible?
- —
Short-term bridge; refi at stabilization.
Rent comps 11 comps
| Address | Beds | Baths | Sqft | Rent | $/sqft | DOM | Units | Dist |
|---|---|---|---|---|---|---|---|---|
| 75470 Sunberry Dr Yulee, FL | 5.0 | 4.0 | 2903 | $3,150 | $1.09 | 21d | 1 | 0.32mi |
| 75094 Fern Creek Dr Yulee, FL | 4.0 | 2.0 | 2193 | $2,495 | $1.14 | 4d | 1 | 0.97mi |
| 75094 Glenspring Way Yulee, FL | 3.0 | 2.0 | 2055 | $2,500 | $1.22 | 25d | 1 | 1.06mi |
| 65013 Lagoon Forest Dr Yulee, FL | 4.0 | 2.5 | 2245 | $2,800 | $1.25 | 12d | 1 | 1.10mi |
| 76195 Deerwood Dr Yulee, FL | 4.0 | 2.5 | 2757 | $2,475 | $0.90 | 25d | 1 | 1.17mi |
| 75008 Morning Glen Ct Yulee, FL | 4.0 | 2.0 | 1856 | $2,300 | $1.24 | 25d | 1 | 1.20mi |
| 75045 Morning Glen Ct Yulee, FL | 3.0 | 2.0 | 1685 | $2,310 | $1.37 | 22d | 1 | 1.21mi |
| 75215 Fern Creek Dr Yulee, FL | 4.0 | 2.5 | 2898 | $2,900 | $1.00 | 16d | 1 | 1.21mi |
| 75075 Morning Glen Ct Yulee, FL | 4.0 | 2.0 | 1856 | $2,399 | $1.29 | 6d | 1 | 1.28mi |
| 75346 Bridgewater Dr Yulee, FL | 3.0 | 2.0 | 1711 | $2,300 | $1.34 | 25d | 1 | 1.40mi |
| 70305 Winding River Dr Yulee, FL | 4.0 | 3.0 | 2042 | $2,500 | $1.22 | 25d | 1 | 1.49mi |
HOA detail
- Monthly dues
- $13 · $156/yr
- Likely covers
- watergascable
Listing history 33 events
-
2026-06-21days on market $425,000 Active 419 DOM
-
2026-06-18days on market $425,000 Active 416 DOM
-
2026-06-17days on market $425,000 Active 415 DOM
-
2026-06-16days on market $425,000 Active 414 DOM
-
2026-06-15days on market $425,000 Active 413 DOM
-
2026-06-13days on market $425,000 Active 411 DOM
-
2026-06-13days on market $425,000 Active 410 DOM
-
2026-06-09pricedays on market $425,000 Active 407 DOM
-
2026-06-08days on market $409,000 Active 406 DOM
-
2026-06-07days on market $409,000 Active 405 DOM
-
2026-06-05days on market $409,000 Active 402 DOM
-
2026-06-03days on market $409,000 Active 401 DOM
-
2026-06-02days on market $409,000 Active 400 DOM
-
2026-06-01days on market $409,000 Active 399 DOM
-
2026-05-31days on market $409,000 Active 398 DOM
-
2026-03-19price $409,000
-
2026-03-03price $410,000
-
2026-02-10status Active
-
2026-02-10price $415,000
-
2025-11-06status Active
-
2025-11-06price $425,000
-
2025-07-18price $418,500
-
2025-07-06price $425,000
-
2025-06-22price $430,000
-
2025-06-09price $434,500
-
2025-05-15status Active
-
2025-03-23price $439,500
-
2025-03-05price $445,000
-
2025-01-19status Active
-
2024-11-27price $449,999
-
2024-11-16price $460,000
-
2024-11-04$474,900 Active
-
2020-09-22soldstatus $2,760,250
ⓘ Source: listings_history table (triggers on properties + properties_extension) + one-shot
backfill from property_details.listing_events for pre-trigger history.
Tax reassessment forecast FL · Resets to sale price
- Current annual tax
- $7,081 · $590/mo
- Projected year-2 tax
- $7,081 · $590/mo
- Expected delta
- $0/yr ($0/mo · 0.0%)
ⓘ Screening estimate from a state-policy table — verify with the county assessor before closing.
Climate risk First Street
- Flood 1/10 Low FEMA zone X (unshaded) · 0% chance over 30 yrs
- Wildfire 7/10 Severe
- Heat 9/10 Extreme 7 d/yr ≥107°F today · 20 d/yr by 30 yrs out
- Wind 9/10 Extreme 99% chance of damaging wind over 30 yrs
- Air quality 5/10 Major 8 unhealthy d/yr today · 10 by 30 yrs out
Nearby sold comps map
Loading sold comps map…
Walkable amenities ~0.75 mi
Loading nearby amenities…
Taxation est. · year 1
- Rental income
- $33,279
- − Mortgage interest
- −$23,807
- − Property taxes
- −$7,081
- − Insurance
- −$2,125
- − Repairs & maintenance
- −$2,662
- − Management
- −$2,662
- − HOA
- −$156
- − Depreciation
- −$12,364
- Taxable loss
- −$17,579
- Est. tax savings @ 24.0%
- +$4,219
- After-tax cash flow
- $-5,598/yr
For passive investors: Depreciation is non-cash, so a rental often shows a tax loss while cash-flowing — sheltering income. Rental losses are passive: they offset passive income freely, and up to $25,000/yr can offset ordinary (W-2) income if you actively participate and your MAGI is under $100k (phasing out to $0 by $150k); unused losses carry forward. On sale, claimed depreciation is recaptured at up to 25%, and gains may owe capital-gains tax (a 1031 exchange can defer both). Figures are a year-1 estimate at your 24.0% rate — not tax advice; consult a CPA.
Schools (NCES district)
- District
- Nassau
- NCES district ID
- 1201350
- Math proficiency
- 74% ▼ -2.00%
- Reading proficiency
- 65% ▼ -2.00%
- Median HH income
- $58,267
- Composite
- 59.79/100
- National rank
- #899
- State rank
- #4 of 73 in FL
Livability — Jacksonville
- Score
- 83/100
- State rank
- #50
- US rank
- #911
Category grades
Schools grade is shown separately in the Schools card above.
Census & demographics
- County
- Nassau County · 67,729 people
- City population
- 26,700
- Metro
- Jacksonville, FL
- Population (ZIP)
- 26,700
- Household income
- $93,161
- Rent vs Own
- Severe rent burden
- 404.0
Population outlook (Nassau County) Hauer SSP2
- Today (2025)
- 88,419 people
- By 2030
- 92,679 · +4.8%
- By 2040
- 99,257 · +12.3%
- By 2050
- 103,378 · +16.9%
- By 2075
- 109,726 · +24.1%
- By 2100
- 107,006 · +21.0%
Race, ethnicity, and origin ACS 2023
- Neighborhood character
- Predominantly White (75%)
- Race & ethnicity
- White 75% Two or more races 9% Black 9% Hispanic / Latino 8% Asian 1% Native American 1%
- Hispanic origin (detail)
- Mexican 2% Puerto Rican 2%
- Common ancestry
- Lithuanian 4% Italian 3% Romanian 2%
- Foreign-born
- 4% · Canada, Vietnam
- Languages at home
- 93% English-only · Spanish 5% Vietnamese 1%
Political lean MEDSL · Nassau
- 2024 margin
- Solid R (+46.9) · D 26.1% · R 73.1%
- 2008→2024 swing
- -3.1pp toward R · 2008: -43.8pp · 2024: -46.9pp
- All cycles
- 2024: R+46.9 2020: R+45.9 2016: R+50.2 2012: R+48.6 2008: R+43.8
Not yet ingested
- Civics
- —
Market trends
- HPI YoY
- ▲ 49.35%
- Current HPI
- 301.9299
- Rent YoY
- ▲ 2.88%
- Metro
- Jacksonville, FL
- State GDP YoY
- ▲ 3.28%
- F500 in state
- 36
Industry mix (Fortune 500 HQ in FL)
| Industry | F500 HQs | Revenue |
|---|---|---|
| Industrial Technology | 2 | $29B |
|
||
| Insurance | 2 | $17B |
|
||
| Retail | 1 | $60B |
|
||
| Technology Distribution | 1 | $58B |
|
||
| Homebuilding | 1 | $35B |
|
||
| Technology Manufacturing | 1 | $35B |
|
||
Price history
-85.2% since first listed18 events — show timeline
- 2026-03-19 Price Changed $409,000 AINCAR
- 2026-03-03 Price Changed $410,000 AINCAR
- 2026-02-10 Relisted — AINCAR
- 2026-02-10 Price Changed $415,000 AINCAR
- 2025-11-06 Relisted — AINCAR
- 2025-11-06 Price Changed $425,000 AINCAR
- 2025-07-18 Price Changed $418,500 AINCAR
- 2025-07-06 Price Changed $425,000 AINCAR
- 2025-06-22 Price Changed $430,000 AINCAR
- 2025-06-09 Price Changed $434,500 AINCAR
- 2025-05-15 Relisted — AINCAR
- 2025-03-23 Price Changed $439,500 AINCAR
- 2025-03-05 Price Changed $445,000 AINCAR
- 2025-01-19 Relisted — AINCAR
- 2024-11-27 Price Changed $449,999 AINCAR
- 2024-11-16 Price Changed $460,000 AINCAR
- 2024-11-04 Listed $474,900 AINCAR
- 2020-09-22 Sold (Public Records) $2,760,250 Public Records
Property tax history
+21.4%/yrLatest (2025): $7,081 · +0.8% YoY. Source: county tax records.
Cash-flow waterfall
monthlySold comps — $/sqft
last 12 mo · ≤1 miLoading sold comps…