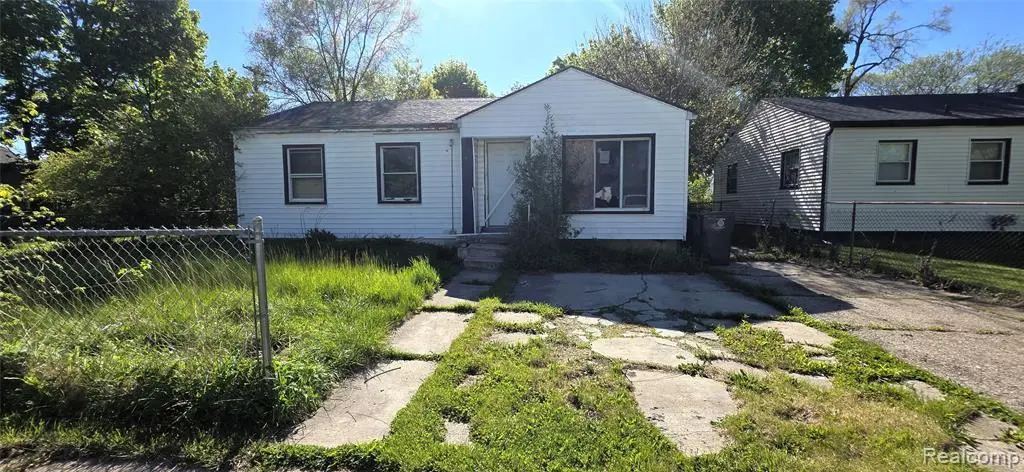
5309 Marja St · Flint, MI
Flood risk 3/10 · Minor
- FEMA flood zone
- X (unshaded)
- Chance of flooding over 30 yrs
- 0.2%
- Est. flood insurance / yr
- $473 – $860
Fire risk 1/10 · Minimal
- Est. fire insurance / yr
- $784 – $1,456
Heat risk 2/10 · Minimal
- Hot days now (above 96°F)
- 7 days/yr
- Hot days in 30 yrs
- 15 days/yr
Wind risk 2/10 · Minimal
- Chance of severe wind over 30 yrs
- —
Air-quality risk 2/10 · Minimal
- Unhealthy air days now
- 1 days/yr
- Unhealthy air days in 30 yrs
- 3 days/yr
Risk factors via First Street. Map © Google.
Why this score? — see what drove the D+ grade
The composite is a weighted blend of 9 inputs, each scored 0–100. Each bar is that input's sub-score; the figure is the points it added to the 100-point composite (weight × sub-score).
- Cash flow +15.0/30.0
- ARV discount +7.5/15.0
- Appreciation +6.3/10.0
- 1% rule +5.0/10.0
- DSCR +5.0/10.0
- Livability +3.7/5.0
- Rent growth +2.5/5.0
- Condition / age +2.5/5.0
- Schools +1.1/10.0
$14,900
🖨 Deal sheet 📄 Offer letter ✓ Due diligence
Listing remarks MLS
Investor special! 3 bedroom ranch with full basement on decent sized lot. Home needs work. big backyard. Fenced in area for dog. Sold as is.
Key facts
- Fenced in area
- Big backyard
- Full basement
Tags
Property features AI
Exterior
- Parking: No garage
- Utilities: Public water; Public sewer
- Home design: Single-family residence; One level; Ground-level entry with steps; Vinyl siding
- Construction: Block foundation
- Exterior features: Private maintained road access; Private road frontage; Lot approximately 0.12 acres (50 x 100)
Interior
- Bedrooms: Total of 5 rooms (bedrooms included)
- Bathrooms: 1 full bathroom
- Heating & cooling: Forced air heating; Natural gas heating; No central cooling
- Interior features: Unfinished basement
Neighborhood map
What this means for you Summary
Snapshot
- This is a 3-bed/1.0-bath single-family listed at $15k.
Deal economics
- At list price, monthly cash flow is $706 ($8k/yr) — positive.
- The deal already cash-flows at list — no discount required.
- Meets the 1% rule at list price ($1k rent vs $15k).
- Recommended offer: $15k (1.5% below list) — sets the bar for market timing.
- Cap rate 63.2% vs local median 11.5% in Flint — top-decile yield for the area; either an underpriced asset or a hidden risk that comps aren't pricing in. Stress-test before assuming the spread holds.
Location & tenants
- Location reads 74/100 on livability (#196 in MI, #4,946 nationally) — a middle-class / working-renter tenant base. Strengths: commute A+, cost of living A+, housing A+; Watch: schools F, crime F, employment F.
- Flint School District (urban): math 7% / reading 13% proficiency, ranked #714 of 760 in MI (top 94%) — low school quality limits family demand, transient renter base, plan for 1-2y turnover; 83% free/reduced lunch — lower-income household profile, screen leases tightly.
- Market conditions: 99 active listings in the ZIP; 8 comparable units currently listed for rent nearby; rentals leasing fast (median 14d on market — plan ~1-2 weeks tenant-placement turnaround); lower-income renter base — watch delinquency; 419 units permitted in Genesee County in 2024 (68 in 5+ unit buildings).
- This rent runs 37% of the median local income ($33k/yr) — at the standard rent-burdened threshold; future hikes will face affordability resistance.
Forward outlook
- In year one you build about $501 of equity ($103 loan paydown + $398 appreciation (2.7% local appreciation)).
- Genesee County population projected at -27% by 2050 — secular population decline; favor cash flow + early exit over multi-decade hold.
- At projected returns (2.7% appreciation + 3.0% rent growth), your $4k cash investment doubles in ~1 year — after that, you're playing with house money.
Negotiation context
- It's been on market 18 days — a 2% lower offer ($15k) is reasonable based on typical stale-listing flexibility.
- 10 sale attempts since 24y ago with the ask held roughly flat each time — persistent listings suggest the price (not the market) is what's stuck; bring a comps-based counter.
Risks & watch-outs
- Watch-outs: built in 1952 — expect roof / HVAC / electrical / plumbing capex.
Questions for the listing agent
- Built in 1952 — when were the roof, HVAC, electrical panel, plumbing, and water heater last replaced?
- Is there a deadline driving the sale (1031 exchange, divorce, estate, relocation)? That informs how much negotiation room exists.
- Schools are F-rated, which usually means shorter tenancies and higher turnover. Who's the typical renter profile here, and what's been the actual vacancy rate?
- Crime grade is F in this area — have there been break-ins, vandalism, or insurance claims at this property in the last 3 years? What carrier currently insures it and at what premium?
- The area grade is low — what's the realistic commute time and amenity access for the typical tenant pool here? Any planned neighborhood developments (good or bad) we should know about?
- What's the average days-on-market for RENTAL listings here right now (not sales)? A rising rental-DOM trend means longer vacancies and softer asking-rent achievability than the comps imply.
- What's the recent tenant-quality profile in this submarket — average credit score on applications, eviction rate, late-payment / NSF rate, and stable-employment percentage? A property-management company in the area should have these aggregated.
- How much new for-sale + rental construction is in the pipeline within 1–3 miles? Heavy new supply typically softens prices + rents 12–24 months out; constrained supply supports both.
Investment metrics
- 1% rule
- 6.87% ✓
- Cap rate
- 63.15%
- Cash-on-cash
- 203.07%
- DSCR
- 10.04
- GRM
- 1.2
CMA / ARV
- ARV (on-the-fly)
- $51,207
- Comps found
- 12
Show comp detail 12 sales within ~0.75 mi
| Address | Dist | Beds/Ba | Sqft | Sold | Price | $/sf | Match |
|---|---|---|---|---|---|---|---|
| 5705 Winthrop Blvd | 0.21mi | 3/1.0 | 1,375 (+5%) | 4mo | $55,000 | $40 | 79 |
| 5913 Glenn Ave | 0.34mi | 3/1.5 | 1,272 (-3%) | 4mo | $35,000 | $28 | 73 |
| 4911 Birchcrest Dr | 0.57mi | 3/2.0 | 1,310 (-0%) | 0mo | $30,000 | $23 | 69 |
| 1323 Chatham Dr | 0.51mi | 3/1.5 | 1,374 (+5%) | 2mo | $51,000 | $37 | 65 |
| 5714 Suburban Ct | 0.45mi | 3/1.0 | 1,426 (+9%) | 3mo | $63,500 | $45 | 62 |
| 5302 Susan St | 0.08mi | 2/1.0 (-1) | 1,508 (+15%) | 6mo | $53,000 | $35 | 62 |
| 609 W Marengo Ave | 0.48mi | 3/1.0 | 1,412 (+8%) | 7mo | $55,000 | $39 | 59 |
| 5709 Suburban Ct | 0.42mi | 3/1.5 | 1,440 (+10%) | 8mo | $74,900 | $52 | 56 |
| 606 Stewart Ave | 0.71mi | 3/2.0 | 1,375 (+5%) | 3mo | $5,000 | $4 | 53 |
| 6611 Sally Ct | 0.62mi | 3/1.0 | 1,120 (-15%) | 2mo | $21,420 | $19 | 45 |
| 6610 Cranwood Dr | 0.72mi | 3/2.0 | 1,452 (+11%) | 5mo | $78,000 | $54 | 41 |
| 618 W Austin Ave | 0.65mi | 4/1.5 (+1) | 1,500 (+14%) | 3mo | $85,900 | $57 | 37 |
Match score weights: distance 35% · size 25% · config 20% · recency 20%. Top-matched comps best support the ARV.
Projected returns pro-forma
2.67% appreciation · 3.0% rent growth · sell at horizon
- IRR
- —
- Equity multiple
- 12.15×
- Total profit
- $46,520
- Equity at exit
- $6,428
- IRR
- —
- Equity multiple
- 25.67×
- Total profit
- $102,936
- Equity at exit
- $9,700
Cash invested: $4,172 (down + closing). Projections, not guarantees.
Landlord ↔ Tenant lean methodology
- Overall (STATE)
- 62 Landlord-Friendly
- State Michigan
- 62 Landlord-Friendly · EVEN
- County
- — inherits STATE
- City
- — inherits STATE
ZIP-level market 48505
- Home prices YoY
- 1.3%
- Active inventory
- 99
- Price-to-rent
- 1.2×
Monthly cashflow live
- Estimated rent
- $1,024 high interval (Pro) →
- Mortgage (P&I)
- −$78
- Tax est. 1.5%
- −$19 /mo · $224/yr
- Insurance
- −$6
- HOA
- −$0
- Vacancy / Maint / Mgmt
- −$215
- Net cashflow
- $706
Break-even live
UW: 25.0% down · 7.5% · 30yr · 1.5% tax · 5.0% vac · 8.0% maint · 8.0% mgmt
Financing live
Cash to close
- Down payment
- $3,725
- Closing costs
- $447
- Reserves months
- —
- Total cash needed
- —
Loan-product check · same deal, 3 products live
Conventional
25% down · 7.5% · 30yr
- Down + closing
- —
- Monthly P&I
- —
- Monthly cashflow
- —
- DSCR
- —
- Eligible?
- —
Personal DTI + credit; lowest rate.
DSCR
20% down · 8.5% · 30yr
- Down + closing
- —
- Monthly P&I
- —
- Monthly cashflow
- —
- DSCR
- —
- Eligible?
- —
No personal income docs; deal must DSCR.
Hard money
10% down · 12.0% · 12mo
- Down + closing
- —
- Monthly P&I
- —
- Monthly cashflow
- —
- DSCR
- —
- Eligible?
- —
Short-term bridge; refi at stabilization.
Rent comps 8 comps
| Address | Beds | Baths | Sqft | Rent | $/sqft | DOM | Units | Dist |
|---|---|---|---|---|---|---|---|---|
| 5413 DuPont St Flint, MI | 4.0 | 1.5 | 1038 | $900 | $0.87 | 21d | 1 | 0.35mi |
| 5813 Edwards Ave Flint, MI | 3.0 | 1.0 | 1500 | $899 | $0.60 | 13d | 1 | 0.40mi |
| 5905 Griggs Dr Flint, MI | 3.0 | 1.0 | 940 | $1,000 | $1.06 | 13d | 1 | 0.42mi |
| 411 W Marengo Ave Flint, MI | 3.0 | 1.0 | 1350 | $1,072 | $0.79 | 13d | 1 | 0.63mi |
| 100 Rosewood Mnr Flint, MI | 2.0 | 1.5 | 1159 | $947 | $0.82 | 13d | 1 | 0.75mi |
| 6802 DuPont St Flint, MI | 3.0 | 1.0 | 1200 | $1,000 | $0.83 | 21d | 1 | 0.85mi |
| 514 W Alma Ave Flint, MI | 3.0 | 1.0 | 894 | $925 | $1.03 | 13d | 1 | 0.93mi |
| 711 W Dewey St Flint, MI | 3.0 | 1.0 | 1011 | $925 | $0.91 | 21d | 1 | 1.21mi |
Listing history 23 events
-
2026-06-03status $14,900 Pending 18 DOM
-
2026-06-02days on market $14,900 Active 18 DOM
-
2026-06-01days on market $14,900 Active 17 DOM
-
2026-05-31days on market $14,900 Active 16 DOM
-
2026-05-30days on market $14,900 Active 15 DOM
-
2026-05-15$14,900 Active 140-char remark
Show marketing remark (140 chars)
Investor special! 3 bedroom ranch with full basement on decent sized lot. Home needs work. big backyard. Fenced in area for dog. Sold as is.
-
2026-05-15$14,900 Active
Show marketing remark (140 chars)
Investor special! 3 bedroom ranch with full basement on decent sized lot. Home needs work. big backyard. Fenced in area for dog. Sold as is.
-
2015-04-23historical
-
2015-04-21historical
-
2015-03-03$7,000
-
2015-03-03$7,000
-
2010-12-06historical
-
2010-12-06historical
-
2010-12-03historical
-
2009-03-24historical
-
2008-09-24$45,500
-
2008-09-24$45,500
-
2004-02-22historical
-
2003-08-25$52,300
-
2003-08-25$52,300
-
2003-06-12historical
-
2002-11-12$57,900
-
2002-11-12$57,900
ⓘ Source: listings_history table (triggers on properties + properties_extension) + one-shot
backfill from property_details.listing_events for pre-trigger history.
Climate risk First Street
- Flood 3/10 Moderate FEMA zone X (unshaded) · 20% chance over 30 yrs
- Wildfire 1/10 Low
- Heat 2/10 Low 7 d/yr ≥96°F today · 15 d/yr by 30 yrs out
- Wind 2/10 Low
- Air quality 2/10 Low 1 unhealthy d/yr today · 3 by 30 yrs out
Nearby sold comps map
Loading sold comps map…
Walkable amenities ~0.75 mi
Loading nearby amenities…
Taxation est. · year 1
- Rental income
- $12,288
- − Mortgage interest
- −$835
- − Property taxes
- −$224
- − Insurance
- −$74
- − Repairs & maintenance
- −$983
- − Management
- −$983
- − Depreciation
- −$433
- Taxable income
- $8,756
- Est. tax owed @ 24.0%
- −$2,101
- After-tax cash flow
- $6,371/yr
For passive investors: Depreciation is non-cash, so a rental often shows a tax loss while cash-flowing — sheltering income. Rental losses are passive: they offset passive income freely, and up to $25,000/yr can offset ordinary (W-2) income if you actively participate and your MAGI is under $100k (phasing out to $0 by $150k); unused losses carry forward. On sale, claimed depreciation is recaptured at up to 25%, and gains may owe capital-gains tax (a 1031 exchange can defer both). Figures are a year-1 estimate at your 24.0% rate — not tax advice; consult a CPA.
Schools (NCES district)
- District
- Flint School District
- NCES district ID
- 2614520
- Math proficiency
- 7% ▬ 0.00%
- Reading proficiency
- 13% ▲ 3.00%
- Median HH income
- $25,954
- Composite
- 10.97/100
- National rank
- #14642
- State rank
- #714 of 760 in MI
Livability — Flint
- Score
- 74/100
- State rank
- #196
- US rank
- #4946
Category grades
Schools grade is shown separately in the Schools card above.
Census & demographics
- Census place
- Flint, MI
- County
- Genesee County · 221,329 people
- City population
- 93,814
- Metro
- Flint, MI
- Population (ZIP)
- 18,032
- Household income
- $33,283
- Rent vs Own
- Severe rent burden
- 960.0
Population outlook (Genesee County) Hauer SSP2
- Today (2025)
- 381,312 people
- By 2030
- 362,731 · -4.9%
- By 2040
- 321,550 · -15.7%
- By 2050
- 279,212 · -26.8%
- By 2075
- 193,336 · -49.3%
- By 2100
- 128,118 · -66.4%
Race, ethnicity, and origin ACS 2023
- Neighborhood character
- Predominantly Black (79%)
- Race & ethnicity
- Black 79% White 11% Two or more races 6% Hispanic / Latino 3%
- Common ancestry
- Romanian 1% Iranian 1% Lithuanian 1%
- Foreign-born
- 1% · Canada
- Languages at home
- 98% English-only · Spanish 1%
Political lean MEDSL · Genesee
- 2024 margin
- Toss-up / Even · D 51.4% · R 47.2% · Other 1.4%
- 2008→2024 swing
- -28.3pp toward R · 2008: 32.5pp · 2024: 4.2pp
- All cycles
- 2024: D+4.2 2020: D+9.3 2016: D+9.5 2012: D+28.2 2008: D+32.5
Not yet ingested
- Civics
- —
Market trends
- HPI YoY
- ▲ 2.67%
- Current HPI
- 202.4878
- Rent YoY
- —
- Metro
- Flint, MI
- State GDP YoY
- ▲ 1.37%
- F500 in state
- 28
Industry mix (Fortune 500 HQ in MI)
| Industry | F500 HQs | Revenue |
|---|---|---|
| Automotive Parts | 3 | $48B |
|
||
| Automotive | 2 | $372B |
|
||
| Chemicals | 1 | $45B |
|
||
| Automotive Retail | 1 | $29B |
|
||
| Healthcare / Medical Devices | 1 | $23B |
|
||
| Automotive Technology | 1 | $20B |
|
||
Price history
-74.3% since first listed18 events — show timeline
- 2026-05-15 Listed $14,900 REALCOMP
- 2026-05-15 Listed $14,900 MiRealSource-MiMLS
- 2015-04-23 Listing Removed — MiRealSource-MiMLS
- 2015-04-21 Listing Removed — REALCOMP
- 2015-03-03 Listed $7,000 MiRealSource-MiMLS
- 2015-03-03 Listed $7,000 REALCOMP
- 2010-12-06 Listing Removed — REALCOMP
- 2010-12-06 Listing Removed — REALCOMP
- 2010-12-03 Listing Removed — REALCOMP
- 2009-03-24 Listing Removed — MiRealSource-MiMLS
- 2008-09-24 Listed $45,500 MiRealSource-MiMLS
- 2008-09-24 Listed $45,500 REALCOMP
- 2004-02-22 Listing Removed — MiRealSource-MiMLS
- 2003-08-25 Listed $52,300 MiRealSource-MiMLS
- 2003-08-25 Listed $52,300 REALCOMP
- 2003-06-12 Listing Removed — MiRealSource-MiMLS
- 2002-11-12 Listed $57,900 MiRealSource-MiMLS
- 2002-11-12 Listed $57,900 REALCOMP
Property tax history
+3.3%/yrLatest (2025): $1,163 · +1.7% YoY. Source: county tax records.
Cash-flow waterfall
monthlySold comps — $/sqft
last 12 mo · ≤1 miLoading sold comps…