5155 Harper Rd · Solon, OH
Flood risk 1/10 · Minimal
- FEMA flood zone
- X (unshaded)
- Chance of flooding over 30 yrs
- 0.0%
- Est. flood insurance / yr
- $473 – $860
Fire risk 1/10 · Minimal
- Est. fire insurance / yr
- $713 – $1,323
Heat risk 2/10 · Minimal
- Hot days now (above 94°F)
- 6 days/yr
- Hot days in 30 yrs
- 14 days/yr
Wind risk 1/10 · Minimal
- Chance of severe wind over 30 yrs
- —
Air-quality risk 3/10 · Minor
- Unhealthy air days now
- 2 days/yr
- Unhealthy air days in 30 yrs
- 4 days/yr
Risk factors via First Street. Map © Google.
Why this score? — see what drove the C+ grade
The composite is a weighted blend of 9 inputs, each scored 0–100. Each bar is that input's sub-score; the figure is the points it added to the 100-point composite (weight × sub-score).
- Cash flow +22.8/30.0
- Schools +8.1/10.0
- ARV discount +7.5/15.0
- DSCR +7.3/10.0
- 1% rule +7.1/10.0
- Livability +4.5/5.0
- Rent growth +2.5/5.0
- Condition / age +2.5/5.0
- Appreciation +0.0/10.0
$165,000
🖨 Deal sheet 📄 Offer letter ✓ Due diligence
Listing remarks
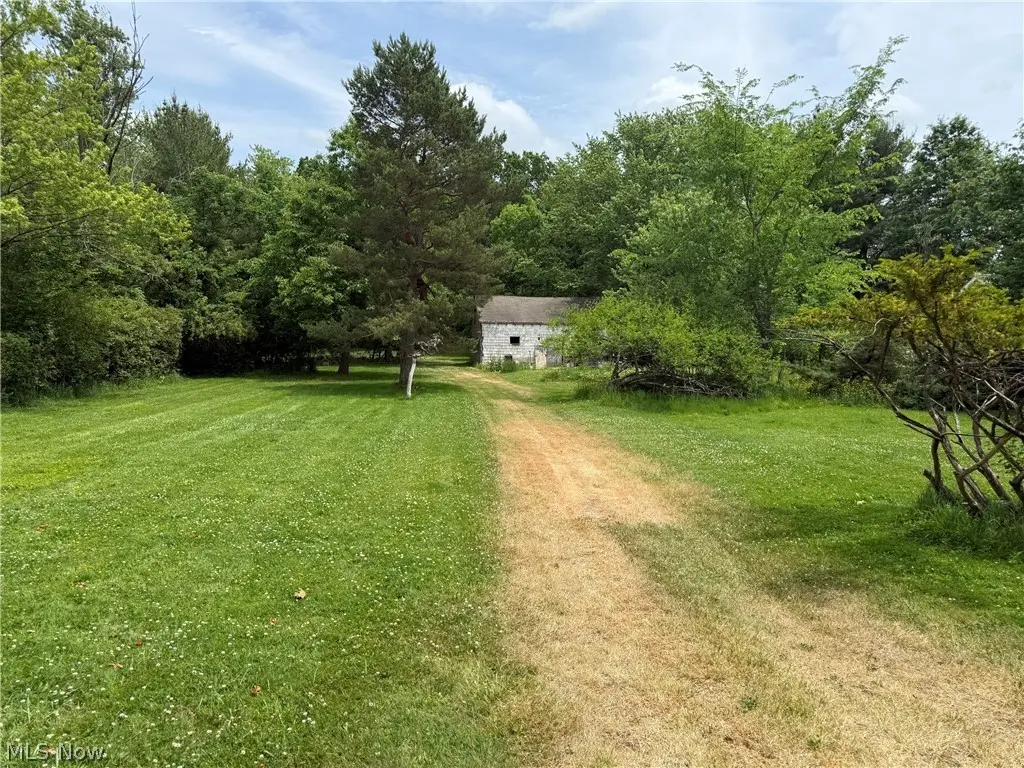
Rare opportunity in Solon with over 4.5 acres, an existing barn, and a 2-bedroom, 1-bath ranch ready for its next chapter. This is not a move-in ready home. The house needs a full clean-out and full rehab, so bring your contractor, builder, investor mindset, or renovation vision. The value here is in the land, setting, utilities, existing structures, and flexibility. The home offers approximately 1,025 sq ft, plus a full unfinished basement, attached garage, enclosed porch, deck, hardwood floors, plaster walls, public water, public sewer, and forced-air heat. The lot is flat and deep, with approximately 116 feet of frontage and nearly 1,700 feet of depth, creating a private setting that is
Key facts
- Existing barn
- Plaster walls
- Over 4.5 acres
Tags
Property features AI
Finance
- HOA & community: Suburban neighborhood with street lights; Nearby amenities include medical services, playgrounds, parks, restaurants and shopping
Exterior
- Parking: Driveway; Attached or detached 1-car garage
- Utilities: Public water; Public sewer
- Home design: Single-story; Faces west; Ranch-style entry (single level)
- Construction: Wood siding; Asphalt/fiberglass roof; Block foundation; Built according to public records
- Exterior features: Private yard; Back yard; Enclosed patio/porch; Patio; Porch; Barn(s)
Interior
- Kitchen: Range; Refrigerator
- Bedrooms: 2 main-level bedrooms
- Bathrooms: 1 full bathroom (main level)
- Heating & cooling: Forced-air heating
- Interior features: Fixer condition; Unfinished basement
- Laundry & utility: Laundry in basement
Neighborhood map
What this means for you Summary
Snapshot
- This is a 2-bed/1.0-bath single-family listed at $165k.
Deal economics
- At list price, monthly cash flow is $288 ($3k/yr) — positive.
- The deal already cash-flows at list — no discount required.
- Meets the 1% rule at list price ($2k rent vs $165k).
- Cap rate 8.4% vs local median 2.3% in Solon — top-decile yield for the area; either an underpriced asset or a hidden risk that comps aren't pricing in. Stress-test before assuming the spread holds.
Location & tenants
- Location reads 91/100 on livability (#5 in OH, #42 nationally) — a professional / high-income tenant draw. Strengths: schools A+, crime A+, amenities A+.
- Solon City (suburban): math 89% / reading 93% proficiency, ranked #1 of 656 in OH (top 0%) — strong family-tenant draw, lease renewals of 3-5y typical; only 9% free/reduced lunch — higher-income household profile.
- Market conditions: 101 active listings in the ZIP; high-income renter base; 1,441 units permitted in Cuyahoga County in 2024 (700 in 5+ unit buildings).
- This rent is only 17% of the median local income ($138k/yr) — well below the 30% rent-burden line; pricing power to push rent on renewal without tenant pushback.
Forward outlook
- Local home prices are declining (-3.0%/yr); year-one equity from $1k of loan paydown is wiped out by about $5k of value loss. Plan a longer hold.
- Cuyahoga County population projected to shrink 8% by 2050 — rents likely to lag national; underwrite the cash flow, not the appreciation.
Negotiation context
- Only 6 days on market — expect competitive offers; lowballing is unlikely to land.
Risks & watch-outs
- Watch-outs: property tax is 2.5% of price; built in 1930 — expect roof / HVAC / electrical / plumbing capex.
Questions for the listing agent
- Built in 1930 — when were the roof, HVAC, electrical panel, plumbing, and water heater last replaced?
- Property tax is high relative to price — has the assessment been appealed recently, and will the sale trigger a re-assessment?
- Is there a deadline driving the sale (1031 exchange, divorce, estate, relocation)? That informs how much negotiation room exists.
- Schools are A-rated — typically a magnet for longer-tenancy family renters. What's the average tenant stay here, and is there a school-zone premium baked into asking?
- What's the average days-on-market for RENTAL listings here right now (not sales)? A rising rental-DOM trend means longer vacancies and softer asking-rent achievability than the comps imply.
- What's the recent tenant-quality profile in this submarket — average credit score on applications, eviction rate, late-payment / NSF rate, and stable-employment percentage? A property-management company in the area should have these aggregated.
- How much new for-sale + rental construction is in the pipeline within 1–3 miles? Heavy new supply typically softens prices + rents 12–24 months out; constrained supply supports both.
Investment metrics
- 1% rule
- 1.21% ✓
- Cap rate
- 8.39%
- Cash-on-cash
- 7.48%
- DSCR
- 1.33
- GRM
- 6.9
CMA / ARV
No comps found within radius.
Projected returns pro-forma
-3.0% appreciation · 3.0% rent growth · sell at horizon
- IRR
- -4.8%
- Equity multiple
- 0.82×
- Total profit
- $-8,265
- Equity at exit
- $24,602
- IRR
- 5.0%
- Equity multiple
- 1.37×
- Total profit
- $16,918
- Equity at exit
- $14,266
Cash invested: $46,200 (down + closing). Projections, not guarantees.
Landlord ↔ Tenant lean methodology
- Overall (STATE)
- 73 Landlord-Friendly
- State Ohio
- 73 Landlord-Friendly · R+6
- County
- — inherits STATE
- City
- — inherits STATE
ZIP-level market 44139
- Active inventory
- 101
- Price-to-rent
- 6.9×
Monthly cashflow live
- Estimated rent
- $1,991 medium interval (Pro) →
- Mortgage (P&I)
- −$865
- Tax from tax record
- −$350 /mo · $4,204/yr
- Insurance
- −$69
- HOA
- −$0
- Vacancy / Maint / Mgmt
- −$418
- Net cashflow
- $288
Break-even live
UW: 25.0% down · 7.5% · 30yr · 1.5% tax · 5.0% vac · 8.0% maint · 8.0% mgmt
Financing live
Cash to close
- Down payment
- $41,250
- Closing costs
- $4,950
- Reserves months
- —
- Total cash needed
- —
Loan-product check · same deal, 3 products live
Conventional
25% down · 7.5% · 30yr
- Down + closing
- —
- Monthly P&I
- —
- Monthly cashflow
- —
- DSCR
- —
- Eligible?
- —
Personal DTI + credit; lowest rate.
DSCR
20% down · 8.5% · 30yr
- Down + closing
- —
- Monthly P&I
- —
- Monthly cashflow
- —
- DSCR
- —
- Eligible?
- —
No personal income docs; deal must DSCR.
Hard money
10% down · 12.0% · 12mo
- Down + closing
- —
- Monthly P&I
- —
- Monthly cashflow
- —
- DSCR
- —
- Eligible?
- —
Short-term bridge; refi at stabilization.
Listing history 6 events
-
2026-06-18days on market $165,000 Active 6 DOM
-
2026-06-17days on market $165,000 Active 5 DOM
-
2026-06-16days on market $165,000 Active 4 DOM
-
2026-06-15days on market $165,000 Active 3 DOM
-
2026-06-13remarks 699-char remark
-
2026-06-13$165,000 Active 1 DOM
ⓘ Source: listings_history table (triggers on properties + properties_extension) + one-shot
backfill from property_details.listing_events for pre-trigger history.
Tax reassessment forecast OH · Partial reset (capped growth)
- Current annual tax
- $4,204 · $350/mo
- Projected year-2 tax
- $4,204 · $350/mo
- Expected delta
- $0/yr ($0/mo · 0.0%)
ⓘ Screening estimate from a state-policy table — verify with the county assessor before closing.
Climate risk First Street
- Flood 1/10 Low FEMA zone X (unshaded) · 0% chance over 30 yrs
- Wildfire 1/10 Low
- Heat 2/10 Low 6 d/yr ≥94°F today · 14 d/yr by 30 yrs out
- Wind 1/10 Low
- Air quality 3/10 Moderate 2 unhealthy d/yr today · 4 by 30 yrs out
Nearby sold comps map
Loading sold comps map…
Walkable amenities ~0.75 mi
Loading nearby amenities…
Taxation est. · year 1
- Rental income
- $23,886
- − Mortgage interest
- −$9,243
- − Property taxes
- −$4,204
- − Insurance
- −$825
- − Repairs & maintenance
- −$1,911
- − Management
- −$1,911
- − Depreciation
- −$4,800
- Taxable income
- $993
- Est. tax owed @ 24.0%
- −$238
- After-tax cash flow
- $3,220/yr
For passive investors: Depreciation is non-cash, so a rental often shows a tax loss while cash-flowing — sheltering income. Rental losses are passive: they offset passive income freely, and up to $25,000/yr can offset ordinary (W-2) income if you actively participate and your MAGI is under $100k (phasing out to $0 by $150k); unused losses carry forward. On sale, claimed depreciation is recaptured at up to 25%, and gains may owe capital-gains tax (a 1031 exchange can defer both). Figures are a year-1 estimate at your 24.0% rate — not tax advice; consult a CPA.
Schools (NCES district)
- District
- Solon City
- NCES district ID
- 3904660
- Math proficiency
- 89% ▼ -7.00%
- Reading proficiency
- 93% ▼ -1.00%
- Median HH income
- $95,909
- Composite
- 81.16/100
- National rank
- #42
- State rank
- #1 of 656 in OH
Livability — Solon
- Score
- 91/100
- State rank
- #5
- US rank
- #42
Category grades
Schools grade is shown separately in the Schools card above.
Census & demographics
- Census place
- Solon, OH
- County
- Cuyahoga County · 1,090,369 people
- City population
- 24,706
- Metro
- Cleveland-Elyria, OH
- Population (ZIP)
- 24,706
- Household income
- $138,425
- Rent vs Own
- Severe rent burden
- 368.0
Population outlook (Cuyahoga County) Hauer SSP2
- Today (2025)
- 1,244,621 people
- By 2030
- 1,230,093 · -1.2%
- By 2040
- 1,189,108 · -4.5%
- By 2050
- 1,145,706 · -7.9%
- By 2075
- 1,076,557 · -13.5%
- By 2100
- 978,987 · -21.3%
Race, ethnicity, and origin ACS 2023
- Neighborhood character
- Majority White (65%)
- Race & ethnicity
- White 65% Asian 14% Black 12% Two or more races 7% Hispanic / Latino 3%
- Common ancestry
- Romanian 6% Scotch-Irish 3% Italian 2%
- Foreign-born
- 18% · China, Canada, Vietnam
- Languages at home
- 77% English-only · Chinese 6% Russian/Polish/Slavic 5% Other Indo-European 4%
Political lean MEDSL · Cuyahoga
- 2024 margin
- Solid D (+31.5) · D 65.4% · R 33.9%
- 2008→2024 swing
- -7.4pp toward R · 2008: 38.9pp · 2024: 31.5pp
- All cycles
- 2024: D+31.5 2020: D+34.1 2016: D+35.0 2012: D+38.7 2008: D+38.9
Not yet ingested
- Civics
- —
Market trends
- HPI YoY
- ▼ -196.10%
- Current HPI
- 191.8418
- Rent YoY
- —
- Metro
- Cleveland-Elyria, OH
- State GDP YoY
- ▲ 1.98%
- F500 in state
- 48
Industry mix (Fortune 500 HQ in OH)
| Industry | F500 HQs | Revenue |
|---|---|---|
| Insurance | 3 | $145B |
|
||
| Industrial Machinery | 3 | $49B |
|
||
| Financial Services | 3 | $24B |
|
||
| Consumer Goods | 2 | $93B |
|
||
| Aerospace / Defense | 2 | $47B |
|
||
| Utilities | 2 | $33B |
|
||
Price history
1 event — show timeline
- 2026-06-12 Listed $165,000 MLSNOW
Property tax history
+3.7%/yrLatest (2025): $4,204 · +0.0% YoY. Source: county tax records.
Cash-flow waterfall
monthlySold comps — $/sqft
last 12 mo · ≤1 miLoading sold comps…