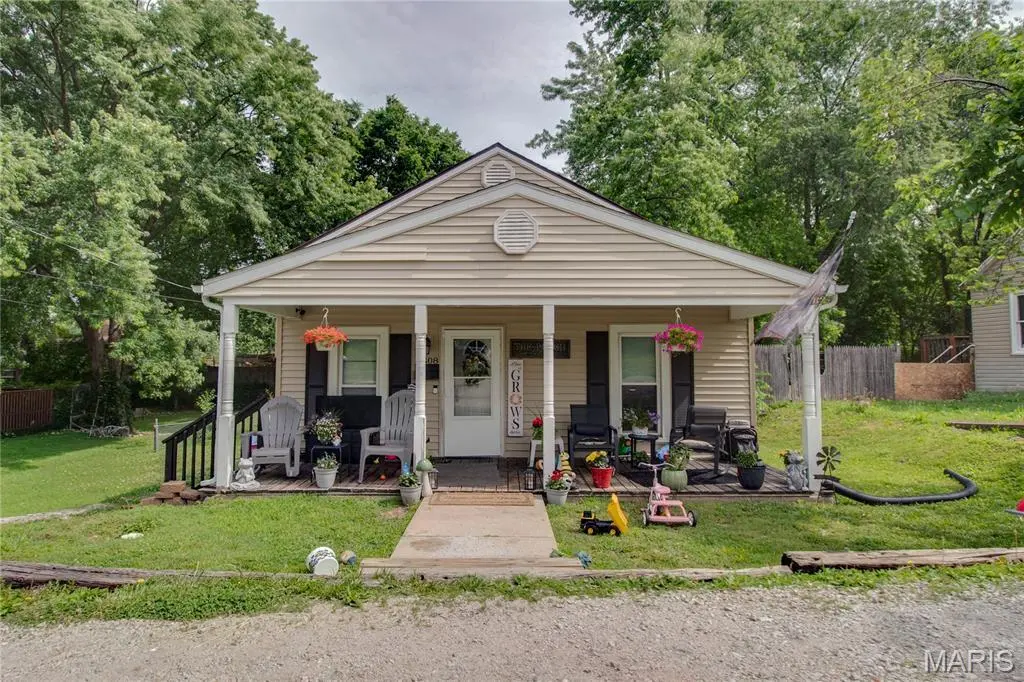
3308 Fernwood Ave · Alton, IL
Flood risk 1/10 · Minimal
- FEMA flood zone
- X
- Chance of flooding over 30 yrs
- 0.0%
- Est. flood insurance / yr
- $473 – $860
Fire risk 1/10 · Minimal
- Est. fire insurance / yr
- $804 – $1,492
Heat risk 5/10 · Moderate
- Hot days now (above 106°F)
- 7 days/yr
- Hot days in 30 yrs
- 20 days/yr
Wind risk 2/10 · Minimal
- Chance of severe wind over 30 yrs
- 1.0%
Air-quality risk 3/10 · Minor
- Unhealthy air days now
- 2 days/yr
- Unhealthy air days in 30 yrs
- 4 days/yr
Risk factors via First Street. Map © Google.
Why this score? — see what drove the B- grade
The composite is a weighted blend of 9 inputs, each scored 0–100. Each bar is that input's sub-score; the figure is the points it added to the 100-point composite (weight × sub-score).
- Cash flow +25.4/30.0
- ARV discount +15.0/15.0
- DSCR +8.4/10.0
- 1% rule +7.4/10.0
- Rent growth +4.6/5.0
- Livability +3.2/5.0
- Condition / age +2.5/5.0
- Schools +1.1/10.0
- Appreciation +0.0/10.0
$109,000
🖨 Deal sheet 📄 Offer letter ✓ Due diligence
Listing remarks
Come take a look at this 4 bed 1 bath home in the Milton area of Alton. This home offers an inviting entry under a covered porch, updated kitchen with ample cabinet space, four main floor bedrooms, a spacious basement , all located on a good sized lot with a nice backyard. Great opportunity to own a four bedroom home in this price range. Make your appointment today.
Key facts
- 7,200 sq ft lot
- Built 1946
- Listed 14 days
Property features AI
Exterior
- Utilities: Public water; Public sewer; Single-phase electric; Electricity connected; Natural gas connected
- Home design: Single-family residence; One level
- Construction: Vinyl siding
- Exterior features: Covered patio or porch; Deck; Front porch; Back yard
Interior
- Kitchen: Kitchen on the main level
- Bedrooms: Three bedrooms on the main level
- Bathrooms: One full bathroom on the main level
- Heating & cooling: Forced air heating (natural gas); Central air conditioning
- Interior features: Living room; Full unfinished basement
Neighborhood map
What this means for you Summary
Snapshot
- This is a 4-bed/1.0-bath single-family listed at $109k.
Deal economics
- At list price, monthly cash flow is $250 ($3k/yr) — positive.
- The deal already cash-flows at list — no discount required.
- Meets the 1% rule at list price ($1k rent vs $109k).
- Recommended offer: $107k (1.5% below list) — sets the bar for market timing.
- Cap rate 9.0% vs local median 6.4% in Alton — top-decile yield for the area; either an underpriced asset or a hidden risk that comps aren't pricing in. Stress-test before assuming the spread holds.
Location & tenants
- Location reads 64/100 on livability (#701 in IL) — a middle-class / working-renter tenant base. Strengths: cost of living A+, housing A; Watch: health & safety C-, crime F, amenities D-.
- Alton CUSD 11 (suburban): math 12% / reading 13% proficiency, ranked #544 of 620 in IL (top 88%) — low school quality limits family demand, transient renter base, plan for 1-2y turnover; 60% free/reduced lunch — lower-income household profile, screen leases tightly.
- Zoned schools: Alton High School (math 20% / reading 25%, grade F, #317 of 693 statewide, top 46%, 1,990 students, 0% FRL) — zoned schools average 0% FRL vs 60% district-wide (60 pts lower); this property's tenant base skews higher-income than the district average.
- Market conditions: Rents rising fast (+8.2%/yr); 169 active listings in the ZIP; 2 comparable units currently listed for rent nearby; 336 units permitted in Madison County in 2024 (0 in 5+ unit buildings).
Forward outlook
- Local home prices are declining (-3.0%/yr); year-one equity from $754 of loan paydown is wiped out by about $3k of value loss. Plan a longer hold.
- Madison County population projected at -18% by 2050 — secular population decline; favor cash flow + early exit over multi-decade hold.
- At projected returns (-3.0% appreciation + 8.0% rent growth), your $31k cash investment doubles in ~8 years — after that, you're playing with house money.
Negotiation context
- It's been on market 15 days — a 2% lower offer ($107k) is reasonable based on typical stale-listing flexibility.
- Current owner paid $84k; 31% above their basis — modest negotiation headroom, anchor on the comps not their cost.
Risks & watch-outs
- Watch-outs: built in 1946 — expect roof / HVAC / electrical / plumbing capex.
- Climate carrying-cost: extreme-heat days projected 7→20/yr by 2055 (HVAC capex compounding) — expect insurance premiums to compound above CPI over the hold.
Questions for the listing agent
- Built in 1946 — when were the roof, HVAC, electrical panel, plumbing, and water heater last replaced?
- Is there a deadline driving the sale (1031 exchange, divorce, estate, relocation)? That informs how much negotiation room exists.
- Schools are F-rated, which usually means shorter tenancies and higher turnover. Who's the typical renter profile here, and what's been the actual vacancy rate?
- Crime grade is F in this area — have there been break-ins, vandalism, or insurance claims at this property in the last 3 years? What carrier currently insures it and at what premium?
- What's the average days-on-market for RENTAL listings here right now (not sales)? A rising rental-DOM trend means longer vacancies and softer asking-rent achievability than the comps imply.
- What's the recent tenant-quality profile in this submarket — average credit score on applications, eviction rate, late-payment / NSF rate, and stable-employment percentage? A property-management company in the area should have these aggregated.
- How much new for-sale + rental construction is in the pipeline within 1–3 miles? Heavy new supply typically softens prices + rents 12–24 months out; constrained supply supports both.
Investment metrics
- 1% rule
- 1.24% ✓
- Cap rate
- 9.04%
- Cash-on-cash
- 9.83%
- DSCR
- 1.44
- GRM
- 6.7
CMA / ARV
- ARV (on-the-fly)
- $139,236
- Comps found
- 12
Show comp detail 12 sales within ~0.75 mi
| Address | Dist | Beds/Ba | Sqft | Sold | Price | $/sf | Match |
|---|---|---|---|---|---|---|---|
| 3305 Fernwood Ave | 0.03mi | 3/1.0 (-1) | 1,196 (+6%) | 2mo | $109,000 | $91 | 83 |
| 1416 Milton Rd | 0.09mi | 4/2.0 | 1,026 (-9%) | 2mo | $65,000 | $63 | 74 |
| 1629 S Rodgers Ave | 0.31mi | 3/1.0 (-1) | 1,093 (-3%) | 3mo | $40,000 | $37 | 73 |
| 1407 Doerr Ave | 0.41mi | 3/2.0 (-1) | 1,131 (-0%) | 2mo | $139,500 | $123 | 70 |
| 223 Michigan Ave | 0.22mi | 3/2.0 (-1) | 1,077 (-5%) | 5mo | $167,500 | $156 | 69 |
| 3707 Coronado Dr | 0.67mi | 4/1.0 | 1,137 (+0%) | 3mo | $139,900 | $123 | 65 |
| 3410 Bolivar St | 0.34mi | 3/2.0 (-1) | 1,100 (-3%) | 7mo | $145,000 | $132 | 65 |
| 1516 Spaulding St | 0.39mi | 3/1.5 (-1) | 1,218 (+8%) | 6mo | $115,000 | $94 | 57 |
| 206 Longfellow Ave | 0.72mi | 3/2.0 (-1) | 1,092 (-4%) | 4mo | $184,900 | $169 | 48 |
| 2926 Werges Ave | 0.51mi | 3/2.0 (-1) | 1,206 (+6%) | 11mo | $125,000 | $104 | 47 |
| 2616 Hillcrest Ave | 0.55mi | 3/2.0 (-1) | 1,215 (+7%) | 9mo | $172,900 | $142 | 46 |
| 2933 Forest Dr | 0.65mi | 3/3.0 (-1) | 1,300 (+15%) | 7mo | $169,999 | $131 | 26 |
Match score weights: distance 35% · size 25% · config 20% · recency 20%. Top-matched comps best support the ARV.
Projected returns pro-forma
-3.0% appreciation · 8.0% rent growth · sell at horizon
- IRR
- 4.3%
- Equity multiple
- 1.18×
- Total profit
- $5,438
- Equity at exit
- $16,252
- IRR
- 18.3%
- Equity multiple
- 2.90×
- Total profit
- $57,889
- Equity at exit
- $9,424
Cash invested: $30,520 (down + closing). Projections, not guarantees.
Landlord ↔ Tenant lean methodology
- Overall (STATE)
- 43 Moderately Tenant-Leaning
- State Illinois
- 43 Moderately Tenant-Leaning · D+7
- County
- — inherits STATE
- City
- — inherits STATE
ZIP-level market 62002
- Home prices YoY
- -33.6%
- Rents YoY
- 8.2%
- Active inventory
- 169
- Price-to-rent
- 6.7×
Monthly cashflow live
- Estimated rent
- $1,348 medium interval (Pro) →
- Mortgage (P&I)
- −$572
- Tax from tax record
- −$198 /mo · $2,373/yr
- Insurance
- −$45
- HOA
- −$0
- Vacancy / Maint / Mgmt
- −$283
- Net cashflow
- $250
Break-even live
UW: 25.0% down · 7.5% · 30yr · 1.5% tax · 5.0% vac · 8.0% maint · 8.0% mgmt
Financing live
Cash to close
- Down payment
- $27,250
- Closing costs
- $3,270
- Reserves months
- —
- Total cash needed
- —
Loan-product check · same deal, 3 products live
Conventional
25% down · 7.5% · 30yr
- Down + closing
- —
- Monthly P&I
- —
- Monthly cashflow
- —
- DSCR
- —
- Eligible?
- —
Personal DTI + credit; lowest rate.
DSCR
20% down · 8.5% · 30yr
- Down + closing
- —
- Monthly P&I
- —
- Monthly cashflow
- —
- DSCR
- —
- Eligible?
- —
No personal income docs; deal must DSCR.
Hard money
10% down · 12.0% · 12mo
- Down + closing
- —
- Monthly P&I
- —
- Monthly cashflow
- —
- DSCR
- —
- Eligible?
- —
Short-term bridge; refi at stabilization.
Rent comps 2 comps
| Address | Beds | Baths | Sqft | Rent | $/sqft | DOM | Units | Dist |
|---|---|---|---|---|---|---|---|---|
| 2222 Brown St Alton, IL | 4.0 | 2.0 | 1025 | $1,050 | $1.02 | 8d | 1 | 0.84mi |
| 2016 Salu St Alton, IL | 3.0 | 1.0 | 1073 | $1,100 | $1.03 | 16d | 1 | 1.48mi |
Listing history 11 events
-
2026-06-18days on market $109,000 Active 15 DOM
-
2026-06-17days on market $109,000 Active 14 DOM
-
2026-06-16days on market $109,000 Active 13 DOM
-
2026-06-15days on market $109,000 Active 12 DOM
-
2026-06-13days on market $109,000 Active 10 DOM
-
2026-06-09days on market $109,000 Active 6 DOM
-
2026-06-08days on market $109,000 Active 5 DOM
-
2026-06-07remarks 368-char remark
-
2026-06-07statusdays on market $109,000 Active 4 DOM
-
2026-06-03days on market $109,000 Coming Soon 2 DOM
-
2026-06-02$109,000 Coming Soon 1 DOM
ⓘ Source: listings_history table (triggers on properties + properties_extension) + one-shot
backfill from property_details.listing_events for pre-trigger history.
Tax reassessment forecast IL · Partial reset (capped growth)
- Current annual tax
- $2,373 · $198/mo
- Projected year-2 tax
- $2,424 · $202/mo
- Expected delta
- +$51/yr (+$4/mo · 2.1%)
ⓘ Screening estimate from a state-policy table — verify with the county assessor before closing.
Climate risk First Street
- Flood 1/10 Low FEMA zone X · 0% chance over 30 yrs
- Wildfire 1/10 Low
- Heat 5/10 Major 7 d/yr ≥106°F today · 20 d/yr by 30 yrs out
- Wind 2/10 Low 100% chance of damaging wind over 30 yrs
- Air quality 3/10 Moderate 2 unhealthy d/yr today · 4 by 30 yrs out
Nearby sold comps map
Loading sold comps map…
Walkable amenities ~0.75 mi
Loading nearby amenities…
Taxation est. · year 1
- Rental income
- $16,173
- − Mortgage interest
- −$6,106
- − Property taxes
- −$2,373
- − Insurance
- −$545
- − Repairs & maintenance
- −$1,294
- − Management
- −$1,294
- − Depreciation
- −$3,171
- Taxable income
- $1,391
- Est. tax owed @ 24.0%
- −$334
- After-tax cash flow
- $2,666/yr
For passive investors: Depreciation is non-cash, so a rental often shows a tax loss while cash-flowing — sheltering income. Rental losses are passive: they offset passive income freely, and up to $25,000/yr can offset ordinary (W-2) income if you actively participate and your MAGI is under $100k (phasing out to $0 by $150k); unused losses carry forward. On sale, claimed depreciation is recaptured at up to 25%, and gains may owe capital-gains tax (a 1031 exchange can defer both). Figures are a year-1 estimate at your 24.0% rate — not tax advice; consult a CPA.
Schools (NCES district)
- District
- Alton CUSD 11
- NCES district ID
- 1703600
- Math proficiency
- 12% ▼ -10.00%
- Reading proficiency
- 13% ▼ -10.00%
- Median HH income
- $46,257
- Composite
- 11.34/100
- National rank
- #9710
- State rank
- #544 of 620 in IL
Livability — Alton
- Score
- 64/100
- State rank
- #701
- US rank
- #14289
Category grades
Schools grade is shown separately in the Schools card above.
Census & demographics
- Census place
- Alton, IL
- County
- Madison County · 189,064 people
- City population
- 29,543
- Metro
- St. Louis, MO-IL
- Population (ZIP)
- 29,543
- Household income
- $61,414
- Rent vs Own
- Severe rent burden
- 960.0
Population outlook (Madison County) Hauer SSP2
- Today (2025)
- 258,371 people
- By 2030
- 251,523 · -2.7%
- By 2040
- 233,640 · -9.6%
- By 2050
- 213,042 · -17.5%
- By 2075
- 165,255 · -36.0%
- By 2100
- 123,953 · -52.0%
Race, ethnicity, and origin ACS 2023
- Neighborhood character
- Predominantly White (71%)
- Race & ethnicity
- White 71% Black 20% Two or more races 6% Hispanic / Latino 2% Asian 1%
- Common ancestry
- Romanian 2% Lithuanian 2% Slovak 1%
- Foreign-born
- 2% · Canada
- Languages at home
- 97% English-only · Spanish 1% Other Indo-European 1%
Political lean MEDSL · Madison
- 2024 margin
- R (+13.3) · D 42.5% · R 55.8% · Other 1.8%
- 2008→2024 swing
- -22.5pp toward R · 2008: 9.2pp · 2024: -13.3pp
- All cycles
- 2024: R+13.3 2020: R+13.2 2016: R+15.6 2012: R+1.4 2008: D+9.2
Not yet ingested
- Civics
- —
Market trends
- HPI YoY
- ▼ -98.43%
- Current HPI
- 194.7313
- Rent YoY
- ▲ 8.24%
- Metro
- St. Louis, MO-IL
- State GDP YoY
- ▲ 1.59%
- F500 in state
- 60
Industry mix (Fortune 500 HQ in IL)
| Industry | F500 HQs | Revenue |
|---|---|---|
| Insurance | 4 | $201B |
|
||
| Consumer Goods | 4 | $87B |
|
||
| Industrial Machinery | 3 | $64B |
|
||
| Healthcare | 2 | $55B |
|
||
| Retail / Pharmacy | 1 | $148B |
|
||
| Agriculture / Food | 1 | $86B |
|
||
Price history
+30.5% since first listed2 events — show timeline
- 2026-06-01 Coming Soon $109,000 MARIS as Distributed by MLS Grid
- 2009-06-19 Sold (Public Records) $83,500 Public Records
Property tax history
+3.0%/yrLatest (2024): $2,373 · +8.8% YoY. Source: county tax records.
Cash-flow waterfall
monthlySold comps — $/sqft
last 12 mo · ≤1 miLoading sold comps…