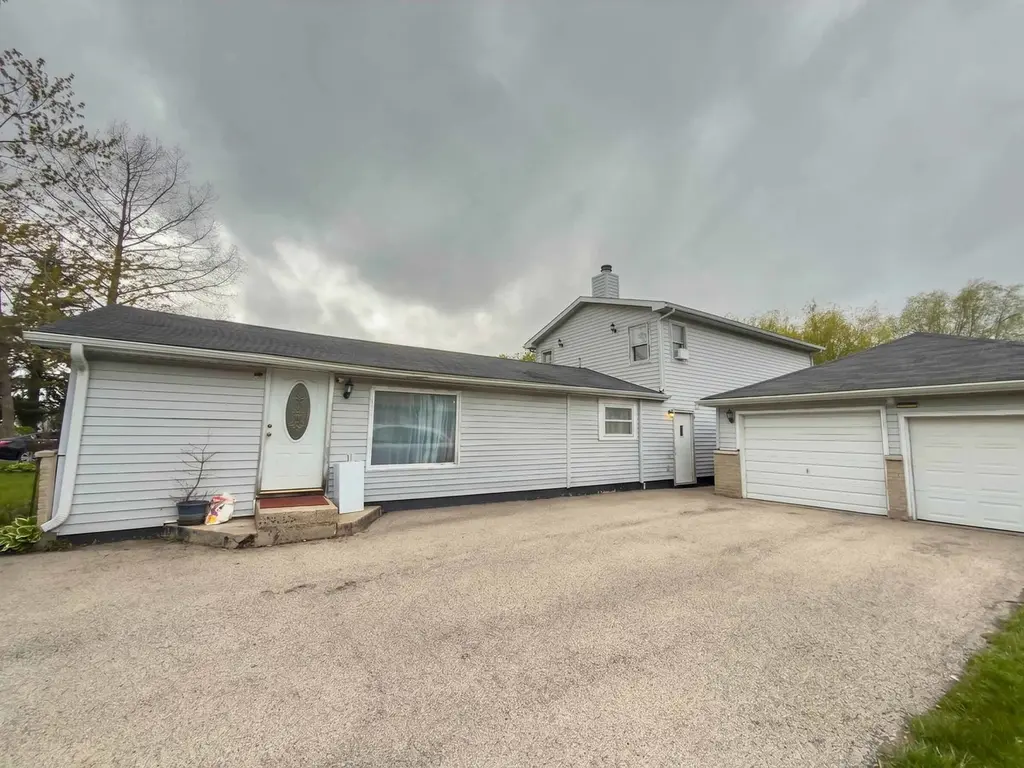
2912 18th Pl · North Chicago, IL
Flood risk 1/10 · Minimal
- FEMA flood zone
- X (unshaded)
- Chance of flooding over 30 yrs
- 0.0%
- Est. flood insurance / yr
- $507 – $1,088
Fire risk 1/10 · Minimal
- Est. fire insurance / yr
- $804 – $1,492
Heat risk 2/10 · Minimal
- Hot days now (above 97°F)
- 7 days/yr
- Hot days in 30 yrs
- 14 days/yr
Wind risk 2/10 · Minimal
- Chance of severe wind over 30 yrs
- —
Air-quality risk 4/10 · Minor
- Unhealthy air days now
- 4 days/yr
- Unhealthy air days in 30 yrs
- 5 days/yr
Risk factors via First Street. Map © Google.
Why this score? — see what drove the B grade
The composite is a weighted blend of 9 inputs, each scored 0–100. Each bar is that input's sub-score; the figure is the points it added to the 100-point composite (weight × sub-score).
- Cash flow +30.0/30.0
- 1% rule +10.0/10.0
- DSCR +10.0/10.0
- ARV discount +9.1/15.0
- Appreciation +4.2/10.0
- Livability +4.0/5.0
- Rent growth +2.5/5.0
- Condition / age +2.5/5.0
- Schools +0.9/10.0
$269,900
🖨 Deal sheet (PDF) 📄 Offer letter ✓ Due diligence
Listing remarks MLS
Newly rehabbed with fresh paint, new carpet and many details attended to. The expansive living room invites you in. Relax in the large family room off the kitchen with plenty of space for the entire family. Enjoy its cozy fireplace. The fun continues in the spacious back and side yard. Add your gazebo and grill and enjoy high summer living. Ideal for the dog or kids. Plenty of room for everyone, both inside and out.
Key facts
- 8,610 sq ft lot
- 4 parking spots
- Built 1935
Property features AI
Finance
- Other: Property age reported as 91–100 years
- HOA & community: No master association fees required
Exterior
- Parking: 4 parking spaces (owned)
- Utilities: Public water; Public sewer
- Home design: Detached single-family home; 2-story; Fee simple ownership; Built before 1978
- Construction: Frame construction
- Exterior features: Lot dimensions approximately 70 x 123; Lot size less than 0.25 acre
Interior
- Kitchen: Kitchen on main level
- Bedrooms: 5 bedrooms (Master bedroom located on the second floor; other bedrooms on main and second levels)
- Bathrooms: 2 full bathrooms; 1 half bathroom
- Heating & cooling: Natural gas heating; Forced air heating
- Interior features: Carbon monoxide detectors; Ceiling fans; 9 total rooms
- Laundry & utility: Laundry room
Neighborhood map
What this means for you Summary
Snapshot
- This is a 5-bed/2.5-bath single-family listed at $270k.
Deal economics
- At list price, monthly cash flow is $1k ($15k/yr) — positive.
- The deal already cash-flows at list — no discount required.
- Meets the 1% rule at list price ($4k rent vs $270k).
- Recommended offer: $262k (3.0% below list) — sets the bar for market timing.
- Cap rate 11.7% vs local median 4.7% in North Chicago — top-decile yield for the area; either an underpriced asset or a hidden risk that comps aren't pricing in. Stress-test before assuming the spread holds.
Location & tenants
- Location reads 81/100 on livability (#95 in IL, #1,536 nationally) — a professional / high-income tenant draw. Strengths: commute A+, cost of living A+, housing A+; Watch: employment D+, amenities F.
- North Chicago SD 187 (suburban): math 8% / reading 13% proficiency, ranked #574 of 620 in IL (top 93%) — low school quality limits family demand, transient renter base, plan for 1-2y turnover; 78% free/reduced lunch — lower-income household profile, screen leases tightly.
- Zoned schools: Neal Math Science Academy (math 3% / reading 3%, grade F, #655 of 665 statewide, top 99%, 529 students, 0% FRL); North Chicago Community High Sch (math 2% / reading 12%, grade F, #599 of 693 statewide, top 87%, 868 students, 0% FRL) — zoned schools average 0% FRL vs 78% district-wide (78 pts lower); this property's tenant base skews higher-income than the district average.
- Market conditions: 25 active listings in the ZIP; 2 comparable units currently listed for rent nearby; 948 units permitted in Lake County in 2024 (424 in 5+ unit buildings).
Forward outlook
- Local home prices are declining (-1.6%/yr); year-one equity from $2k of loan paydown is wiped out by about $4k of value loss. Plan a longer hold.
- Lake County population projected to shrink 8% by 2050 — rents likely to lag national; underwrite the cash flow, not the appreciation.
- At projected returns (-1.6% appreciation + 3.0% rent growth), your $76k cash investment doubles in ~6 years — after that, you're playing with house money.
Negotiation context
- It's been on market 37 days — a 3% lower offer ($262k) is reasonable based on typical stale-listing flexibility.
- 5 sale attempts since 16y ago with the ask held roughly flat each time — persistent listings suggest the price (not the market) is what's stuck; bring a comps-based counter.
- Current owner paid $70k; list at $270k implies a 286% gain — meaningful room to come down on a strong offer.
Risks & watch-outs
- Watch-outs: property tax is 3.2% of price; built in 1935 — expect roof / HVAC / electrical / plumbing capex.
Questions for the listing agent
- It's been on market 37 days. Have you received any prior offers? Is the seller open to a 3% concession, seller financing, or rate buy-down credit?
- Built in 1935 — when were the roof, HVAC, electrical panel, plumbing, and water heater last replaced?
- Property tax is high relative to price — has the assessment been appealed recently, and will the sale trigger a re-assessment?
- Is there a deadline driving the sale (1031 exchange, divorce, estate, relocation)? That informs how much negotiation room exists.
- Schools are F-rated, which usually means shorter tenancies and higher turnover. Who's the typical renter profile here, and what's been the actual vacancy rate?
- What's the average days-on-market for RENTAL listings here right now (not sales)? A rising rental-DOM trend means longer vacancies and softer asking-rent achievability than the comps imply.
- What's the recent tenant-quality profile in this submarket — average credit score on applications, eviction rate, late-payment / NSF rate, and stable-employment percentage? A property-management company in the area should have these aggregated.
- How much new for-sale + rental construction is in the pipeline within 1–3 miles? Heavy new supply typically softens prices + rents 12–24 months out; constrained supply supports both.
Investment metrics
- 1% rule
- 1.63% ✓
- Cap rate
- 11.72%
- Cash-on-cash
- 19.39%
- DSCR
- 1.86
- GRM
- 5.1
CMA / ARV
- ARV (median comp)
- $280,111
- List price
- $269,900
- Delta
- -3.65%
- Verdict
- FAIR
- Comps
- 13 within 1.0 mi
Show comp detail 5 sales within ~0.75 mi
| Address | Dist | Beds/Ba | Sqft | Sold | Price | $/sf | Match |
|---|---|---|---|---|---|---|---|
| 2108 Winter Ave | 0.48mi | 4/1.5 (-1) | 2,158 (-3%) | 9mo | $294,000 | $136 | 57 |
| 2812 20th St | 0.24mi | 4/2.0 (-1) | 1,960 (-12%) | 8mo | $300,000 | $153 | 56 |
| 2920 22nd Pl | 0.51mi | 4/3.5 (-1) | 2,400 (+8%) | 1mo | $415,000 | $173 | 53 |
| 1908 Green Bay Rd | 0.11mi | 6/3.0 (+1) | 2,500 (+13%) | 20mo | $292,000 | $117 | 50 |
| 2922 22nd Pl | 0.51mi | 4/3.5 (-1) | 2,450 (+10%) | 13mo | $360,000 | $147 | 39 |
Match score weights: distance 35% · size 25% · config 20% · recency 20%. Top-matched comps best support the ARV.
Projected returns pro-forma
-1.61% appreciation · 3.0% rent growth · sell at horizon
- IRR
- 15.3%
- Equity multiple
- 1.67×
- Total profit
- $50,440
- Equity at exit
- $57,371
- IRR
- 21.9%
- Equity multiple
- 3.12×
- Total profit
- $159,946
- Equity at exit
- $53,840
Cash invested: $75,572 (down + closing). Projections, not guarantees.
Landlord ↔ Tenant lean methodology
- Overall (STATE)
- 43 Moderately Tenant-Leaning
- State Illinois
- 43 Moderately Tenant-Leaning · D+7
- County
- — inherits STATE
- City
- — inherits STATE
ZIP-level market 60064
- Home prices YoY
- -0.7%
- Active inventory
- 25
- Price-to-rent
- 5.1×
Monthly cashflow live
- Estimated rent
- $4,391 medium interval (Pro) →
- Mortgage (P&I)
- −$1,415
- Tax from tax record
- −$720 /mo · $8,637/yr
- Insurance
- −$112
- HOA
- −$0
- Vacancy / Maint / Mgmt
- −$922
- Net cashflow
- $1,221
Break-even live
Sensitivity live
| Price | -10% $1,374 | -5% $1,298 | +0% $1,221 | +5% $1,145 | +10% $1,068 |
|---|---|---|---|---|---|
| Rent | -10% $874 | -5% $1,048 | +0% $1,221 | +5% $1,395 | +10% $1,568 |
| Rate | -1.0pp $1,357 | -0.5pp $1,290 | base $1,221 | +0.5pp $1,151 | +1.0pp $1,080 |
UW: 25.0% down · 7.5% · 30yr · 1.5% tax · 5.0% vac · 8.0% maint · 8.0% mgmt
Financing live
Cash to close
- Down payment
- $67,475
- Closing costs
- $8,097
- Reserves months
- —
- Total cash needed
- —
Loan-product check · same deal, 3 products live
Conventional
25% down · 7.5% · 30yr
- Down + closing
- —
- Monthly P&I
- —
- Monthly cashflow
- —
- DSCR
- —
- Eligible?
- —
Personal DTI + credit; lowest rate.
DSCR
20% down · 8.5% · 30yr
- Down + closing
- —
- Monthly P&I
- —
- Monthly cashflow
- —
- DSCR
- —
- Eligible?
- —
No personal income docs; deal must DSCR.
Hard money
10% down · 12.0% · 12mo
- Down + closing
- —
- Monthly P&I
- —
- Monthly cashflow
- —
- DSCR
- —
- Eligible?
- —
Short-term bridge; refi at stabilization.
Rent comps 2 comps
| Address | Beds | Baths | Sqft | Rent | $/sqft | DOM | Units | Dist |
|---|---|---|---|---|---|---|---|---|
| 2404 Pearsall Pkwy Waukegan, IL | 4.0 | 2.0 | 2000 | $4,300 | $2.15 | 0d | 1 | 1.28mi |
| 708 Keller Ave Waukegan, IL | 4.0 | 2.0 | 1800 | $4,500 | $2.50 | 0d | 1 | 1.39mi |
Listing history 35 events
-
2026-06-18days on market $269,900 Active 37 DOM
-
2026-06-17days on market $269,900 Active 36 DOM
-
2026-06-16days on market $269,900 Active 35 DOM
-
2026-06-15days on market $269,900 Active 34 DOM
-
2026-06-13days on market $269,900 Active 32 DOM
-
2026-06-13days on market $269,900 Active 31 DOM
-
2026-06-09days on market $269,900 Active 28 DOM
-
2026-06-08days on market $269,900 Active 27 DOM
-
2026-06-07days on market $269,900 Active 26 DOM
-
2026-06-04days on market $269,900 Active 23 DOM
-
2026-06-03days on market $269,900 Active 22 DOM
-
2026-06-02days on market $269,900 Active 21 DOM
-
2026-06-01days on market $269,900 Active 20 DOM
-
2026-05-31days on market $269,900 Active 19 DOM
-
2026-05-12$269,900 Active 289-char remark
-
2013-10-29soldstatus $70,000 Closed Sale 419-char remark
Show marketing remark (419 chars)
Newly rehabbed with fresh paint, new carpet and many details attended to. The expansive living room invites you in. Relax in the large family room off the kitchen with plenty of space for the entire family. Enjoy its cozy fireplace. The fun continues in the spacious back and side yard. Add your gazebo and grill and enjoy high summer living. Ideal for the dog or kids. Plenty of room for everyone, both inside and out.
-
2013-10-25historical Contingent 419-char remark
Show marketing remark (419 chars)
Newly rehabbed with fresh paint, new carpet and many details attended to. The expansive living room invites you in. Relax in the large family room off the kitchen with plenty of space for the entire family. Enjoy its cozy fireplace. The fun continues in the spacious back and side yard. Add your gazebo and grill and enjoy high summer living. Ideal for the dog or kids. Plenty of room for everyone, both inside and out.
-
2013-10-24status Back On Market 419-char remark
Show marketing remark (419 chars)
Newly rehabbed with fresh paint, new carpet and many details attended to. The expansive living room invites you in. Relax in the large family room off the kitchen with plenty of space for the entire family. Enjoy its cozy fireplace. The fun continues in the spacious back and side yard. Add your gazebo and grill and enjoy high summer living. Ideal for the dog or kids. Plenty of room for everyone, both inside and out.
-
2013-10-22historical 419-char remark
Show marketing remark (419 chars)
Newly rehabbed with fresh paint, new carpet and many details attended to. The expansive living room invites you in. Relax in the large family room off the kitchen with plenty of space for the entire family. Enjoy its cozy fireplace. The fun continues in the spacious back and side yard. Add your gazebo and grill and enjoy high summer living. Ideal for the dog or kids. Plenty of room for everyone, both inside and out.
-
2013-08-01historical Contingent 419-char remark
Show marketing remark (419 chars)
Newly rehabbed with fresh paint, new carpet and many details attended to. The expansive living room invites you in. Relax in the large family room off the kitchen with plenty of space for the entire family. Enjoy its cozy fireplace. The fun continues in the spacious back and side yard. Add your gazebo and grill and enjoy high summer living. Ideal for the dog or kids. Plenty of room for everyone, both inside and out.
-
2013-07-20$62,500 New 419-char remark
Show marketing remark (419 chars)
Newly rehabbed with fresh paint, new carpet and many details attended to. The expansive living room invites you in. Relax in the large family room off the kitchen with plenty of space for the entire family. Enjoy its cozy fireplace. The fun continues in the spacious back and side yard. Add your gazebo and grill and enjoy high summer living. Ideal for the dog or kids. Plenty of room for everyone, both inside and out.
-
2012-09-17historical
-
2011-09-15New
-
2011-09-09historical
-
2011-06-23price Price Change
-
2011-06-06price Price Change
-
2011-05-21price Price Change
-
2011-03-14price Price Change
-
2011-02-11price Price Change
-
2011-01-14price Price Change
-
2010-12-15price Price Change
-
2010-09-29price Price Change
-
2010-09-09New
-
1994-01-05soldstatus $67,500
-
1985-11-01soldstatus $40,000
ⓘ Source: listings_history table (triggers on properties + properties_extension) + one-shot
backfill from property_details.listing_events for pre-trigger history.
Tax reassessment forecast IL · Partial reset (capped growth)
- Current annual tax
- $8,637 · $720/mo
- Projected year-2 tax
- $8,637 · $720/mo
- Expected delta
- $0/yr ($0/mo · 0.0%)
ⓘ Screening estimate from a state-policy table — verify with the county assessor before closing.
Climate risk First Street
- Flood 1/10 Low FEMA zone X (unshaded) · 0% chance over 30 yrs
- Wildfire 1/10 Low
- Heat 2/10 Low 7 d/yr ≥97°F today · 14 d/yr by 30 yrs out
- Wind 2/10 Low
- Air quality 4/10 Moderate 4 unhealthy d/yr today · 5 by 30 yrs out
Nearby sold comps map
Loading sold comps map…
Walkable amenities ~0.75 mi
Loading nearby amenities…
Taxation est. · year 1
- Rental income
- $52,689
- − Mortgage interest
- −$15,119
- − Property taxes
- −$8,637
- − Insurance
- −$1,350
- − Repairs & maintenance
- −$4,215
- − Management
- −$4,215
- − Depreciation
- −$7,852
- Taxable income
- $11,302
- Est. tax owed @ 24.0%
- −$2,713
- After-tax cash flow
- $11,941/yr
For passive investors: Depreciation is non-cash, so a rental often shows a tax loss while cash-flowing — sheltering income. Rental losses are passive: they offset passive income freely, and up to $25,000/yr can offset ordinary (W-2) income if you actively participate and your MAGI is under $100k (phasing out to $0 by $150k); unused losses carry forward. On sale, claimed depreciation is recaptured at up to 25%, and gains may owe capital-gains tax (a 1031 exchange can defer both). Figures are a year-1 estimate at your 24.0% rate — not tax advice; consult a CPA.
Schools (NCES district)
- District
- North Chicago SD 187
- NCES district ID
- 1700110
- Math proficiency
- 8% ▼ -4.00%
- Reading proficiency
- 13% ▼ -4.00%
- Median HH income
- $39,812
- Composite
- 9.05/100
- National rank
- #9873
- State rank
- #574 of 620 in IL
Livability — North Chicago
- Score
- 81/100
- State rank
- #95
- US rank
- #1536
Category grades
Schools grade is shown separately in the Schools card above.
Census & demographics
- Census place
- North Chicago, IL
- City population
- 29,316
- Population (ZIP)
- 15,047
Population outlook (Lake County) Hauer SSP2
- Today (2025)
- 700,217 people
- By 2030
- 693,290 · -1.0%
- By 2040
- 673,588 · -3.8%
- By 2050
- 643,556 · -8.1%
- By 2075
- 562,792 · -19.6%
- By 2100
- 457,715 · -34.6%
Race, ethnicity, and origin ACS 2023
- Neighborhood character
- Diverse neighborhood (Simpson 0.61)
- Race & ethnicity
- Hispanic / Latino 54% Black 30% Two or more races 19% White 11% Asian 2% Native American 2%
- Hispanic origin (detail)
- Mexican 47% Puerto Rican 2%
- Common ancestry
- Romanian 1% British 1% American 1%
- Foreign-born
- 27% · Canada
- Languages at home
- 51% English-only · Spanish 47% Other Indo-European 1%
Political lean MEDSL · Lake
- 2024 margin
- Strong D (+20.8) · D 59.7% · R 38.9% · Other 1.4%
- 2008→2024 swing
- +1.1pp toward D · 2008: 19.6pp · 2024: 20.8pp
- All cycles
- 2024: D+20.8 2020: D+24.1 2016: D+20.3 2012: D+8.1 2008: D+19.6
Not yet ingested
- Civics
- —
Market trends
- HPI YoY
- ▼ -1.61%
- Current HPI
- 233.6178
- Rent YoY
- —
- Metro
- —
- State GDP YoY
- ▲ 1.59%
- F500 in state
- 60
Industry mix (Fortune 500 HQ in IL)
| Industry | F500 HQs | Revenue |
|---|---|---|
| Insurance | 4 | $201B |
|
||
| Consumer Goods | 4 | $87B |
|
||
| Industrial Machinery | 3 | $64B |
|
||
| Healthcare | 2 | $55B |
|
||
| Retail / Pharmacy | 1 | $148B |
|
||
| Agriculture / Food | 1 | $86B |
|
||
Price history
+574.8% since first listed21 events — show timeline
- 2026-05-12 Listed $269,900 MRED as Distributed by MLS Grid
- 2013-10-29 Sold (MLS) $70,000 MRED as Distributed by MLS Grid
- 2013-10-25 Contingent — MRED as Distributed by MLS Grid
- 2013-10-24 Relisted — MRED as Distributed by MLS Grid
- 2013-10-22 Listing Removed — MRED as Distributed by MLS Grid
- 2013-08-01 Contingent — MRED as Distributed by MLS Grid
- 2013-07-20 Listed $62,500 MRED as Distributed by MLS Grid
- 2012-09-17 Listing Removed — MRED as Distributed by MLS Grid
- 2011-09-15 Listed — MRED as Distributed by MLS Grid
- 2011-09-09 Listing Removed — MRED as Distributed by MLS Grid
- 2011-06-23 Price Changed — MRED as Distributed by MLS Grid
- 2011-06-06 Price Changed — MRED as Distributed by MLS Grid
- 2011-05-21 Price Changed — MRED as Distributed by MLS Grid
- 2011-03-14 Price Changed — MRED as Distributed by MLS Grid
- 2011-02-11 Price Changed — MRED as Distributed by MLS Grid
- 2011-01-14 Price Changed — MRED as Distributed by MLS Grid
- 2010-12-15 Price Changed — MRED as Distributed by MLS Grid
- 2010-09-29 Price Changed — MRED as Distributed by MLS Grid
- 2010-09-09 Listed — MRED as Distributed by MLS Grid
- 1994-01-05 Sold (Public Records) $67,500 Public Records
- 1985-11-01 Sold (Public Records) $40,000 Public Records
Property tax history
+2.5%/yrLatest (2024): $8,637 · +3.2% YoY. Source: county tax records.
Cash-flow waterfall
monthlySold comps — $/sqft
last 12 mo · ≤1 miLoading sold comps…