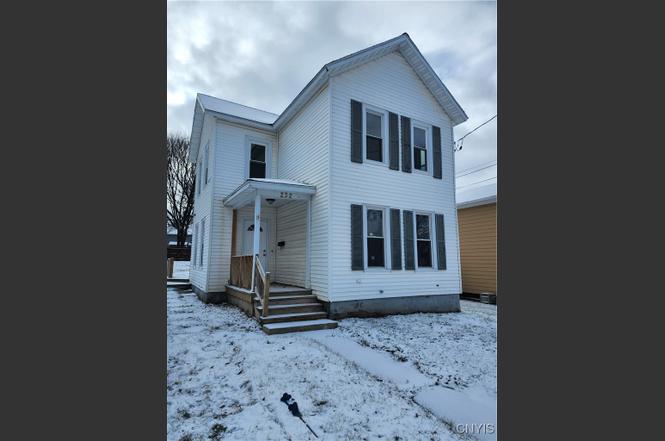
232 Seymour St · Auburn, NY
Flood risk 1/10 · Minimal
- FEMA flood zone
- X (unshaded)
- Chance of flooding over 30 yrs
- 0.0%
- Est. flood insurance / yr
- $473 – $860
Fire risk 1/10 · Minimal
- Est. fire insurance / yr
- $691 – $1,283
Heat risk 2/10 · Minimal
- Hot days now (above 96°F)
- 7 days/yr
- Hot days in 30 yrs
- 15 days/yr
Wind risk 1/10 · Minimal
- Chance of severe wind over 30 yrs
- 1.0%
Air-quality risk 2/10 · Minimal
- Unhealthy air days now
- 0 days/yr
- Unhealthy air days in 30 yrs
- 1 days/yr
Risk factors via First Street. Map © Google.
Why this score? — see what drove the C grade
The composite is a weighted blend of 9 inputs, each scored 0–100. Each bar is that input's sub-score; the figure is the points it added to the 100-point composite (weight × sub-score).
- Cash flow +23.6/30.0
- ARV discount +7.7/15.0
- DSCR +7.6/10.0
- 1% rule +7.0/10.0
- Livability +3.7/5.0
- Schools +3.0/10.0
- Rent growth +2.5/5.0
- Condition / age +2.5/5.0
- Appreciation +0.0/10.0
$159,900
🖨 Deal sheet 📄 Offer letter ✓ Due diligence
Listing remarks
This home has been recently updated, must see. The kitchen is an eat in kitchen with new cabinetry and yet has a formal dining area that could be used for another sitting are. With plenty of space for entertaining this home has two more rooms for maybe a family room or a living room, game room. This home does have a first-floor bedroom, or could be a home office, you deicide. The upstairs has a new plush wall to wall carpet, and a storge area or whatever is needed. The back kitchen door goes directly to the spacious back yard.
Key facts
- Eat in kitchen
- Spacious back yard
- Formal dining area
Tags
Neighborhood map
What this means for you Summary
Snapshot
- This is a 4-bed/2.0-bath single-family listed at $160k.
Deal economics
- At list price, monthly cash flow is $300 ($4k/yr) — positive.
- The deal already cash-flows at list — no discount required.
- Meets the 1% rule at list price ($2k rent vs $160k).
- Recommended offer: $155k (3.0% below list) — sets the bar for market timing.
Location & tenants
- Location reads 74/100 on livability (#298 in NY, #4,814 nationally) — a middle-class / working-renter tenant base. Strengths: cost of living A+, housing A+, health & safety A+; Watch: schools D, amenities D-, commute F.
- Auburn City School District (town): math 31% / reading 39% proficiency, ranked #558 of 590 in NY (top 95%) — families likely to look elsewhere, expect single-tenant / working-renter base with shorter leases.
- Market conditions: 221 active listings in the ZIP; 1 comparable units currently listed for rent nearby; 161 units permitted in Cayuga County in 2024 (65 in 5+ unit buildings).
- This rent runs 38% of the median local income ($61k/yr) — at the standard rent-burdened threshold; future hikes will face affordability resistance.
Forward outlook
- Local home prices are declining (-3.0%/yr); year-one equity from $1k of loan paydown is wiped out by about $5k of value loss. Plan a longer hold.
- Cayuga County population projected at -18% by 2050 — secular population decline; favor cash flow + early exit over multi-decade hold.
Negotiation context
- It's been on market 47 days — a 3% lower offer ($155k) is reasonable based on typical stale-listing flexibility.
- 2 sale attempts since 14y ago with the ask held roughly flat each time — persistent listings suggest the price (not the market) is what's stuck; bring a comps-based counter.
- Current owner paid $93k; list at $160k implies a 72% gain — meaningful room to come down on a strong offer.
Risks & watch-outs
- Watch-outs: built in 1870 — expect roof / HVAC / electrical / plumbing capex.
Questions for the listing agent
- It's been on market 47 days. Have you received any prior offers? Is the seller open to a 3% concession, seller financing, or rate buy-down credit?
- Built in 1870 — when were the roof, HVAC, electrical panel, plumbing, and water heater last replaced?
- Is there a deadline driving the sale (1031 exchange, divorce, estate, relocation)? That informs how much negotiation room exists.
- Schools are D-rated, which usually means shorter tenancies and higher turnover. Who's the typical renter profile here, and what's been the actual vacancy rate?
- What's the average days-on-market for RENTAL listings here right now (not sales)? A rising rental-DOM trend means longer vacancies and softer asking-rent achievability than the comps imply.
- What's the recent tenant-quality profile in this submarket — average credit score on applications, eviction rate, late-payment / NSF rate, and stable-employment percentage? A property-management company in the area should have these aggregated.
- How much new for-sale + rental construction is in the pipeline within 1–3 miles? Heavy new supply typically softens prices + rents 12–24 months out; constrained supply supports both.
Investment metrics
- 1% rule
- 1.20% ✓
- Cap rate
- 8.55%
- Cash-on-cash
- 8.04%
- DSCR
- 1.36
- GRM
- 7.0
CMA / ARV
- ARV (on-the-fly)
- $160,500
- Comps found
- 12
Show comp detail 12 sales within ~0.75 mi
| Address | Dist | Beds/Ba | Sqft | Sold | Price | $/sf | Match |
|---|---|---|---|---|---|---|---|
| 266 Seymour St | 0.12mi | 4/2.0 | 1,482 (-1%) | 9mo | $40,000 | $27 | 85 |
| 75 Van Anden St | 0.34mi | 3/2.0 (-1) | 1,519 (+1%) | 2mo | $50,000 | $33 | 75 |
| 4 Case Ave | 0.41mi | 4/1.5 | 1,485 (-1%) | 8mo | $189,900 | $128 | 71 |
| 21 Union St | 0.39mi | 3/1.5 (-1) | 1,506 (+0%) | 6mo | $169,950 | $113 | 69 |
| 50 N Division St | 0.29mi | 3/1.0 (-1) | 1,358 (-10%) | 6mo | $120,000 | $88 | 56 |
| 238 State St | 0.52mi | 3/1.5 (-1) | 1,456 (-3%) | 10mo | $150,000 | $103 | 56 |
| 26 Chase St | 0.51mi | 3/2.0 (-1) | 1,372 (-8%) | 4mo | $170,000 | $124 | 54 |
| 23 Chase St | 0.49mi | 3/1.0 (-1) | 1,652 (+10%) | 2mo | $165,000 | $100 | 49 |
| 7 Orchard Ave | 0.63mi | 4/2.0 | 1,312 (-12%) | 5mo | $170,000 | $130 | 45 |
| 185 Perrine Ave | 0.47mi | 3/1.0 (-1) | 1,296 (-14%) | 4mo | $92,500 | $71 | 43 |
| 9 Wallace Ave | 0.67mi | 3/1.0 (-1) | 1,348 (-10%) | 4mo | $144,000 | $107 | 40 |
| 124 Curtis Pl | 0.73mi | 3/1.5 (-1) | 1,295 (-14%) | 8mo | $165,000 | $127 | 30 |
Match score weights: distance 35% · size 25% · config 20% · recency 20%. Top-matched comps best support the ARV.
Projected returns pro-forma
-3.0% appreciation · 3.0% rent growth · sell at horizon
- IRR
- -4.0%
- Equity multiple
- 0.85×
- Total profit
- $-6,700
- Equity at exit
- $23,842
- IRR
- 5.8%
- Equity multiple
- 1.43×
- Total profit
- $19,169
- Equity at exit
- $13,825
Cash invested: $44,772 (down + closing). Projections, not guarantees.
Landlord ↔ Tenant lean methodology
- Overall (STATE)
- 15 Strongly Tenant-Friendly
- State New York
- 15 Strongly Tenant-Friendly · D+10
- County
- — inherits STATE
- City
- — inherits STATE
ZIP-level market 13021
- Home prices YoY
- -22.4%
- Active inventory
- 221
- Price-to-rent
- 7.0×
Monthly cashflow live
- Estimated rent
- $1,917 medium interval (Pro) →
- Mortgage (P&I)
- −$839
- Tax from tax record
- −$309 /mo · $3,706/yr
- Insurance
- −$67
- HOA
- −$0
- Vacancy / Maint / Mgmt
- −$402
- Net cashflow
- $300
Break-even live
UW: 25.0% down · 7.5% · 30yr · 1.5% tax · 5.0% vac · 8.0% maint · 8.0% mgmt
Financing live
Cash to close
- Down payment
- $39,975
- Closing costs
- $4,797
- Reserves months
- —
- Total cash needed
- —
Loan-product check · same deal, 3 products live
Conventional
25% down · 7.5% · 30yr
- Down + closing
- —
- Monthly P&I
- —
- Monthly cashflow
- —
- DSCR
- —
- Eligible?
- —
Personal DTI + credit; lowest rate.
DSCR
20% down · 8.5% · 30yr
- Down + closing
- —
- Monthly P&I
- —
- Monthly cashflow
- —
- DSCR
- —
- Eligible?
- —
No personal income docs; deal must DSCR.
Hard money
10% down · 12.0% · 12mo
- Down + closing
- —
- Monthly P&I
- —
- Monthly cashflow
- —
- DSCR
- —
- Eligible?
- —
Short-term bridge; refi at stabilization.
Rent comps 1 comps
| Address | Beds | Baths | Sqft | Rent | $/sqft | DOM | Units | Dist |
|---|---|---|---|---|---|---|---|---|
| 5 Sheridan St Auburn, NY | 4.0 | 2.0 | 1788 | $1,995 | $1.12 | 43d | 1 | 1.36mi |
Listing history 5 events
-
2026-03-04status Pending
-
2026-01-16$159,900 Active
-
2012-05-16$89,900
-
2007-08-24soldstatus $93,000
-
1995-03-28soldstatus $39,900
ⓘ Source: listings_history table (triggers on properties + properties_extension) + one-shot
backfill from property_details.listing_events for pre-trigger history.
Tax reassessment forecast NY · Partial reset (capped growth)
- Current annual tax
- $3,706 · $309/mo
- Projected year-2 tax
- $3,706 · $309/mo
- Expected delta
- $0/yr ($0/mo · 0.0%)
ⓘ Screening estimate from a state-policy table — verify with the county assessor before closing.
Climate risk First Street
- Flood 1/10 Low FEMA zone X (unshaded) · 0% chance over 30 yrs
- Wildfire 1/10 Low
- Heat 2/10 Low 7 d/yr ≥96°F today · 15 d/yr by 30 yrs out
- Wind 1/10 Low 100% chance of damaging wind over 30 yrs
- Air quality 2/10 Low 0 unhealthy d/yr today · 1 by 30 yrs out
Nearby sold comps map
Loading sold comps map…
Walkable amenities ~0.75 mi
Loading nearby amenities…
Taxation est. · year 1
- Rental income
- $22,999
- − Mortgage interest
- −$8,957
- − Property taxes
- −$3,706
- − Insurance
- −$800
- − Repairs & maintenance
- −$1,840
- − Management
- −$1,840
- − Depreciation
- −$4,652
- Taxable income
- $1,205
- Est. tax owed @ 24.0%
- −$289
- After-tax cash flow
- $3,312/yr
For passive investors: Depreciation is non-cash, so a rental often shows a tax loss while cash-flowing — sheltering income. Rental losses are passive: they offset passive income freely, and up to $25,000/yr can offset ordinary (W-2) income if you actively participate and your MAGI is under $100k (phasing out to $0 by $150k); unused losses carry forward. On sale, claimed depreciation is recaptured at up to 25%, and gains may owe capital-gains tax (a 1031 exchange can defer both). Figures are a year-1 estimate at your 24.0% rate — not tax advice; consult a CPA.
Schools (NCES district)
- District
- Auburn City School District
- NCES district ID
- 3603480
- Math proficiency
- 31% ▼ -17.00%
- Reading proficiency
- 39% ▲ 2.00%
- Median HH income
- $43,567
- Composite
- 29.71/100
- National rank
- #6452
- State rank
- #558 of 590 in NY
Livability — Auburn
- Score
- 74/100
- State rank
- #298
- US rank
- #4814
Category grades
Schools grade is shown separately in the Schools card above.
Census & demographics
- Census place
- Auburn, NY
- County
- Cayuga County · 37,247 people
- City population
- 37,247
- Metro
- Auburn, NY
- Population (ZIP)
- 37,247
- Household income
- $60,712
- Rent vs Own
- Severe rent burden
- 1449.0
Population outlook (Cayuga County) Hauer SSP2
- Today (2025)
- 74,820 people
- By 2030
- 72,402 · -3.2%
- By 2040
- 66,917 · -10.6%
- By 2050
- 61,007 · -18.5%
- By 2075
- 48,047 · -35.8%
- By 2100
- 34,512 · -53.9%
Race, ethnicity, and origin ACS 2023
- Neighborhood character
- Predominantly White (87%)
- Race & ethnicity
- White 87% Two or more races 7% Black 3% Hispanic / Latino 3%
- Common ancestry
- Romanian 8% Subsaharan African 3% Lithuanian 2%
- Foreign-born
- 2% · Canada
- Languages at home
- 95% English-only · Spanish 2% Other Indo-European 1% German/W. Germanic 1%
Political lean MEDSL · Cayuga
- 2024 margin
- R (+13.0) · D 43.5% · R 56.5%
- 2008→2024 swing
- -21.5pp toward R · 2008: 8.5pp · 2024: -13.0pp
- All cycles
- 2024: R+13.0 2020: R+9.2 2016: R+13.2 2012: D+10.8 2008: D+8.5
Not yet ingested
- Civics
- —
Market trends
- HPI YoY
- ▼ -97.53%
- Current HPI
- 338.5537
- Rent YoY
- —
- Metro
- Auburn, NY
- State GDP YoY
- ▲ 2.60%
- F500 in state
- 92
Industry mix (Fortune 500 HQ in NY)
| Industry | F500 HQs | Revenue |
|---|---|---|
| Financial Services | 10 | $950B |
|
||
| Consumer Goods | 9 | $162B |
|
||
| Insurance | 4 | $225B |
|
||
| Telecommunications | 2 | $144B |
|
||
| Pharmaceuticals | 2 | $112B |
|
||
| Media / Entertainment | 2 | $69B |
|
||
Price history
+300.8% since first listed5 events — show timeline
- 2026-03-04 Pending — CNYIS
- 2026-01-16 Listed $159,900 CNYIS
- 2012-05-16 Listed $89,900 CNYIS
- 2007-08-24 Sold (Public Records) $93,000 Public Records
- 1995-03-28 Sold (Public Records) $39,900 Public Records
Property tax history
+0.4%/yrLatest (2025): $3,706 · +27.7% YoY. Source: county tax records.
Cash-flow waterfall
monthlySold comps — $/sqft
last 12 mo · ≤1 miLoading sold comps…