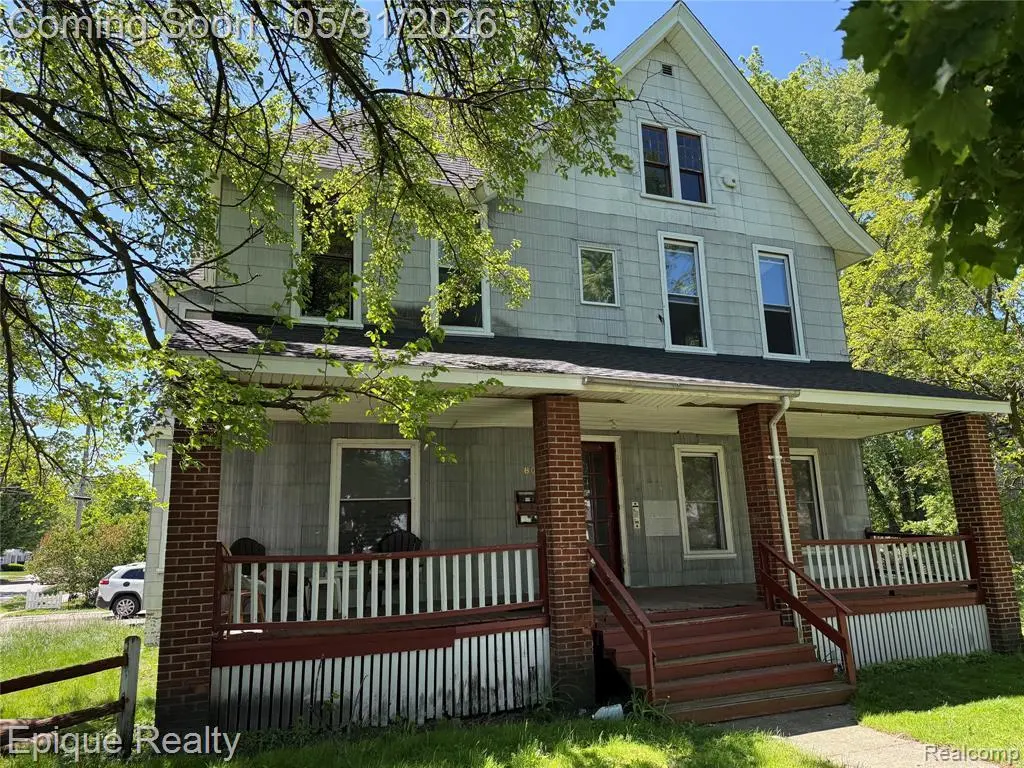
804 Court St · Port Huron, MI
Flood risk 1/10 · Minimal
- FEMA flood zone
- X (unshaded)
- Chance of flooding over 30 yrs
- 0.0%
- Est. flood insurance / yr
- $473 – $860
Fire risk 1/10 · Minimal
- Est. fire insurance / yr
- $784 – $1,456
Heat risk 2/10 · Minimal
- Hot days now (above 98°F)
- 7 days/yr
- Hot days in 30 yrs
- 14 days/yr
Wind risk 1/10 · Minimal
- Chance of severe wind over 30 yrs
- —
Air-quality risk 2/10 · Minimal
- Unhealthy air days now
- 1 days/yr
- Unhealthy air days in 30 yrs
- 2 days/yr
Risk factors via First Street. Map © Google.
Why this score? — see what drove the C grade
The composite is a weighted blend of 9 inputs, each scored 0–100. Each bar is that input's sub-score; the figure is the points it added to the 100-point composite (weight × sub-score).
- Cash flow +24.0/30.0
- 1% rule +8.8/10.0
- DSCR +7.7/10.0
- ARV discount +7.5/15.0
- Rent growth +3.4/5.0
- Livability +3.2/5.0
- Schools +2.5/10.0
- Condition / age +2.5/5.0
- Appreciation +0.0/10.0
$129,000
🖨 Deal sheet 📄 Offer letter ✓ Due diligence
Listing remarks MLS
Fully occupied 4 unit Multi-family home in the Historical District area of Port Huron. Walking distance to the downtown district where one may enjoy all that this town has to offer. Shopping, entertainment, museum, Churches, and many restaurants. Each Unit has it's own furnace and thermostats, to be individually controlled. Any income or expense documentation will be provided upon acceptance of an offer. Showings will be scheduled online with your agent.
Key facts
- 6,970 sq ft lot
- Built 1907
- Listed 18 days
Property features AI
Finance
- Financial info: Property contains 4 units; Net operating income listed as $1; Water is included in lease information
Exterior
- Utilities: Public water; Natural gas
- Home design: Multi-family property; Colonial style; 2-story structure; Built in 1907; Facing: south-west corner location
- Construction: Basement foundation
- Exterior features: Asphalt exterior construction; Paved street access
Interior
- Bathrooms: 4 full bathrooms
- Heating & cooling: Forced air heating; Hot water heating; Natural gas fuel
- Interior features: Block basement
Neighborhood map
What this means for you Summary
Snapshot
- This is a 16-bed/16.0-bath single-family listed at $129k.
Deal economics
- At list price, monthly cash flow is $253 ($3k/yr) — positive.
- The deal already cash-flows at list — no discount required.
- Meets the 1% rule at list price ($2k rent vs $129k).
- Recommended offer: $127k (1.5% below list) — sets the bar for market timing.
- Cap rate 8.7% vs local median 4.6% in Port Huron — top-decile yield for the area; either an underpriced asset or a hidden risk that comps aren't pricing in. Stress-test before assuming the spread holds.
Location & tenants
- Location reads 65/100 on livability (#445 in MI) — a middle-class / working-renter tenant base. Strengths: cost of living A+, housing A+; Watch: amenities C-, health & safety D, schools F.
- Port Huron Area School District (suburban): math 23% / reading 37% proficiency, ranked #368 of 540 in MI (top 68%) — families likely to look elsewhere, expect single-tenant / working-renter base with shorter leases.
- Market conditions: Rents rising (+3.6%/yr); 220 active listings in the ZIP; 232 units permitted in St. Clair County in 2024 (0 in 5+ unit buildings).
- This rent runs 40% of the median local income ($53k/yr) — at the standard rent-burdened threshold; future hikes will face affordability resistance.
Forward outlook
- Local home prices are declining (-3.0%/yr); year-one equity from $892 of loan paydown is wiped out by about $4k of value loss. Plan a longer hold.
- St. Clair County population projected at -20% by 2050 — secular population decline; favor cash flow + early exit over multi-decade hold.
Negotiation context
- It's been on market 19 days — a 2% lower offer ($127k) is reasonable based on typical stale-listing flexibility.
- 2 sale attempts since 2y ago; this cycle's ask has dropped $21k (14%) from the opening price — seller is motivated, your offer sets the floor, not the list.
Risks & watch-outs
- Watch-outs: property tax is 4.0% of price; built in 1907 — expect roof / HVAC / electrical / plumbing capex.
Questions for the listing agent
- Built in 1907 — when were the roof, HVAC, electrical panel, plumbing, and water heater last replaced?
- Property tax is high relative to price — has the assessment been appealed recently, and will the sale trigger a re-assessment?
- Is there a deadline driving the sale (1031 exchange, divorce, estate, relocation)? That informs how much negotiation room exists.
- Schools are F-rated, which usually means shorter tenancies and higher turnover. Who's the typical renter profile here, and what's been the actual vacancy rate?
- Crime grade is F in this area — have there been break-ins, vandalism, or insurance claims at this property in the last 3 years? What carrier currently insures it and at what premium?
- What's the average days-on-market for RENTAL listings here right now (not sales)? A rising rental-DOM trend means longer vacancies and softer asking-rent achievability than the comps imply.
- What's the recent tenant-quality profile in this submarket — average credit score on applications, eviction rate, late-payment / NSF rate, and stable-employment percentage? A property-management company in the area should have these aggregated.
- How much new for-sale + rental construction is in the pipeline within 1–3 miles? Heavy new supply typically softens prices + rents 12–24 months out; constrained supply supports both.
Investment metrics
- 1% rule
- 1.38% ✓
- Cap rate
- 8.65%
- Cash-on-cash
- 8.42%
- DSCR
- 1.37
- GRM
- 6.0
CMA / ARV
No comps found within radius.
Projected returns pro-forma
-3.0% appreciation · 3.61% rent growth · sell at horizon
- IRR
- -2.5%
- Equity multiple
- 0.90×
- Total profit
- $-3,472
- Equity at exit
- $19,234
- IRR
- 8.1%
- Equity multiple
- 1.64×
- Total profit
- $23,112
- Equity at exit
- $11,154
Cash invested: $36,120 (down + closing). Projections, not guarantees.
Landlord ↔ Tenant lean methodology
- Overall (STATE)
- 62 Landlord-Friendly
- State Michigan
- 62 Landlord-Friendly · EVEN
- County
- — inherits STATE
- City
- — inherits STATE
ZIP-level market 48060
- Rents YoY
- 3.6%
- Active inventory
- 220
- Price-to-rent
- 6.0×
Monthly cashflow live
- Estimated rent
- $1,786 medium interval (Pro) →
- Mortgage (P&I)
- −$676
- Tax from tax record
- −$427 /mo · $5,127/yr
- Insurance
- −$54
- HOA
- −$0
- Vacancy / Maint / Mgmt
- −$375
- Net cashflow
- $253
Break-even live
UW: 25.0% down · 7.5% · 30yr · 1.5% tax · 5.0% vac · 8.0% maint · 8.0% mgmt
Financing live
Cash to close
- Down payment
- $32,250
- Closing costs
- $3,870
- Reserves months
- —
- Total cash needed
- —
Loan-product check · same deal, 3 products live
Conventional
25% down · 7.5% · 30yr
- Down + closing
- —
- Monthly P&I
- —
- Monthly cashflow
- —
- DSCR
- —
- Eligible?
- —
Personal DTI + credit; lowest rate.
DSCR
20% down · 8.5% · 30yr
- Down + closing
- —
- Monthly P&I
- —
- Monthly cashflow
- —
- DSCR
- —
- Eligible?
- —
No personal income docs; deal must DSCR.
Hard money
10% down · 12.0% · 12mo
- Down + closing
- —
- Monthly P&I
- —
- Monthly cashflow
- —
- DSCR
- —
- Eligible?
- —
Short-term bridge; refi at stabilization.
Listing history 17 events
-
2026-06-18days on market $129,000 Active 19 DOM
-
2026-06-17remarks 699-char remark
-
2026-06-17days on market $129,000 Active 18 DOM
-
2026-06-16days on market $129,000 Active 17 DOM
-
2026-06-15price $129,000 Active 16 DOM
-
2026-06-15days on market $150,000 Active 16 DOM
-
2026-06-13days on market $150,000 Active 14 DOM
-
2026-06-13days on market $150,000 Active 13 DOM
-
2026-06-09days on market $150,000 Active 10 DOM
-
2026-06-08days on market $150,000 Active 9 DOM
-
2026-06-07remarks 545-char remark
-
2026-06-07days on market $150,000 Active 8 DOM
-
2026-06-04days on market $150,000 Active 5 DOM
-
2026-06-03days on market $150,000 Active 4 DOM
-
2026-06-02days on market $150,000 Active 3 DOM
-
2026-06-01days on market $150,000 Active 2 DOM
-
2026-05-31status $150,000 Active 1 DOM
ⓘ Source: listings_history table (triggers on properties + properties_extension) + one-shot
backfill from property_details.listing_events for pre-trigger history.
Tax reassessment forecast MI · Partial reset (capped growth)
- Current annual tax
- $5,127 · $427/mo
- Projected year-2 tax
- $5,127 · $427/mo
- Expected delta
- $0/yr ($0/mo · 0.0%)
ⓘ Screening estimate from a state-policy table — verify with the county assessor before closing.
Climate risk First Street
- Flood 1/10 Low FEMA zone X (unshaded) · 0% chance over 30 yrs
- Wildfire 1/10 Low
- Heat 2/10 Low 7 d/yr ≥98°F today · 14 d/yr by 30 yrs out
- Wind 1/10 Low
- Air quality 2/10 Low 1 unhealthy d/yr today · 2 by 30 yrs out
Nearby sold comps map
Loading sold comps map…
Walkable amenities ~0.75 mi
Loading nearby amenities…
Taxation est. · year 1
- Rental income
- $21,431
- − Mortgage interest
- −$7,226
- − Property taxes
- −$5,127
- − Insurance
- −$645
- − Repairs & maintenance
- −$1,714
- − Management
- −$1,714
- − Depreciation
- −$3,753
- Taxable income
- $1,251
- Est. tax owed @ 24.0%
- −$300
- After-tax cash flow
- $2,740/yr
For passive investors: Depreciation is non-cash, so a rental often shows a tax loss while cash-flowing — sheltering income. Rental losses are passive: they offset passive income freely, and up to $25,000/yr can offset ordinary (W-2) income if you actively participate and your MAGI is under $100k (phasing out to $0 by $150k); unused losses carry forward. On sale, claimed depreciation is recaptured at up to 25%, and gains may owe capital-gains tax (a 1031 exchange can defer both). Figures are a year-1 estimate at your 24.0% rate — not tax advice; consult a CPA.
Schools (NCES district)
- District
- Port Huron Area School District
- NCES district ID
- 2628830
- Math proficiency
- 23% ▼ -5.00%
- Reading proficiency
- 37% ▼ -2.00%
- Median HH income
- $42,093
- Composite
- 25.4/100
- National rank
- #7462
- State rank
- #368 of 540 in MI
Livability — Port Huron
- Score
- 65/100
- State rank
- #445
- US rank
- #12478
Category grades
Schools grade is shown separately in the Schools card above.
Census & demographics
- Census place
- Port Huron, MI
- County
- Saint Clair County · 44,760 people
- City population
- 39,342
- Metro
- Detroit-Warren-Dearborn, MI
- Population (ZIP)
- 39,342
- Household income
- $53,018
- Rent vs Own
- Severe rent burden
- 1808.0
Population outlook (St. Clair County) Hauer SSP2
- Today (2025)
- 154,587 people
- By 2030
- 150,031 · -2.9%
- By 2040
- 138,177 · -10.6%
- By 2050
- 124,390 · -19.5%
- By 2075
- 95,825 · -38.0%
- By 2100
- 68,672 · -55.6%
Race, ethnicity, and origin ACS 2023
- Neighborhood character
- Predominantly White (80%)
- Race & ethnicity
- White 80% Black 7% Two or more races 7% Hispanic / Latino 6%
- Hispanic origin (detail)
- Mexican 4%
- Common ancestry
- Romanian 6% Lithuanian 4% Slovak 3%
- Foreign-born
- 2% · Canada
- Languages at home
- 97% English-only · Spanish 2%
Political lean MEDSL · St. Clair
- 2024 margin
- Solid R (+34.6) · D 32.0% · R 66.6% · Other 1.4%
- 2008→2024 swing
- -37.3pp toward R · 2008: 2.6pp · 2024: -34.6pp
- All cycles
- 2024: R+34.6 2020: R+30.2 2016: R+31.4 2012: R+7.1 2008: D+2.6
Not yet ingested
- Civics
- —
Market trends
- HPI YoY
- ▼ -134.75%
- Current HPI
- 177.2401
- Rent YoY
- ▲ 3.61%
- Metro
- Detroit-Warren-Dearborn, MI
- State GDP YoY
- ▲ 1.37%
- F500 in state
- 28
Industry mix (Fortune 500 HQ in MI)
| Industry | F500 HQs | Revenue |
|---|---|---|
| Automotive Parts | 3 | $48B |
|
||
| Automotive | 2 | $372B |
|
||
| Chemicals | 1 | $45B |
|
||
| Automotive Retail | 1 | $29B |
|
||
| Healthcare / Medical Devices | 1 | $23B |
|
||
| Automotive Technology | 1 | $20B |
|
||
Price history
+0.0% since first listed7 events — show timeline
- 2026-05-30 Coming Soon $150,000 MiRealSource-MiMLS
- 2024-06-21 Sold (MLS) $150,000 MiRealSource-MiMLS
- 2024-06-21 Sold (MLS) $150,000 REALCOMP
- 2024-06-06 Pending — REALCOMP
- 2024-06-06 Pending — MiRealSource-MiMLS
- 2024-05-31 Listed $150,000 MiRealSource-MiMLS
- 2024-05-31 Listed $150,000 REALCOMP
Property tax history
+11.5%/yrLatest (2025): $5,127 · +139.8% YoY. Source: county tax records.
Cash-flow waterfall
monthlySold comps — $/sqft
last 12 mo · ≤1 miLoading sold comps…