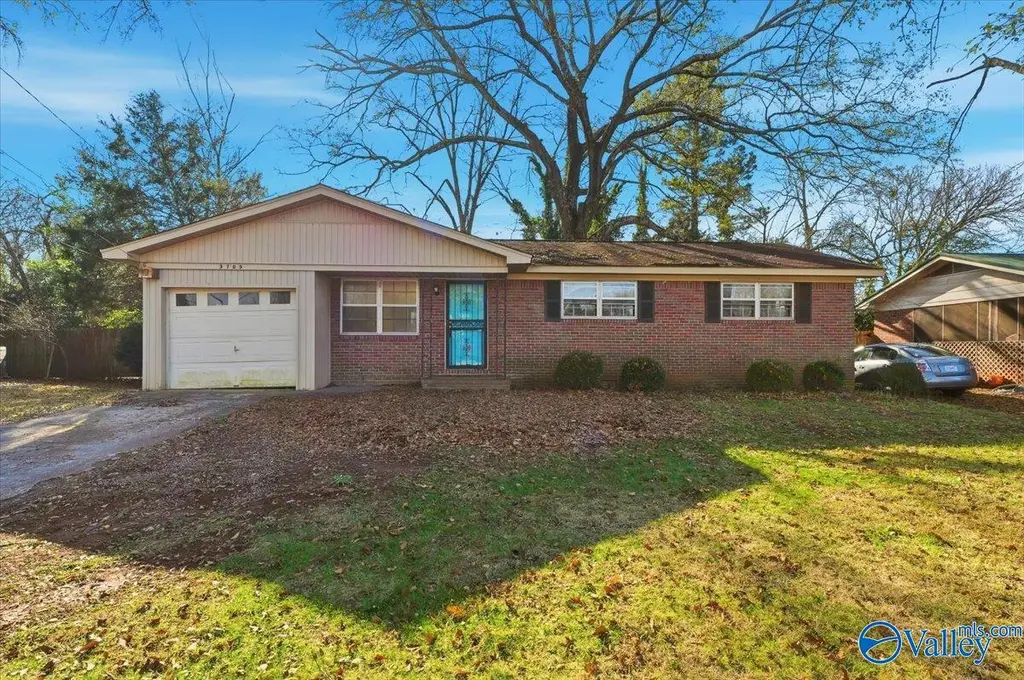
3709 S Westdale Ct SW · Huntsville, AL
Flood risk 1/10 · Minimal
- FEMA flood zone
- X (unshaded)
- Chance of flooding over 30 yrs
- 0.0%
- Est. flood insurance / yr
- $507 – $1,088
Fire risk 2/10 · Minimal
- Est. fire insurance / yr
- $916 – $1,700
Heat risk 6/10 · Moderate
- Hot days now (above 105°F)
- 7 days/yr
- Hot days in 30 yrs
- 21 days/yr
Wind risk 4/10 · Minor
- Chance of severe wind over 30 yrs
- 19.0%
Air-quality risk 2/10 · Minimal
- Unhealthy air days now
- 1 days/yr
- Unhealthy air days in 30 yrs
- 1 days/yr
Risk factors via First Street. Map © Google.
Why this score? — see what drove the D grade
The composite is a weighted blend of 9 inputs, each scored 0–100. Each bar is that input's sub-score; the figure is the points it added to the 100-point composite (weight × sub-score).
- ARV discount +11.4/15.0
- Cash flow +11.0/30.0
- Livability +4.1/5.0
- DSCR +3.2/10.0
- Rent growth +3.0/5.0
- Schools +2.9/10.0
- Condition / age +2.5/5.0
- 1% rule +2.3/10.0
- Appreciation +0.0/10.0
$160,000
🖨 Deal sheet (PDF) 📄 Offer letter ✓ Due diligence
Listing remarks MLS
Charming 3 Bedroom, full brick home! Conveniently located near the heart of Huntsville. This home features hardwood floors throughout, tile in the kitchen and bathrooms. Situated on a spacious home site with mature trees.
Key facts
- Tile in the kitchen
- Hardwood floors
- Full brick home
Tags
Neighborhood map
What this means for you Summary
Snapshot
- This is a 3-bed/0.5-bath single-family listed at $160k.
Deal economics
- At list price, monthly cash flow is $-67 ($-805/yr) — negative.
- To cash-flow at today's rent, offer at most $148k (7.4% below list).
- To meet the 1% rule (rent ≥ 1% of price), the offer needs to be $117k (26.6% below list).
- Recommended offer: $117k (26.6% below list) — sets the bar for 1% rule.
- Cap rate 5.8% vs local median 3.8% in Huntsville — top-decile yield for the area; either an underpriced asset or a hidden risk that comps aren't pricing in. Stress-test before assuming the spread holds.
Location & tenants
- Location reads 82/100 on livability (#3 in AL, #1,082 nationally) — a professional / high-income tenant draw. Strengths: commute A+, cost of living A+, housing A+; Watch: crime F.
- Huntsville City (urban): math 21% / reading 46% proficiency, ranked #48 of 129 in AL (top 37%) — families likely to look elsewhere, expect single-tenant / working-renter base with shorter leases.
- Zoned schools: Mcdonnell Elementary School (math 2% / reading 27%, grade F, #508 of 627 statewide, top 84%, 528 students, 85% FRL); Virgil Grissom High School (math 34% / reading 40%, grade F, #39 of 305 statewide, top 13%, 1,974 students, 43% FRL) — zoned schools average 64% FRL vs 46% district-wide (18 pts higher); higher-poverty schools than district average — tighter screening recommended.
- Market conditions: Rents rising (+1.8%/yr); 133 active listings in the ZIP; 40 comparable units currently listed for rent nearby; rentals lingering (median 46d on market — plan ~5-8 weeks vacancy on turnover, expect pricing pressure); 50% of comp listings sitting > 30 days — soft ceiling on asking rent; lower-income renter base — watch delinquency; 4,709 units permitted in Madison County in 2024 (1,186 in 5+ unit buildings).
- This rent runs 40% of the median local income ($35k/yr) — at the standard rent-burdened threshold; future hikes will face affordability resistance.
Forward outlook
- Local home prices are declining (-3.0%/yr); year-one equity from $1k of loan paydown is wiped out by about $5k of value loss. Plan a longer hold.
- Madison County population projected at +18% by 2050 — long-run rental-demand tailwind backs the buy-and-hold thesis.
Negotiation context
- It's been on market 181 days — a 12% lower offer ($141k) is reasonable based on typical stale-listing flexibility.
Risks & watch-outs
- Climate carrying-cost: extreme-heat days projected 7→21/yr by 2055 (HVAC capex compounding) — expect insurance premiums to compound above CPI over the hold.
Questions for the listing agent
- What do current leases actually rent for vs. the listed asking? Can we see a recent rent roll and the last 12 months of T-12 income?
- It's been on market 181 days. Have you received any prior offers? Is the seller open to a 27% concession, seller financing, or rate buy-down credit?
- Built in 1965 — when were the roof, HVAC, electrical panel, plumbing, and water heater last replaced?
- Why hasn't it sold? Are there any deal-killer items the seller is aware of (foundation, flood, title, zoning, code violations)?
- Is there a deadline driving the sale (1031 exchange, divorce, estate, relocation)? That informs how much negotiation room exists.
- Crime grade is F in this area — have there been break-ins, vandalism, or insurance claims at this property in the last 3 years? What carrier currently insures it and at what premium?
- The area grade is low — what's the realistic commute time and amenity access for the typical tenant pool here? Any planned neighborhood developments (good or bad) we should know about?
- What's the average days-on-market for RENTAL listings here right now (not sales)? A rising rental-DOM trend means longer vacancies and softer asking-rent achievability than the comps imply.
- What's the recent tenant-quality profile in this submarket — average credit score on applications, eviction rate, late-payment / NSF rate, and stable-employment percentage? A property-management company in the area should have these aggregated.
- How much new for-sale + rental construction is in the pipeline within 1–3 miles? Heavy new supply typically softens prices + rents 12–24 months out; constrained supply supports both.
Investment metrics
- 1% rule
- 0.73% ✗
- Cap rate
- 5.79%
- Cash-on-cash
- -1.80%
- DSCR
- 0.92
- GRM
- 11.4
CMA / ARV
- ARV (median comp)
- $175,384
- List price
- $160,000
- Delta
- -8.77%
- Verdict
- FAIR
- Comps
- 20 within 1.0 mi
Show comp detail 12 sales within ~0.75 mi
| Address | Dist | Beds/Ba | Sqft | Sold | Price | $/sf | Match |
|---|---|---|---|---|---|---|---|
| 4010 Telstar Cir SW | 0.33mi | 4/2.0 (+1) | 1,101 (+1%) | 1mo | $189,500 | $172 | 71 |
| 3820 Troy Swasey Blvd SW | 0.38mi | 3/1.0 | 1,038 (-5%) | 8mo | $157,000 | $151 | 66 |
| 3307 SW Drake Ave | 0.55mi | 3/1.0 | 1,046 (-4%) | 2mo | $120,000 | $115 | 64 |
| 4011 Centaur Blvd SW | 0.42mi | 3/1.5 | 1,026 (-6%) | 9mo | $125,000 | $122 | 59 |
| 3916 Troy Swasey Blvd SW | 0.32mi | 3/2.0 | 1,208 (+11%) | 10mo | $124,000 | $103 | 53 |
| 3500 Spruce Ave | 0.68mi | 3/1.0 | 1,136 (+4%) | 10mo | $159,000 | $140 | 51 |
| 3507 Drake Ave SW | 0.40mi | 3/2.0 | 980 (-10%) | 14mo | $148,000 | $151 | 47 |
| 3610 Penny St SW | 0.63mi | 3/1.0 | 960 (-12%) | 4mo | $110,000 | $115 | 45 |
| 3118 Hale Dr | 0.52mi | 3/1.0 | 940 (-14%) | 13mo | $153,000 | $163 | 40 |
| 4005 Patty Ann Dr SW | 0.39mi | 2/2.0 (-1) | 1,239 (+14%) | 10mo | $199,999 | $161 | 40 |
| 4317 Triana Blvd | 0.65mi | 2/1.0 (-1) | 950 (-13%) | 8mo | $135,900 | $143 | 35 |
| 3620 Cerro Vista St SW | 0.54mi | 4/2.0 (+1) | 1,230 (+13%) | 16mo | $195,000 | $159 | 29 |
Match score weights: distance 35% · size 25% · config 20% · recency 20%. Top-matched comps best support the ARV.
Projected returns pro-forma
-3.0% appreciation · 1.82% rent growth · sell at horizon
- IRR
- -20.5%
- Equity multiple
- 0.29×
- Total profit
- $-31,626
- Equity at exit
- $23,857
- IRR
- -16.3%
- Equity multiple
- 0.13×
- Total profit
- $-38,765
- Equity at exit
- $13,834
Cash invested: $44,800 (down + closing). Projections, not guarantees.
Landlord ↔ Tenant lean methodology
- Overall (STATE)
- 90 Strongly Landlord-Friendly
- State Alabama
- 90 Strongly Landlord-Friendly · R+15
- County
- — inherits STATE
- City
- — inherits STATE
ZIP-level market 35805
- Home prices YoY
- -17.4%
- Rents YoY
- 1.8%
- Active inventory
- 133
- Price-to-rent
- 11.4×
Monthly cashflow live
- Estimated rent
- $1,174 high interval (Pro) →
- Mortgage (P&I)
- −$839
- Tax from tax record
- −$89 /mo · $1,066/yr
- Insurance
- −$67
- HOA
- −$0
- Vacancy / Maint / Mgmt
- −$247
- Net cashflow
- $-67
Break-even live
Sensitivity live
| Price | -10% $24 | -5% $-22 | +0% $-67 | +5% $-112 | +10% $-158 |
|---|---|---|---|---|---|
| Rent | -10% $-160 | -5% $-113 | +0% $-67 | +5% $-21 | +10% $26 |
| Rate | -1.0pp $14 | -0.5pp $-26 | base $-67 | +0.5pp $-109 | +1.0pp $-151 |
UW: 25.0% down · 7.5% · 30yr · 1.5% tax · 5.0% vac · 8.0% maint · 8.0% mgmt
Financing live
Cash to close
- Down payment
- $40,000
- Closing costs
- $4,800
- Reserves months
- —
- Total cash needed
- —
Loan-product check · same deal, 3 products live
Conventional
25% down · 7.5% · 30yr
- Down + closing
- —
- Monthly P&I
- —
- Monthly cashflow
- —
- DSCR
- —
- Eligible?
- —
Personal DTI + credit; lowest rate.
DSCR
20% down · 8.5% · 30yr
- Down + closing
- —
- Monthly P&I
- —
- Monthly cashflow
- —
- DSCR
- —
- Eligible?
- —
No personal income docs; deal must DSCR.
Hard money
10% down · 12.0% · 12mo
- Down + closing
- —
- Monthly P&I
- —
- Monthly cashflow
- —
- DSCR
- —
- Eligible?
- —
Short-term bridge; refi at stabilization.
Rent comps 40 comps
| Address | Beds | Baths | Sqft | Rent | $/sqft | DOM | Units | Dist |
|---|---|---|---|---|---|---|---|---|
| 4121 Newson Rd SW Apt B12 Huntsville, AL | 2.0 | 1.0 | 750 | $950 | $1.27 | 15d | 1 | 0.05mi |
| 4111 Newson Rd SW Huntsville, AL | 1.0–2.0 | 1.0–1.5 | 775 | $800 | $1.03 | 15d | 2 | 0.11mi |
| 4118 Newson Rd SW Huntsville, AL | 2.0 | 1.0 | 650 | $1,099 | $1.69 | 15d | 14 | 0.17mi |
| 3906 Thomas Rd SW Unit 3906-E Huntsville, AL | 2.0 | 1.0 | 790 | $1,025 | $1.30 | 45d | 1 | 0.23mi |
| 3901 Newson Rd SW Huntsville, AL | 2.0 | 1.0 | 936 | $1,199 | $1.28 | 45d | 1 | 0.26mi |
| 3815 Newson Rd SW Apt B6 Huntsville, AL | 2.0 | 1.0 | 850 | $850 | $1.00 | 15d | 1 | 0.28mi |
| 3815 Newson Rd SW Unit C05 Huntsville, AL | 2.0 | 1.0 | 750 | $850 | $1.13 | 45d | 1 | 0.31mi |
| 3311 Wilks Pl SW Huntsville, AL | 3.0 | 1.0 | 1041 | $1,450 | $1.39 | 25d | 1 | 0.32mi |
| 3905 Barclay Ave SW Unit 1 Huntsville, AL | 2.0 | 1.0 | 800 | $1,050 | $1.31 | 45d | 1 | 0.33mi |
| 3801 Thomas Rd SW Unit 3814-01 Huntsville, AL | 2.0 | 1.0 | 825 | $1,025 | $1.24 | 45d | 1 | 0.34mi |
| 3801 Thomas Rd SW Unit 3912-06 Huntsville, AL | 2.0 | 1.0 | 795 | $925 | $1.16 | 45d | 1 | 0.34mi |
| 3801 Thomas Rd SW Unit 3807-09 Huntsville, AL | 3.0 | 2.0 | 950 | $1,225 | $1.29 | 25d | 1 | 0.34mi |
| 3801 Thomas Rd SW Unit 3910-E Huntsville, AL | 2.0 | 1.0 | 795 | $925 | $1.16 | 25d | 1 | 0.34mi |
| 3801 Thomas Rd SW Unit 3807-04 Huntsville, AL | 2.0 | 1.0 | 825 | $1,025 | $1.24 | 25d | 1 | 0.34mi |
| 4006 Foster Ave SW Apt A Huntsville, AL | 2.0 | 1.0 | 803 | $1,099 | $1.37 | 25d | 1 | 0.34mi |
| 4100 Broyles Ave SW Apt 3 Huntsville, AL | 2.0 | 1.0 | 750 | $750 | $1.00 | 45d | 1 | 0.37mi |
| 4008 Penny St SW Unit a Huntsville, AL | 2.0 | 1.0 | 720 | $795 | $1.10 | 45d | 1 | 0.38mi |
| 3818 Troy Swasey Blvd SW Huntsville, AL | 2.0 | 1.0 | 790 | $1,098 | $1.39 | 22d | 1 | 0.40mi |
| 4101 Mc Vay St SW Unit 5 Huntsville, AL | 2.0 | 1.0 | 800 | $850 | $1.06 | 45d | 1 | 0.40mi |
| 3910 McVay St SW Huntsville, AL | 2.0 | 2.0 | 1104 | $1,100 | $1.00 | 25d | 1 | 0.46mi |
| 4523 Foster Ave SW Apt B3 Huntsville, AL | 2.0 | 1.0 | 850 | $950 | $1.12 | 15d | 1 | 0.46mi |
| 4110 Broyles Ave SW Huntsville, AL | 3.0 | 2.0 | 1100 | $1,295 | $1.18 | 25d | 1 | 0.47mi |
| 3905 Mc Calley Pl SW Huntsville, AL | 3.0 | 2.0 | 1044 | $1,595 | $1.53 | 45d | 1 | 0.47mi |
| 4510 Foster Ave SW Unit 11 Huntsville, AL | 2.0 | 1.0 | 950 | $795 | $0.84 | 45d | 1 | 0.47mi |
| 4117 Triana Blvd SW Huntsville, AL | 2.0 | 1.5 | 980 | $995 | $1.02 | 45d | 1 | 0.55mi |
| 3111 Hale Dr SW Huntsville, AL | 3.0 | 1.5 | 1100 | $1,550 | $1.41 | 22d | 1 | 0.59mi |
| 3800 Squaw Valley Dr SW Huntsville, AL | 2.0–3.0 | 2.0 | 1062 | $1,235 | $1.16 | 22d | 6 | 0.62mi |
| 3813 SW Triana Blvd Unit 201 D Huntsville, AL | 2.0 | 2.0 | 784 | $895 | $1.14 | 45d | 1 | 0.63mi |
| 4401 Patton Rd SW Unit 7 Huntsville, AL | 2.0 | 1.0 | 800 | $850 | $1.06 | 45d | 1 | 0.64mi |
| 3902 Cobb Rd SW Huntsville, AL | 2.0 | 2.0 | 784 | $995 | $1.27 | 45d | 1 | 0.66mi |
| 3502 Penny St SW Unit B Huntsville, AL | 3.0 | 2.0 | 1000 | $1,200 | $1.20 | 45d | 1 | 0.68mi |
| 3009 Hillsboro Rd SW Huntsville, AL | 3.0 | 1.0 | 1000 | $1,250 | $1.25 | 25d | 1 | 0.68mi |
| 4412 Gazette Dr SW Huntsville, AL | 3.0 | 1.0 | 975 | $1,150 | $1.18 | 45d | 1 | 0.68mi |
| 4412 Gazette Dr SW Huntsville, AL | 3.0 | 1.0 | 975 | $1,150 | $1.18 | 25d | 1 | 0.68mi |
| 3218 Fairacres Rd SW Huntsville, AL | 3.0 | 1.5 | 1105 | $1,300 | $1.18 | 45d | 1 | 0.69mi |
| 3902 Cobb Rd Apt 103J Huntsville, AL | 2.0 | 2.0 | 784 | $895 | $1.14 | 45d | 1 | 0.69mi |
| 3218 Joslin St SW Huntsville, AL | 3.0 | 1.5 | 1107 | $1,495 | $1.35 | 25d | 1 | 0.69mi |
| 3505 Bradley St SW Huntsville, AL | 2.0 | 1.0 | 1192 | $950 | $0.80 | 25d | 1 | 0.69mi |
| 3606 Mc Vay St SW Unit A Huntsville, AL | 2.0 | 1.0 | 754 | $900 | $1.19 | 22d | 1 | 0.70mi |
| 3806 Cobb Rd SW Huntsville, AL | 3.0 | 2.0 | 1370 | $1,195 | $0.87 | 45d | 1 | 0.75mi |
Listing history 17 events
-
2026-06-22days on market $160,000 Active 181 DOM
-
2026-06-18days on market $160,000 Active 178 DOM
-
2026-06-17days on market $160,000 Active 177 DOM
-
2026-06-16days on market $160,000 Active 176 DOM
-
2026-06-15days on market $160,000 Active 175 DOM
-
2026-06-14days on market $160,000 Active 173 DOM
-
2026-06-10days on market $160,000 Active 170 DOM
-
2026-06-09days on market $160,000 Active 169 DOM
-
2026-06-08days on market $160,000 Active 168 DOM
-
2026-06-07days on market $160,000 Active 167 DOM
-
2026-06-03days on market $160,000 Active 163 DOM
-
2026-06-02days on market $160,000 Active 162 DOM
-
2026-06-01days on market $160,000 Active 161 DOM
-
2026-05-31days on market $160,000 Active 160 DOM
-
2026-05-30days on market $160,000 Active 159 DOM
-
2026-03-31price $160,000 221-char remark
Show marketing remark (221 chars)
Charming 3 Bedroom, full brick home! Conveniently located near the heart of Huntsville. This home features hardwood floors throughout, tile in the kitchen and bathrooms. Situated on a spacious home site with mature trees.
-
2025-12-22$170,000 Active 221-char remark
Show marketing remark (221 chars)
Charming 3 Bedroom, full brick home! Conveniently located near the heart of Huntsville. This home features hardwood floors throughout, tile in the kitchen and bathrooms. Situated on a spacious home site with mature trees.
ⓘ Source: listings_history table (triggers on properties + properties_extension) + one-shot
backfill from property_details.listing_events for pre-trigger history.
Tax reassessment forecast AL · Resets to sale price
- Current annual tax
- $1,066 · $89/mo
- Projected year-2 tax
- $1,066 · $89/mo
- Expected delta
- $0/yr ($0/mo · 0.0%)
ⓘ Screening estimate from a state-policy table — verify with the county assessor before closing.
Climate risk First Street
- Flood 1/10 Low FEMA zone X (unshaded) · 0% chance over 30 yrs
- Wildfire 2/10 Low
- Heat 6/10 Major 7 d/yr ≥105°F today · 21 d/yr by 30 yrs out
- Wind 4/10 Moderate 19% chance of damaging wind over 30 yrs
- Air quality 2/10 Low 1 unhealthy d/yr today · 1 by 30 yrs out
Nearby sold comps map
Loading sold comps map…
Walkable amenities ~0.75 mi
Loading nearby amenities…
Taxation est. · year 1
- Rental income
- $14,089
- − Mortgage interest
- −$8,962
- − Property taxes
- −$1,066
- − Insurance
- −$800
- − Repairs & maintenance
- −$1,127
- − Management
- −$1,127
- − Depreciation
- −$4,655
- Taxable loss
- −$3,649
- Est. tax savings @ 24.0%
- +$876
- After-tax cash flow
- $71/yr
For passive investors: Depreciation is non-cash, so a rental often shows a tax loss while cash-flowing — sheltering income. Rental losses are passive: they offset passive income freely, and up to $25,000/yr can offset ordinary (W-2) income if you actively participate and your MAGI is under $100k (phasing out to $0 by $150k); unused losses carry forward. On sale, claimed depreciation is recaptured at up to 25%, and gains may owe capital-gains tax (a 1031 exchange can defer both). Figures are a year-1 estimate at your 24.0% rate — not tax advice; consult a CPA.
Schools (NCES district)
- District
- Huntsville City
- NCES district ID
- 0101800
- Math proficiency
- 21% ▼ -23.00%
- Reading proficiency
- 46% ▬ 0.00%
- Median HH income
- $48,264
- Composite
- 28.84/100
- National rank
- #6647
- State rank
- #48 of 129 in AL
Livability — Huntsville
- Score
- 82/100
- State rank
- #3
- US rank
- #1082
Category grades
Schools grade is shown separately in the Schools card above.
Census & demographics
- Census place
- Huntsville, AL
- County
- Madison County · 380,832 people
- City population
- 220,435
- Metro
- Huntsville, AL
- Population (ZIP)
- 20,856
- Household income
- $35,385
- Rent vs Own
- Severe rent burden
- 1750.0
Population outlook (Madison County) Hauer SSP2
- Today (2025)
- 392,086 people
- By 2030
- 409,788 · +4.5%
- By 2040
- 440,557 · +12.4%
- By 2050
- 460,990 · +17.6%
- By 2075
- 502,872 · +28.3%
- By 2100
- 513,623 · +31.0%
Race, ethnicity, and origin ACS 2023
- Neighborhood character
- Diverse neighborhood (Simpson 0.69)
- Race & ethnicity
- White 40% Black 31% Hispanic / Latino 24% Two or more races 8%
- Hispanic origin (detail)
- Mexican 17% Puerto Rican 2%
- Common ancestry
- Lithuanian 1% Slovak 1% Serbian 1%
- Foreign-born
- 16% · Canada, Jamaica
- Languages at home
- 76% English-only · Spanish 22% German/W. Germanic 1%
Political lean MEDSL · Madison
- 2024 margin
- Lean R (+9.0) · D 44.7% · R 53.7% · Other 1.6%
- 2008→2024 swing
- +6.0pp toward D · 2008: -14.9pp · 2024: -9.0pp
- All cycles
- 2024: R+9.0 2020: R+8.0 2016: R+16.8 2012: R+18.7 2008: R+14.9
Not yet ingested
- Civics
- —
Market trends
- HPI YoY
- ▼ -48.03%
- Current HPI
- 228.6963
- Rent YoY
- ▲ 1.82%
- Metro
- Huntsville, AL
- State GDP YoY
- ▲ 2.94%
- F500 in state
- 4
Industry mix (Fortune 500 HQ in AL)
| Industry | F500 HQs | Revenue |
|---|---|---|
| Financial Services | 1 | $8B |
|
||
| Healthcare | 1 | $5B |
|
||
Price history
-5.9% since first listed2 events — show timeline
- 2026-03-31 Price Changed $160,000 VMLS
- 2025-12-22 Listed $170,000 VMLS
Property tax history
+9.5%/yrLatest (2024): $1,066 · +0.0% YoY. Source: county tax records.
Cash-flow waterfall
monthlySold comps — $/sqft
last 12 mo · ≤1 miLoading sold comps…