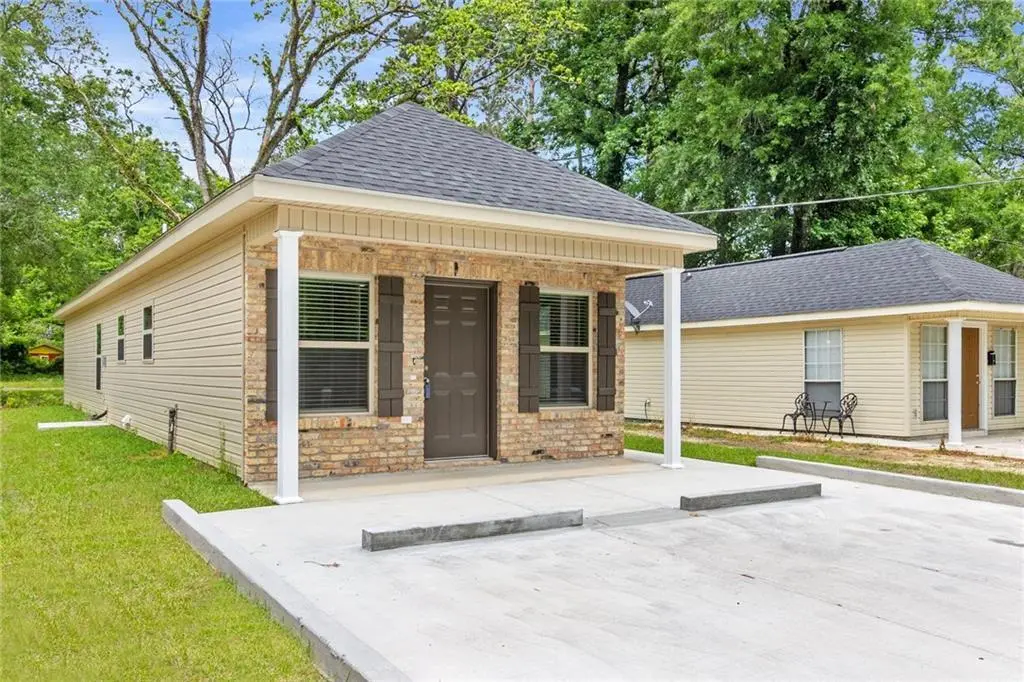
105 E Stovall St · Hammond, LA
Flood risk No data
- FEMA flood zone
- —
- Chance of flooding over 30 yrs
- —
- Est. flood insurance / yr
- —
Fire risk No data
- Est. fire insurance / yr
- —
Heat risk No data
- Hot days now (above threshold)
- —
- Hot days in 30 yrs
- —
Wind risk No data
- Chance of severe wind over 30 yrs
- —
Air-quality risk No data
- Unhealthy air days now
- —
- Unhealthy air days in 30 yrs
- —
Risk factors via First Street. Map © Google.
Why this score? — see what drove the D+ grade
The composite is a weighted blend of 9 inputs, each scored 0–100. Each bar is that input's sub-score; the figure is the points it added to the 100-point composite (weight × sub-score).
- Cash flow +16.1/30.0
- ARV discount +11.9/15.0
- DSCR +5.0/10.0
- 1% rule +4.4/10.0
- Condition / age +4.0/5.0
- Livability +3.5/5.0
- Rent growth +2.6/5.0
- Schools +2.0/10.0
- Appreciation +0.0/10.0
$149,900
🖨 Deal sheet (PDF) 📄 Offer letter ✓ Due diligence
Listing remarks MLS
New Construction! Two bedrooms and two full baths. No carpet and never flooded. Walking distance to downtown Hammond eateries, parks and shopping. Great Opportunity for a first-time homebuyer to invest and/or for an investor to start their rental portfolio. Vacant and easy to show. Builder Incentives Available. Some photos have been virtually staged and/or digitally enhance to illustrate the property potential.
Key facts
- New construction
- 2 parking spots
- Built 2025
Tags
Property features AI
Exterior
- Parking: Driveway with two parking spaces
- Security: Smoke detector(s)
- Utilities: Public water; Public sewer
- Home design: Single-story home; New construction (built by M&O Construction LLC, never occupied); Facing not specified
- Construction: Brick and vinyl siding exterior; Shingle roof; Built on slab foundation; New construction
- Exterior features: City lot, rectangular shape; Lot dimensions approximately 40 x 94
Interior
- Kitchen: Range
- Bedrooms: Total rooms: 4
- Bathrooms: 2 full bathrooms
- Heating & cooling: Central heating; Central air conditioning
- Interior features: Smoke detector(s)
Neighborhood map
What this means for you Summary
Snapshot
- This is a 2-bed/2.0-bath single-family listed at $150k. Condition is rated good.
Deal economics
- At list price, monthly cash flow is $78 ($935/yr) — positive.
- The deal already cash-flows at list — no discount required.
- To meet the 1% rule (rent ≥ 1% of price), the offer needs to be $141k (5.9% below list).
- Recommended offer: $141k (5.9% below list) — sets the bar for 1% rule.
- Cap rate 6.9% vs local median 5.0% in Hammond — top-decile yield for the area; either an underpriced asset or a hidden risk that comps aren't pricing in. Stress-test before assuming the spread holds.
Location & tenants
- Location reads 69/100 on livability (#77 in LA) — a middle-class / working-renter tenant base. Strengths: cost of living A+, health & safety A+; Watch: amenities C-, commute D+, schools D.
- Tangipahoa Parish (rural): math 18% / reading 29% proficiency, ranked #63 of 98 in LA (top 64%) — low school quality limits family demand, transient renter base, plan for 1-2y turnover; 73% free/reduced lunch — lower-income household profile, screen leases tightly.
- Market conditions: Rents flat; 329 active listings in the ZIP; 15 comparable units currently listed for rent nearby; rentals lingering (median 44d on market — plan ~5-8 weeks vacancy on turnover, expect pricing pressure); 100% of comp listings sitting > 30 days — soft ceiling on asking rent; 1,085 units permitted in Tangipahoa Parish in 2024 (378 in 5+ unit buildings).
- This rent runs 33% of the median local income ($51k/yr) — at the standard rent-burdened threshold; future hikes will face affordability resistance.
Forward outlook
- Local home prices are declining (-3.0%/yr); year-one equity from $1k of loan paydown is wiped out by about $4k of value loss. Plan a longer hold.
- Tangipahoa County population projected at +22% by 2050 — long-run rental-demand tailwind backs the buy-and-hold thesis.
Negotiation context
- It's been on market 37 days — a 3% lower offer ($145k) is reasonable based on typical stale-listing flexibility.
- 4 sale attempts; this cycle's ask has dropped $10k (6%) from the opening price — seller is motivated, your offer sets the floor, not the list.
Questions for the listing agent
- It's been on market 37 days. Have you received any prior offers? Is the seller open to a 6% concession, seller financing, or rate buy-down credit?
- Is there a deadline driving the sale (1031 exchange, divorce, estate, relocation)? That informs how much negotiation room exists.
- Schools are D-rated, which usually means shorter tenancies and higher turnover. Who's the typical renter profile here, and what's been the actual vacancy rate?
- Crime grade is F in this area — have there been break-ins, vandalism, or insurance claims at this property in the last 3 years? What carrier currently insures it and at what premium?
- The area grade is low — what's the realistic commute time and amenity access for the typical tenant pool here? Any planned neighborhood developments (good or bad) we should know about?
- What's the average days-on-market for RENTAL listings here right now (not sales)? A rising rental-DOM trend means longer vacancies and softer asking-rent achievability than the comps imply.
- What's the recent tenant-quality profile in this submarket — average credit score on applications, eviction rate, late-payment / NSF rate, and stable-employment percentage? A property-management company in the area should have these aggregated.
- How much new for-sale + rental construction is in the pipeline within 1–3 miles? Heavy new supply typically softens prices + rents 12–24 months out; constrained supply supports both.
Investment metrics
- 1% rule
- 0.94% ✗
- Cap rate
- 6.92%
- Cash-on-cash
- 2.23%
- DSCR
- 1.10
- GRM
- 8.9
CMA / ARV
- ARV (median comp)
- $165,992
- List price
- $149,900
- Delta
- -9.69%
- Verdict
- FAIR
- Comps
- 20 within 1.0 mi
Show comp detail 6 sales within ~0.75 mi
| Address | Dist | Beds/Ba | Sqft | Sold | Price | $/sf | Match |
|---|---|---|---|---|---|---|---|
| 99 White St | 0.18mi | 3/2.0 (+1) | 1,000 (-7%) | 9mo | $70,000 | $70 | 67 |
| 1010 W Charles St | 0.59mi | 3/2.0 (+1) | 1,190 (+10%) | 1mo | $182,000 | $153 | 50 |
| 303 E Park Ave | 0.69mi | 2/2.0 | 1,128 (+4%) | 14mo | $185,000 | $164 | 49 |
| 1003 W Charles St | 0.55mi | 2/1.5 | 1,120 (+4%) | 23mo | $183,000 | $163 | 48 |
| 806 S Cherry St | 0.63mi | 2/1.0 | 1,039 (-4%) | 21mo | $170,000 | $164 | 42 |
| 601 S Cherry St | 0.67mi | 3/1.0 (+1) | 1,176 (+9%) | 19mo | $128,000 | $109 | 29 |
Match score weights: distance 35% · size 25% · config 20% · recency 20%. Top-matched comps best support the ARV.
Projected returns pro-forma
-3.0% appreciation · 0.33% rent growth · sell at horizon
- IRR
- -15.8%
- Equity multiple
- 0.45×
- Total profit
- $-22,996
- Equity at exit
- $22,351
- IRR
- -12.9%
- Equity multiple
- 0.34×
- Total profit
- $-27,900
- Equity at exit
- $12,961
Cash invested: $41,972 (down + closing). Projections, not guarantees.
Landlord ↔ Tenant lean methodology
- Overall (STATE)
- 90 Strongly Landlord-Friendly
- State Louisiana
- 90 Strongly Landlord-Friendly · R+12
- County
- — inherits STATE
- City
- — inherits STATE
ZIP-level market 70403
- Home prices YoY
- -34.1%
- Rents YoY
- 0.3%
- Active inventory
- 329
- Price-to-rent
- 8.9×
Monthly cashflow live
- Estimated rent
- $1,410 high interval (Pro) →
- Mortgage (P&I)
- −$786
- Tax est. 1.5%
- −$187 /mo · $2,248/yr
- Insurance
- −$62
- HOA
- −$0
- Vacancy / Maint / Mgmt
- −$296
- Net cashflow
- $78
Break-even live
Sensitivity live
| Price | -10% $182 | -5% $130 | +0% $78 | +5% $26 | +10% $-26 |
|---|---|---|---|---|---|
| Rent | -10% $-33 | -5% $22 | +0% $78 | +5% $134 | +10% $189 |
| Rate | -1.0pp $153 | -0.5pp $116 | base $78 | +0.5pp $39 | +1.0pp $0 |
UW: 25.0% down · 7.5% · 30yr · 1.5% tax · 5.0% vac · 8.0% maint · 8.0% mgmt
Financing live
Cash to close
- Down payment
- $37,475
- Closing costs
- $4,497
- Reserves months
- —
- Total cash needed
- —
Loan-product check · same deal, 3 products live
Conventional
25% down · 7.5% · 30yr
- Down + closing
- —
- Monthly P&I
- —
- Monthly cashflow
- —
- DSCR
- —
- Eligible?
- —
Personal DTI + credit; lowest rate.
DSCR
20% down · 8.5% · 30yr
- Down + closing
- —
- Monthly P&I
- —
- Monthly cashflow
- —
- DSCR
- —
- Eligible?
- —
No personal income docs; deal must DSCR.
Hard money
10% down · 12.0% · 12mo
- Down + closing
- —
- Monthly P&I
- —
- Monthly cashflow
- —
- DSCR
- —
- Eligible?
- —
Short-term bridge; refi at stabilization.
Rent comps 15 comps
| Address | Beds | Baths | Sqft | Rent | $/sqft | DOM | Units | Dist |
|---|---|---|---|---|---|---|---|---|
| 1002 S Pine St Hammond, LA | 3.0 | 2.5 | 1324 | $1,500 | $1.13 | 44d | 1 | 0.32mi |
| 207 S Laurel St Unit B Hammond, LA | 3.0 | 2.0 | 1100 | $1,350 | $1.23 | 44d | 1 | 0.36mi |
| 221 W Thomas St Unit A Hammond, LA | 3.0 | 1.0 | 1400 | $2,050 | $1.46 | 44d | 1 | 0.56mi |
| 309 Hewitt Rd Unit B Hammond, LA | 2.0 | 1.0 | 806 | $1,350 | $1.67 | 44d | 1 | 0.59mi |
| 1600 Bauerle Rd Hammond, LA | 1.0–2.0 | 1.0–2.0 | 884 | $1,751 | $1.98 | 44d | 4 | 0.62mi |
| 402 S Cherry St Hammond, LA | 3.0 | 2.0 | 1400 | $1,700 | $1.21 | 44d | 1 | 0.65mi |
| 204 W Clark St Hammond, LA | 2.0 | 1.0 | 840 | $900 | $1.07 | 44d | 1 | 0.72mi |
| 100 S Cypress St Hammond, LA | 2.0 | 2.5 | 1100 | $1,750 | $1.59 | 44d | 1 | 0.72mi |
| 209 Dixie Dr Hammond, LA | 3.0 | 1.0 | 1100 | $1,150 | $1.05 | 44d | 1 | 0.91mi |
| 202 S Chestnut St Hammond, LA | 1.0 | 1.0 | 750 | $1,075 | $1.43 | 44d | 1 | 0.96mi |
| 408 E Michigan St Hammond, LA | 2.0 | 1.0 | 1222 | $1,350 | $1.10 | 44d | 1 | 1.08mi |
| 308 Alexander Dr Hammond, LA | 3.0 | 2.0 | 1193 | $1,390 | $1.17 | 44d | 1 | 1.24mi |
| 16218 E Minnesota Park Rd Unit 3B Hammond, LA | 2.0 | 2.5 | 1095 | $1,450 | $1.32 | 44d | 1 | 1.35mi |
| 1407 Hooks Dr Unit B Hammond, LA | 2.0 | 1.0 | 838 | $1,000 | $1.19 | 44d | 1 | 1.37mi |
| 2617 Rue Saint Martin Hammond, LA | 2.0 | 1.5 | 1399 | $1,000 | $0.71 | 44d | 1 | 1.46mi |
Listing history 29 events
-
2026-06-19days on market $149,900 Active 37 DOM
-
2026-06-18days on market $149,900 Active 36 DOM
-
2026-06-17price $149,900 Active 35 DOM
Show marketing remark (414 chars)
New Construction! Two bedrooms and two full baths. No carpet and never flooded. Walking distance to downtown Hammond eateries, parks and shopping. Great Opportunity for a first-time homebuyer to invest and/or for an investor to start their rental portfolio. Vacant and easy to show. Builder Incentives Available. Some photos have been virtually staged and/or digitally enhance to illustrate the property potential.
-
2026-06-17days on market $160,000 Active 35 DOM
Show marketing remark (414 chars)
New Construction! Two bedrooms and two full baths. No carpet and never flooded. Walking distance to downtown Hammond eateries, parks and shopping. Great Opportunity for a first-time homebuyer to invest and/or for an investor to start their rental portfolio. Vacant and easy to show. Builder Incentives Available. Some photos have been virtually staged and/or digitally enhance to illustrate the property potential.
-
2026-06-16days on market $160,000 Active 34 DOM
-
2026-06-15days on market $160,000 Active 33 DOM
-
2026-06-14days on market $160,000 Active 31 DOM
-
2026-06-13days on market $160,000 Active 30 DOM
-
2026-06-10remarks 414-char remark
-
2026-06-10days on market $160,000 Active 28 DOM
-
2026-06-09days on market $160,000 Active 27 DOM
-
2026-06-08days on market $160,000 Active 26 DOM
-
2026-06-07days on market $160,000 Active 25 DOM
-
2026-06-05days on market $160,000 Active 22 DOM
-
2026-06-03days on market $160,000 Active 21 DOM
-
2026-06-02days on market $160,000 Active 20 DOM
-
2026-06-01days on market $160,000 Active 19 DOM
-
2026-05-31days on market $160,000 Active 18 DOM
-
2026-05-30days on market $160,000 Active 17 DOM
-
2026-05-13$160,000 Active 313-char remark
Show marketing remark (414 chars)
New Construction! Two bedrooms and two full baths. No carpet and never flooded. Walking distance to downtown Hammond eateries, parks and shopping. Great Opportunity for a first-time homebuyer to invest and/or for an investor to start their rental portfolio. Vacant and easy to show. Builder Incentives Available. Some photos have been virtually staged and/or digitally enhance to illustrate the property potential.
-
2026-05-13$160,000 Active 312-char remark
Show marketing remark (414 chars)
New Construction! Two bedrooms and two full baths. No carpet and never flooded. Walking distance to downtown Hammond eateries, parks and shopping. Great Opportunity for a first-time homebuyer to invest and/or for an investor to start their rental portfolio. Vacant and easy to show. Builder Incentives Available. Some photos have been virtually staged and/or digitally enhance to illustrate the property potential.
-
2026-03-12status Active
-
2025-08-05price $160,000
-
2025-08-05price $160,000
-
2025-06-24price $165,000
-
2025-06-24price $165,000
-
2025-06-02price $169,000
-
2025-06-02price $169,000
-
2025-04-09$175,000 Active
ⓘ Source: listings_history table (triggers on properties + properties_extension) + one-shot
backfill from property_details.listing_events for pre-trigger history.
Nearby sold comps map
Loading sold comps map…
Walkable amenities ~0.75 mi
Loading nearby amenities…
Taxation est. · year 1
- Rental income
- $16,919
- − Mortgage interest
- −$8,397
- − Property taxes
- −$2,248
- − Insurance
- −$750
- − Repairs & maintenance
- −$1,354
- − Management
- −$1,354
- − Depreciation
- −$4,361
- Taxable loss
- −$1,543
- Est. tax savings @ 24.0%
- +$370
- After-tax cash flow
- $1,305/yr
For passive investors: Depreciation is non-cash, so a rental often shows a tax loss while cash-flowing — sheltering income. Rental losses are passive: they offset passive income freely, and up to $25,000/yr can offset ordinary (W-2) income if you actively participate and your MAGI is under $100k (phasing out to $0 by $150k); unused losses carry forward. On sale, claimed depreciation is recaptured at up to 25%, and gains may owe capital-gains tax (a 1031 exchange can defer both). Figures are a year-1 estimate at your 24.0% rate — not tax advice; consult a CPA.
Condition & rehab AI · 13 photos
This home is in good condition with no major repairs needed. It has a good curb appeal and is move-in ready. Upgrading the exterior and interior paint, flooring, and appliances can further enhance its value.
Value-add opportunities
- Both Painting the exterior and interior walls — Painting can enhance the curb appeal and interior aesthetics, making the home more attractive to potential buyers and renters.
- Both Upgrading the flooring — Upgrading the flooring can improve the overall look and feel of the home, making it more appealing to potential buyers and renters.
- Both Installing new appliances — Installing new appliances can make the kitchen more functional and appealing to potential buyers and renters.
Renovation cost estimate screening
Value-add ROI direction
- Both Painting the exterior and interior walls — Painting can enhance the curb appeal and interior aesthetics, making the home more attractive to potential buyers and renters. ↑
- Both Upgrading the flooring — Upgrading the flooring can improve the overall look and feel of the home, making it more appealing to potential buyers and renters. ↑
- Both Installing new appliances — Installing new appliances can make the kitchen more functional and appealing to potential buyers and renters. ↑
ⓘ Cost ranges are severity-bucket heuristics (US national rule-of-thumb). Get contractor quotes + a written scope before underwriting a rehab budget.
Schools (NCES district)
- District
- Tangipahoa Parish
- NCES district ID
- 2201680
- Math proficiency
- 18% ▼ -32.00%
- Reading proficiency
- 29% ▼ -31.00%
- Median HH income
- $41,283
- Composite
- 19.94/100
- National rank
- #8676
- State rank
- #63 of 98 in LA
Livability — Hammond
- Score
- 69/100
- State rank
- #77
- US rank
- #8868
Category grades
Schools grade is shown separately in the Schools card above.
Census & demographics
- Census place
- Hammond, LA
- County
- Tangipahoa Parish · 85,958 people
- City population
- 51,394
- Metro
- Hammond, LA
- Population (ZIP)
- 30,173
- Household income
- $50,976
- Rent vs Own
- Severe rent burden
- 1201.0
Population outlook (Tangipahoa County) Hauer SSP2
- Today (2025)
- 144,204 people
- By 2030
- 151,413 · +5.0%
- By 2040
- 164,374 · +14.0%
- By 2050
- 175,427 · +21.7%
- By 2075
- 195,165 · +35.3%
- By 2100
- 201,641 · +39.8%
Race, ethnicity, and origin ACS 2023
- Neighborhood character
- Diverse neighborhood (Simpson 0.56)
- Race & ethnicity
- White 55% Black 37% Hispanic / Latino 6% Two or more races 6%
- Hispanic origin (detail)
- Mexican 3%
- Common ancestry
- Lithuanian 9% Serbian 1% Slovak 1%
- Foreign-born
- 3% · Canada
- Languages at home
- 95% English-only · Spanish 4% Arabic 1%
Political lean MEDSL · Tangipahoa
- 2024 margin
- Solid R (+37.4) · D 30.6% · R 68.0% · Other 1.3%
- 2008→2024 swing
- -6.5pp toward R · 2008: -30.9pp · 2024: -37.4pp
- All cycles
- 2024: R+37.4 2020: R+32.8 2016: R+32.6 2012: R+27.7 2008: R+30.9
Not yet ingested
- Civics
- —
Market trends
- HPI YoY
- ▼ -66.04%
- Current HPI
- 127.4535
- Rent YoY
- ▲ 0.33%
- Metro
- Hammond, LA
- State GDP YoY
- ▲ 3.29%
- F500 in state
- 10
Industry mix (Fortune 500 HQ in LA)
| Industry | F500 HQs | Revenue |
|---|---|---|
| Telecommunications | 2 | $23B |
|
||
| Utilities | 1 | $12B |
|
||
| Wholesale / Distribution | 1 | $5B |
|
||
| Advertising | 1 | $2B |
|
||
Price history
-14.3% since first listed12 events — show timeline
- 2026-06-17 Price Changed $149,900 AcadianaMLS
- 2026-06-17 Price Changed $149,900 GSREIN
- 2026-05-13 Listed $160,000 GSREIN
- 2026-05-13 Listed $160,000 AcadianaMLS
- 2026-03-12 Relisted — AcadianaMLS
- 2025-08-05 Price Changed $160,000 AcadianaMLS
- 2025-08-05 Price Changed $160,000 GSREIN
- 2025-06-24 Price Changed $165,000 AcadianaMLS
- 2025-06-24 Price Changed $165,000 GSREIN
- 2025-06-02 Price Changed $169,000 AcadianaMLS
- 2025-06-02 Price Changed $169,000 GSREIN
- 2025-04-09 Listed $175,000 AcadianaMLS
Cash-flow waterfall
monthlySold comps — $/sqft
last 12 mo · ≤1 miLoading sold comps…