724 Monmouth Rd · Cream Ridge, NJ
Flood risk 1/10 · Minimal
- FEMA flood zone
- X (unshaded)
- Chance of flooding over 30 yrs
- 0.0%
- Est. flood insurance / yr
- $507 – $1,088
Fire risk 5/10 · Moderate
- Est. fire insurance / yr
- $526 – $976
Heat risk 6/10 · Moderate
- Hot days now (above 101°F)
- 7 days/yr
- Hot days in 30 yrs
- 15 days/yr
Wind risk 6/10 · Moderate
- Chance of severe wind over 30 yrs
- 50.0%
Air-quality risk 4/10 · Minor
- Unhealthy air days now
- 4 days/yr
- Unhealthy air days in 30 yrs
- 5 days/yr
Risk factors via First Street. Map © Google.
Why this score? — see what drove the D+ grade
The composite is a weighted blend of 9 inputs, each scored 0–100. Each bar is that input's sub-score; the figure is the points it added to the 100-point composite (weight × sub-score).
- Cash flow +16.8/30.0
- 1% rule +7.7/10.0
- ARV discount +7.5/15.0
- DSCR +5.2/10.0
- Schools +4.9/10.0
- Rent growth +2.5/5.0
- Livability +2.5/5.0
- Condition / age +2.5/5.0
- Appreciation +0.0/10.0
$82,000
🖨 Deal sheet (PDF) 📄 Offer letter ✓ Due diligence
Listing remarks
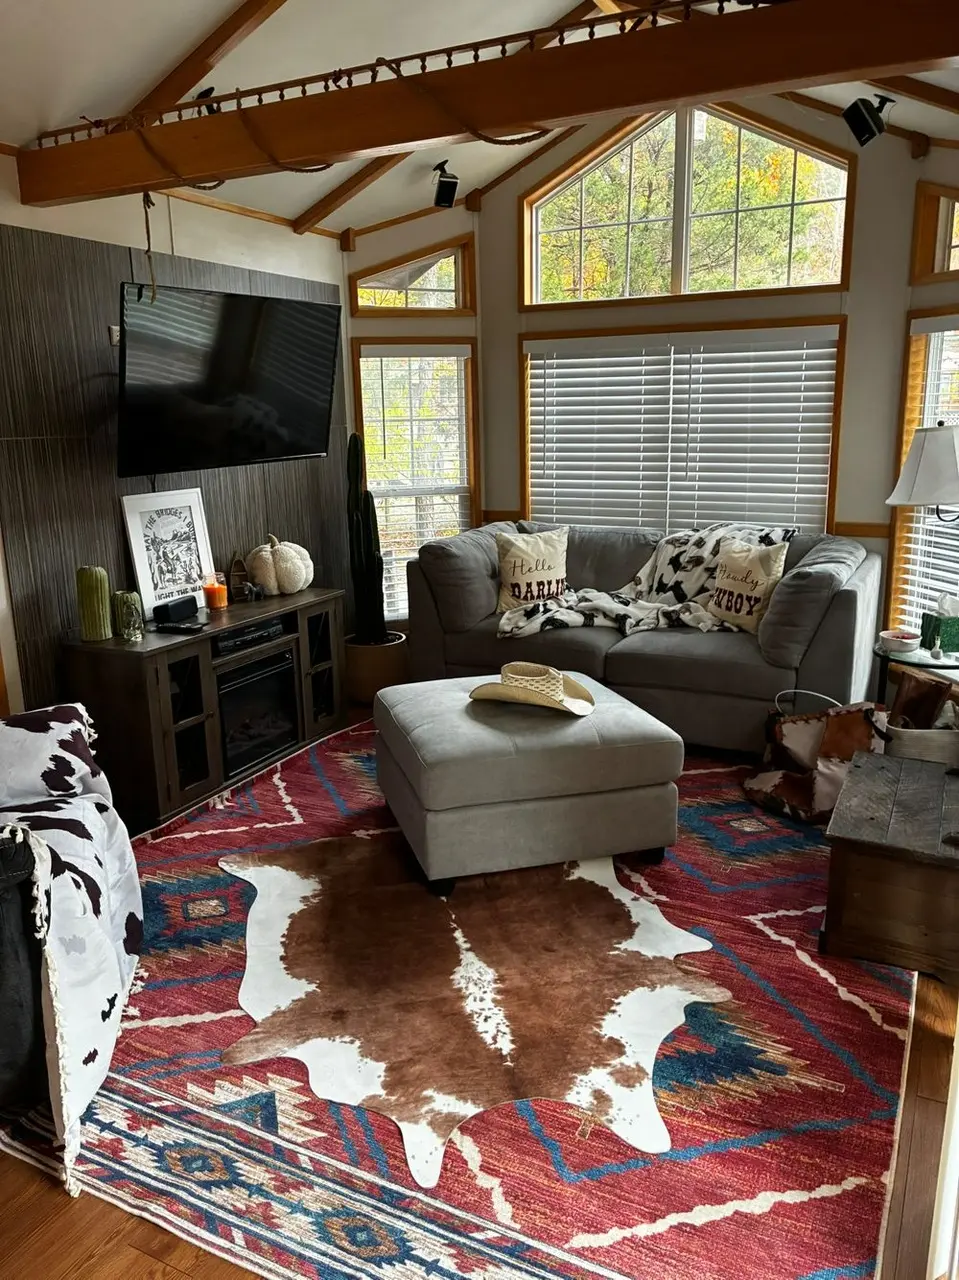
You'll adore this wooded year round retreat just 25 miles from the Jersey Shore in Crystal Springs Wilderness Lodges and RV Resort. Your family will enjoy an Olympic size pool, baby pool and playground. Make Smores by your own firepit after a day at the beach, Six Flags Great Adventure, Jackson Premium Outlets or nearby hiking, fishing and wineries; minutes from the cabin. HOA will manage your 2 day minimum rental unit when you don't want to use it personally. The land is owned; not leased. And can be owner occupied up to 70 days/year. HOA fees are minimal at $180/month. This country-themed unit is coming furnished with decor to appeal to the smallest of cowpoke.
Key facts
- Firepit
- Fishing
- Baby pool
Tags
Property features AI
Exterior
- Utilities: Lot area approximately 3,049 sq ft
- Home design: One-story condominium; Facing information not provided
- Construction: Built year not provided; Construction materials not provided; Roof and foundation details not provided
- Exterior features: Condo property
Neighborhood map
What this means for you Summary
Snapshot
- This is a 1-bed/1.0-bath condo listed at $82k.
Deal economics
- At list price, monthly cash flow is $53 ($635/yr) — positive.
- The deal already cash-flows at list — no discount required.
- Meets the 1% rule at list price ($1k rent vs $82k).
- Recommended offer: $81k (1.5% below list) — sets the bar for market timing.
Location & tenants
- Location reads: area grade D — affects rentability + tenant quality, not the cash-flow math above.
- Upper Freehold Regional School District (suburban): math 41% / reading 60% proficiency, ranked #100 of 472 in NJ (top 21%) — acceptable for families but not a draw, mixed tenant base, ~2y average lease; only 5% free/reduced lunch — higher-income household profile.
- Zoned schools: Newell Elementary School (math 37% / reading 57%, grade D-, #308 of 1,303 statewide, top 26%, 547 students, 7% FRL); Stonebridge Middle School (math 48% / reading 62%, grade B-, #64 of 431 statewide, top 15%, 447 students, 7% FRL); Allentown High School (math 37% / reading 60%, grade D, #111 of 399 statewide, top 29%, 1,084 students, 5% FRL) — zoned schools at 6% FRL track the district average.
- Market conditions: 35 active listings in the ZIP; 2,840 units permitted in Monmouth County in 2024 (484 in 5+ unit buildings).
Forward outlook
- Local home prices are declining (-3.0%/yr); year-one equity from $567 of loan paydown is wiped out by about $2k of value loss. Plan a longer hold.
- Monmouth County population projected at -11% by 2050 — secular population decline; favor cash flow + early exit over multi-decade hold.
Negotiation context
- It's been on market 17 days — a 2% lower offer ($81k) is reasonable based on typical stale-listing flexibility.
- 5 sale attempts since 6y ago with the ask held roughly flat each time — persistent listings suggest the price (not the market) is what's stuck; bring a comps-based counter.
- Current owner paid $50k; list at $82k implies a 64% gain — meaningful room to come down on a strong offer.
Risks & watch-outs
- Watch-outs: HOA is 20% of rent.
- Climate carrying-cost: major wind risk, 50% chance of damaging wind over 30y; moderate wildfire risk; extreme-heat days projected 7→15/yr by 2055 (HVAC capex compounding) — expect insurance premiums to compound above CPI over the hold.
Questions for the listing agent
- What does the HOA fee cover, when was the last increase, and are there any pending special assessments or reserve-fund shortfalls?
- Any open or pending special assessments — roof, HVAC, plumbing, elevator, façade? What's the per-unit balance and payoff schedule, and is the seller paying it off at close or rolling it to the buyer?
- Is there a deadline driving the sale (1031 exchange, divorce, estate, relocation)? That informs how much negotiation room exists.
- The area grade is low — what's the realistic commute time and amenity access for the typical tenant pool here? Any planned neighborhood developments (good or bad) we should know about?
- What's the average days-on-market for RENTAL listings here right now (not sales)? A rising rental-DOM trend means longer vacancies and softer asking-rent achievability than the comps imply.
- What's the recent tenant-quality profile in this submarket — average credit score on applications, eviction rate, late-payment / NSF rate, and stable-employment percentage? A property-management company in the area should have these aggregated.
- How much new apartment / multifamily construction is in the pipeline within 1–3 miles? Heavy new supply (>2% of stock underway) typically softens rents 12–24 months out; light construction supports rent growth.
Investment metrics
- 1% rule
- 1.27% ✓
- Cap rate
- 7.07%
- Cash-on-cash
- 2.77%
- DSCR
- 1.12
- GRM
- 6.5
CMA / ARV
No comps found within radius.
Projected returns pro-forma
-3.0% appreciation · 3.0% rent growth · sell at horizon
- IRR
- -11.7%
- Equity multiple
- 0.57×
- Total profit
- $-9,774
- Equity at exit
- $12,226
- IRR
- -2.3%
- Equity multiple
- 0.84×
- Total profit
- $-3,594
- Equity at exit
- $7,090
Cash invested: $22,960 (down + closing). Projections, not guarantees.
Landlord ↔ Tenant lean methodology
- Overall (STATE)
- 21 Tenant-Leaning
- State New Jersey
- 21 Tenant-Leaning · D+6
- County
- — inherits STATE
- City
- — inherits STATE
ZIP-level market 08514
- Home prices YoY
- -3.1%
- Active inventory
- 35
- Price-to-rent
- 6.5×
Monthly cashflow live
- Estimated rent
- $1,044 medium interval (Pro) →
- Mortgage (P&I)
- −$430
- Tax from tax record
- −$96 /mo · $1,155/yr
- Insurance
- −$34
- HOA est. from 3 same-building comps
- −$211
- Vacancy / Maint / Mgmt
- −$219
- Net cashflow
- $53
Break-even live
Sensitivity live
| Price | -10% $99 | -5% $76 | +0% $53 | +5% $30 | +10% $7 |
|---|---|---|---|---|---|
| Rent | -10% $-29 | -5% $12 | +0% $53 | +5% $94 | +10% $135 |
| Rate | -1.0pp $94 | -0.5pp $74 | base $53 | +0.5pp $32 | +1.0pp $10 |
UW: 25.0% down · 7.5% · 30yr · 1.5% tax · 5.0% vac · 8.0% maint · 8.0% mgmt
Financing live
Cash to close
- Down payment
- $20,500
- Closing costs
- $2,460
- Reserves months
- —
- Total cash needed
- —
Loan-product check · same deal, 3 products live
Conventional
25% down · 7.5% · 30yr
- Down + closing
- —
- Monthly P&I
- —
- Monthly cashflow
- —
- DSCR
- —
- Eligible?
- —
Personal DTI + credit; lowest rate.
DSCR
20% down · 8.5% · 30yr
- Down + closing
- —
- Monthly P&I
- —
- Monthly cashflow
- —
- DSCR
- —
- Eligible?
- —
No personal income docs; deal must DSCR.
Hard money
10% down · 12.0% · 12mo
- Down + closing
- —
- Monthly P&I
- —
- Monthly cashflow
- —
- DSCR
- —
- Eligible?
- —
Short-term bridge; refi at stabilization.
HOA detail condo
- Monthly dues
- $0 · $0/yr
- Likely covers
- pool
- Assessments
- None detected in remarks — confirm with the listing agent.
Listing history 12 events
-
2026-06-22days on market $82,000 Active 17 DOM
-
2026-06-18days on market $82,000 Active 14 DOM
-
2026-06-17days on market $82,000 Active 13 DOM
-
2026-06-16days on market $82,000 Active 12 DOM
-
2026-06-15days on market $82,000 Active 11 DOM
-
2026-06-14days on market $82,000 Active 9 DOM
-
2026-06-13days on market $82,000 Active 8 DOM
-
2026-06-10days on market $82,000 Active 6 DOM
-
2026-06-09days on market $82,000 Active 5 DOM
-
2026-06-08days on market $82,000 Active 4 DOM
-
2026-06-07remarks 671-char remark
-
2026-06-07$82,000 Active 3 DOM
ⓘ Source: listings_history table (triggers on properties + properties_extension) + one-shot
backfill from property_details.listing_events for pre-trigger history.
Tax reassessment forecast NJ · Partial reset (capped growth)
- Current annual tax
- $1,155 · $96/mo
- Projected year-2 tax
- $1,598 · $133/mo
- Expected delta
- +$443/yr (+$37/mo · 38.4%)
ⓘ Screening estimate from a state-policy table — verify with the county assessor before closing.
Climate risk First Street
- Flood 1/10 Low FEMA zone X (unshaded) · 0% chance over 30 yrs
- Wildfire 5/10 Major
- Heat 6/10 Major 7 d/yr ≥101°F today · 15 d/yr by 30 yrs out
- Wind 6/10 Major 50% chance of damaging wind over 30 yrs
- Air quality 4/10 Moderate 4 unhealthy d/yr today · 5 by 30 yrs out
Nearby sold comps map
Loading sold comps map…
Walkable amenities ~0.75 mi
Loading nearby amenities…
Taxation est. · year 1
- Rental income
- $12,522
- − Mortgage interest
- −$4,593
- − Property taxes
- −$1,155
- − Insurance
- −$410
- − Repairs & maintenance
- −$1,002
- − Management
- −$1,002
- − HOA
- −$2,532
- − Depreciation
- −$2,385
- Taxable loss
- −$557
- Est. tax savings @ 24.0%
- +$134
- After-tax cash flow
- $769/yr
For passive investors: Depreciation is non-cash, so a rental often shows a tax loss while cash-flowing — sheltering income. Rental losses are passive: they offset passive income freely, and up to $25,000/yr can offset ordinary (W-2) income if you actively participate and your MAGI is under $100k (phasing out to $0 by $150k); unused losses carry forward. On sale, claimed depreciation is recaptured at up to 25%, and gains may owe capital-gains tax (a 1031 exchange can defer both). Figures are a year-1 estimate at your 24.0% rate — not tax advice; consult a CPA.
Schools (NCES district)
- District
- Upper Freehold Regional School District
- NCES district ID
- 3416560
- Math proficiency
- 41% ▼ -16.00%
- Reading proficiency
- 60% ▼ -5.00%
- Median HH income
- $109,833
- Composite
- 48.85/100
- National rank
- #2086
- State rank
- #100 of 472 in NJ
Livability — Cream Ridge
No livability data for this city. (Only ~50 U.S. cities are tracked.)
Census & demographics
- Population (ZIP)
- 5,270
Population outlook (Monmouth County) Hauer SSP2
- Today (2025)
- 620,308 people
- By 2030
- 612,309 · -1.3%
- By 2040
- 587,297 · -5.3%
- By 2050
- 551,342 · -11.1%
- By 2075
- 472,934 · -23.8%
- By 2100
- 381,534 · -38.5%
Race, ethnicity, and origin ACS 2023
- Neighborhood character
- Predominantly White (87%)
- Race & ethnicity
- White 87% Hispanic / Latino 6% Two or more races 5% Asian 5%
- Hispanic origin (detail)
- Puerto Rican 1% Cuban 2%
- Common ancestry
- Romanian 7% Slovak 3% Scotch-Irish 2%
- Foreign-born
- 6% · South Korea, Canada, Vietnam
- Languages at home
- 92% English-only · Spanish 2% Russian/Polish/Slavic 2% Vietnamese 1%
Political lean MEDSL · Monmouth
- 2024 margin
- R (+11.4) · D 43.4% · R 54.8% · Other 1.8%
- 2008→2024 swing
- -7.7pp toward R · 2008: -3.7pp · 2024: -11.4pp
- All cycles
- 2024: R+11.4 2020: R+2.8 2016: R+9.5 2012: R+5.5 2008: R+3.7
Not yet ingested
- Civics
- —
Market trends
- HPI YoY
- ▼ -9.91%
- Current HPI
- 309.8916
- Rent YoY
- —
- Metro
- —
- State GDP YoY
- ▲ 2.05%
- F500 in state
- 34
Industry mix (Fortune 500 HQ in NJ)
| Industry | F500 HQs | Revenue |
|---|---|---|
| Consumer Goods | 3 | $31B |
|
||
| Pharmaceuticals | 2 | $153B |
|
||
| Technology | 2 | $21B |
|
||
| Insurance | 2 | $20B |
|
||
| Healthcare | 2 | $19B |
|
||
| Financial Services | 1 | $70B |
|
||
Price history
+64.0% since first listed10 events — show timeline
- 2026-06-04 Listed $82,000 ForSaleByOwner.com
- 2025-03-21 Rental Removed $2,500 RENTALBEAST
- 2025-02-17 Listed for Rent $2,500 RENTALBEAST
- 2020-12-04 Delisted — MOMLS
- 2020-12-04 Delisted — MOMLS
- 2020-12-04 Delisted — MOMLS
- 2020-06-09 Listed $120,000 MOMLS
- 2020-06-09 Listed $159,900 MOMLS
- 2020-06-09 Listed $99,000 MOMLS
- 2017-11-13 Sold (Public Records) $50,000 Public Records
Property tax history
+1.4%/yrLatest (2023): $1,155 · +1.7% YoY. Source: county tax records.
Cash-flow waterfall
monthlySold comps — $/sqft
last 12 mo · ≤1 miLoading sold comps…