 8-Plex
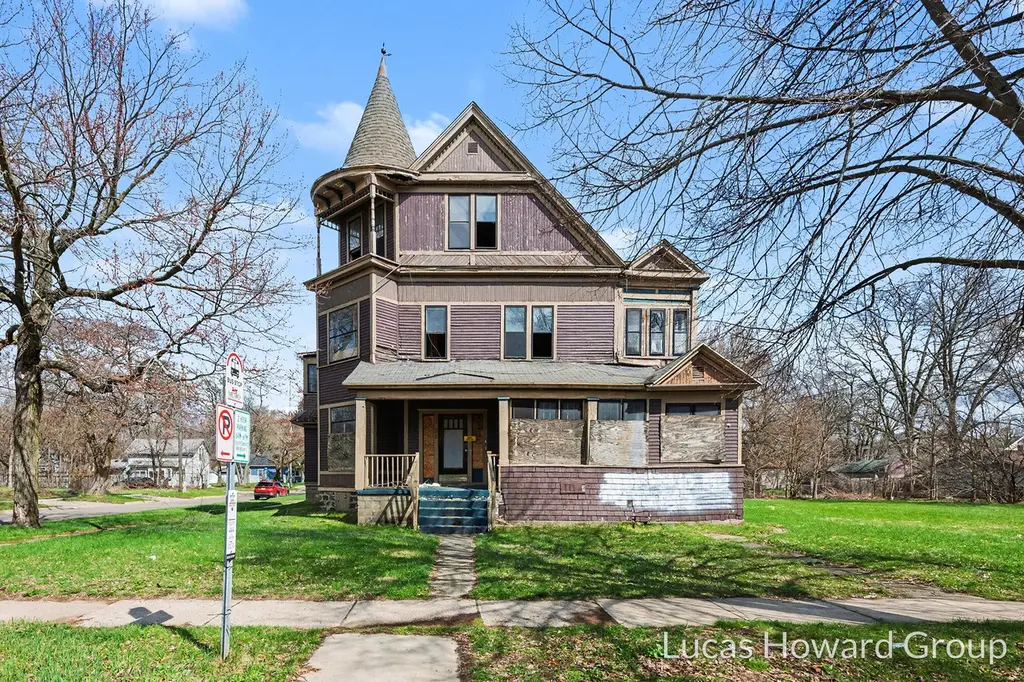
836 West North St · Kalamazoo, MI
Flood risk No data
- FEMA flood zone
- —
- Chance of flooding over 30 yrs
- —
- Est. flood insurance / yr
- —
Fire risk No data
- Est. fire insurance / yr
- —
Heat risk No data
- Hot days now (above threshold)
- —
- Hot days in 30 yrs
- —
Wind risk No data
- Chance of severe wind over 30 yrs
- —
Air-quality risk No data
- Unhealthy air days now
- —
- Unhealthy air days in 30 yrs
- —
Risk factors via First Street. Map © Google.
Why this score? — see what drove the D+ grade
The composite is a weighted blend of 9 inputs, each scored 0–100. Each bar is that input's sub-score; the figure is the points it added to the 100-point composite (weight × sub-score).
- Cash flow +15.0/30.0
- ARV discount +7.5/15.0
- 1% rule +5.0/10.0
- DSCR +5.0/10.0
- Schools +4.7/10.0
- Livability +3.8/5.0
- Condition / age +2.5/5.0
- Rent growth +2.3/5.0
- Appreciation +0.0/10.0
$94,900
🖨 Deal sheet 📄 Offer letter ✓ Due diligence
Multi-family units
County records classify this as Multi-Family (5+ Unit). Listing-text estimate: 8 units. confirmed
5+ unit building — per-unit beds/baths from public records are typically unavailable; the breakdown below (if shown) is an estimate from the listing text.
Listing remarks MLS
Opportunities like this don't come around often. Just a block from Woodward Elementary in Kalamazoo, this historic Queen Anne offers over 4,000 sq ft above grade and has been fully taken down to the studs. Giving you a true blank canvas to build exactly what you want. Zoned for multi-family or commercial use, the layout and size lend themselves well to a potential 5-8 unit redevelopment. Whether you're planning income-producing rentals, student housing near WMU and Kalamazoo College, or a unique mixed-use concept, the groundwork is already done. With original character like a turret and wrap-around porch still intact, this is your chance to blend historic charm with modern design in a way that stands out and performs. A Hold Harmless must be signed prior to viewing the property.
Key facts
- 0.23 acre lot
- Built 1888
- Listed 72 days
Property features AI
Finance
- Other: Zoning: Light Industry
- Financial info: Tax annual amount available
Exterior
- Parking: Unpaved parking
- Utilities: Public water; Public sewer; Electricity connected; Natural gas connected; Phone available
- Home design: Residential income property; Multi-family
- Construction: Wood siding construction; Composition roof
- Exterior features: Corner lot; Directions: From W Kalamazoo Ave, turn N on Woodward Ave; property is on the northeast corner of Woodward and West North
Interior
- Heating & cooling: Forced air heating; Natural gas heating
- Interior features: Full basement
Neighborhood map
What this means for you Summary
Snapshot
- This is a 8 × 3-bed/3-bath units multifamily listed at $95k.
Deal economics
- At list price, monthly cash flow is $7k ($82k/yr) — positive. Per door: $852/mo.
- The deal already cash-flows at list — no discount required.
- Meets the 1% rule at list price ($9k rent vs $95k).
- Recommended offer: $89k (6.0% below list) — sets the bar for market timing.
- Cap rate 92.5% vs local median 4.1% in Kalamazoo — top-decile yield for the area; either an underpriced asset or a hidden risk that comps aren't pricing in. Stress-test before assuming the spread holds.
Location & tenants
- Location reads 76/100 on livability (#141 in MI, #3,492 nationally) — a middle-class / working-renter tenant base. Strengths: commute A+, cost of living A+, housing A+; Watch: crime F, employment D-.
- Kalamazoo Public Schools (urban): math 43% / reading 72% proficiency, ranked #71 of 540 in MI (top 13%) — acceptable for families but not a draw, mixed tenant base, ~2y average lease; 66% free/reduced lunch — lower-income household profile, screen leases tightly.
- Market conditions: Rents soft (-0.8%/yr); 77 active listings in the ZIP; 2 comparable units currently listed for rent nearby; lower-income renter base — watch delinquency; 339 units permitted in Kalamazoo County in 2024 (22 in 5+ unit buildings).
- At $9,463/mo this rent would consume 289% of the median local household income ($39k/yr) (locally 816% of renters already pay >50% of income on rent) — very limited rent-growth headroom before tenants either downsize or default.
Forward outlook
- Local home prices are declining (-3.0%/yr); year-one equity from $656 of loan paydown is wiped out by about $3k of value loss. Plan a longer hold.
- Kalamazoo County population projected at +18% by 2050 — long-run rental-demand tailwind backs the buy-and-hold thesis.
- At projected returns (-3.0% appreciation + 0.0% rent growth), your $27k cash investment doubles in ~1 year — after that, you're playing with house money.
Negotiation context
- It's been on market 72 days — a 6% lower offer ($89k) is reasonable based on typical stale-listing flexibility.
- 12 sale attempts since 10y ago with the ask held roughly flat each time — persistent listings suggest the price (not the market) is what's stuck; bring a comps-based counter.
- Current owner paid $75k; 27% above their basis — modest negotiation headroom, anchor on the comps not their cost.
Risks & watch-outs
- Watch-outs: built in 1888 — expect roof / HVAC / electrical / plumbing capex.
Questions for the listing agent
- It's been on market 72 days. Have you received any prior offers? Is the seller open to a 6% concession, seller financing, or rate buy-down credit?
- Can we see the unit-by-unit rent roll, current vacancy, and any below-market leases? What's the average tenancy length?
- What capital expenditures (roof, boiler, parking lot, exteriors) have been made in the last 5 years, and what's planned in the next 2?
- Built in 1888 — when were the roof, HVAC, electrical panel, plumbing, and water heater last replaced?
- Why hasn't it sold? Are there any deal-killer items the seller is aware of (foundation, flood, title, zoning, code violations)?
- Is there a deadline driving the sale (1031 exchange, divorce, estate, relocation)? That informs how much negotiation room exists.
- Crime grade is F in this area — have there been break-ins, vandalism, or insurance claims at this property in the last 3 years? What carrier currently insures it and at what premium?
- The area grade is low — what's the realistic commute time and amenity access for the typical tenant pool here? Any planned neighborhood developments (good or bad) we should know about?
- What's the average days-on-market for RENTAL listings here right now (not sales)? A rising rental-DOM trend means longer vacancies and softer asking-rent achievability than the comps imply.
- What's the recent tenant-quality profile in this submarket — average credit score on applications, eviction rate, late-payment / NSF rate, and stable-employment percentage? A property-management company in the area should have these aggregated.
- How much new apartment / multifamily construction is in the pipeline within 1–3 miles? Heavy new supply (>2% of stock underway) typically softens rents 12–24 months out; light construction supports rent growth.
Investment metrics
- 1% rule
- 9.97% ✓
- Cap rate
- 92.53%
- Cash-on-cash
- 307.99%
- DSCR
- 14.70
- GRM
- 0.8
CMA / ARV
- ARV (on-the-fly)
- $216,726
- Comps found
- 11
Show comp detail 11 sales within ~0.75 mi
| Address | Dist | Beds/Ba | Sqft | Sold | Price | $/sf | Match |
|---|---|---|---|---|---|---|---|
| 415 Elm St | 0.21mi | 4/— | 2,648 (+0%) | 16mo | $150,000 | $57 | 76 |
| 443 Stuart Ave Unit 1 and 2 | 0.25mi | 4/— | 2,571 (-3%) | 16mo | $285,000 | $111 | 71 |
| 412 Woodward Ave | 0.21mi | 5/2.0 | 2,718 (+3%) | 21mo | $150,000 | $55 | 68 |
| 412 Woodward Ave | 0.21mi | 5/2.0 | 2,718 (+3%) | 21mo | $150,000 | $55 | 68 |
| 807 Ferris Ct | 0.28mi | 4/4.0 | 2,720 (+3%) | 23mo | $310,000 | $114 | 63 |
| 206-208 Allen Blvd | 0.41mi | 4/2.0 | 2,706 (+2%) | 21mo | $221,088 | $82 | 60 |
| 206-208 Allen Blvd | 0.41mi | 4/— | 2,706 (+2%) | 21mo | $221,088 | $82 | 60 |
| 316 Elm St | 0.28mi | 6/— | 2,900 (+10%) | 15mo | $252,200 | $87 | 58 |
| 417 Oak St | 0.69mi | 4/3.0 | 2,482 (-6%) | 2mo | $207,000 | $83 | 56 |
| 420 Davis St | 0.67mi | 3/3.0 | 2,354 (-11%) | 13mo | $187,920 | $80 | 40 |
| 816 W Lovell St | 0.62mi | 4/4.0 | 2,424 (-8%) | 24mo | $305,000 | $126 | 38 |
Match score weights: distance 35% · size 25% · config 20% · recency 20%. Top-matched comps best support the ARV.
Projected returns pro-forma
-3.0% appreciation · 0.0% rent growth · sell at horizon
- IRR
- —
- Equity multiple
- 15.73×
- Total profit
- $391,398
- Equity at exit
- $14,150
- IRR
- —
- Equity multiple
- 30.86×
- Total profit
- $793,543
- Equity at exit
- $8,205
Cash invested: $26,572 (down + closing). Projections, not guarantees.
Landlord ↔ Tenant lean methodology
- Overall (STATE)
- 62 Landlord-Friendly
- State Michigan
- 62 Landlord-Friendly · EVEN
- County
- — inherits STATE
- City
- — inherits STATE
ZIP-level market 49007
- Rents YoY
- -0.8%
- Active inventory
- 77
- Price-to-rent
- 6.7×
Monthly cashflow live
- Estimated rent
- $9,463 medium interval (Pro) →
- Mortgage (P&I)
- −$498
- Tax est. 1.5%
- −$119 /mo · $1,424/yr
- Insurance
- −$40
- HOA
- −$0
- Vacancy / Maint / Mgmt
- −$1,987
- Net cashflow
- $6,820
Break-even live
8-unit breakdown (identical units grouped — click to expand)
| Units | Beds | Baths | Est. rent |
|---|---|---|---|
| 8× units | 3 | 3 | $9,464 |
| #1 | 3 | 3 | $1,183 |
| #2 | 3 | 3 | $1,183 |
| #3 | 3 | 3 | $1,183 |
| #4 | 3 | 3 | $1,183 |
| #5 | 3 | 3 | $1,183 |
| #6 | 3 | 3 | $1,183 |
| #7 | 3 | 3 | $1,183 |
| #8 | 3 | 3 | $1,183 |
| Total (8 units) | $9,463 | ||
UW: 25.0% down · 7.5% · 30yr · 1.5% tax · 5.0% vac · 8.0% maint · 8.0% mgmt
Financing live
Cash to close
- Down payment
- $23,725
- Closing costs
- $2,847
- Reserves months
- —
- Total cash needed
- —
Loan-product check · same deal, 3 products live
Conventional
25% down · 7.5% · 30yr
- Down + closing
- —
- Monthly P&I
- —
- Monthly cashflow
- —
- DSCR
- —
- Eligible?
- —
Personal DTI + credit; lowest rate.
DSCR
20% down · 8.5% · 30yr
- Down + closing
- —
- Monthly P&I
- —
- Monthly cashflow
- —
- DSCR
- —
- Eligible?
- —
No personal income docs; deal must DSCR.
Hard money
10% down · 12.0% · 12mo
- Down + closing
- —
- Monthly P&I
- —
- Monthly cashflow
- —
- DSCR
- —
- Eligible?
- —
Short-term bridge; refi at stabilization.
Rent comps 2 comps
| Address | Beds | Baths | Sqft | Rent | $/sqft | DOM | Units | Dist |
|---|---|---|---|---|---|---|---|---|
| 722 W Kalamazoo Ave Unit 2 Kalamazoo, MI | 3.0 | 1.0 | 1800 | $1,600 | $0.89 | 21d | 1 | 0.27mi |
| 125 S Kalamazoo Mall Kalamazoo, MI | 2.0 | 2.0 | 1833 | $3,088 | $1.68 | 13d | 1 | 0.82mi |
Listing history 50 events
-
2026-06-18days on market $94,900 Active 72 DOM
-
2026-06-17days on market $94,900 Active 71 DOM
-
2026-06-16days on market $94,900 Active 70 DOM
-
2026-06-15days on market $94,900 Active 69 DOM
-
2026-06-14days on market $94,900 Active 67 DOM
-
2026-06-13days on market $94,900 Active 66 DOM
-
2026-06-10days on market $94,900 Active 64 DOM
-
2026-06-09days on market $94,900 Active 63 DOM
-
2026-06-08days on market $94,900 Active 62 DOM
-
2026-06-07days on market $94,900 Active 61 DOM
-
2026-06-05days on market $94,900 Active 58 DOM
-
2026-06-03days on market $94,900 Active 57 DOM
-
2026-06-02days on market $94,900 Active 56 DOM
-
2026-06-01days on market $94,900 Active 55 DOM
-
2026-05-31days on market $94,900 Active 54 DOM
-
2026-05-30days on market $94,900 Active 53 DOM
-
2026-04-07$94,900 Active
Show marketing remark (789 chars)
Opportunities like this don't come around often. Just a block from Woodward Elementary in Kalamazoo, this historic Queen Anne offers over 4,000 sq ft above grade and has been fully taken down to the studs. Giving you a true blank canvas to build exactly what you want. Zoned for multi-family or commercial use, the layout and size lend themselves well to a potential 5-8 unit redevelopment. Whether you're planning income-producing rentals, student housing near WMU and Kalamazoo College, or a unique mixed-use concept, the groundwork is already done. With original character like a turret and wrap-around porch still intact, this is your chance to blend historic charm with modern design in a way that stands out and performs. A Hold Harmless must be signed prior to viewing the property.
-
2026-04-07$94,900 Active 789-char remark
Show marketing remark (789 chars)
Opportunities like this don't come around often. Just a block from Woodward Elementary in Kalamazoo, this historic Queen Anne offers over 4,000 sq ft above grade and has been fully taken down to the studs. Giving you a true blank canvas to build exactly what you want. Zoned for multi-family or commercial use, the layout and size lend themselves well to a potential 5-8 unit redevelopment. Whether you're planning income-producing rentals, student housing near WMU and Kalamazoo College, or a unique mixed-use concept, the groundwork is already done. With original character like a turret and wrap-around porch still intact, this is your chance to blend historic charm with modern design in a way that stands out and performs. A Hold Harmless must be signed prior to viewing the property.
-
2026-04-01historical
-
2026-03-31historical
-
2026-03-27price $109,900
-
2026-03-27price $109,900
-
2026-02-20price $119,900
-
2026-02-19price $119,900
-
2025-10-29price $149,999
-
2025-10-28price $149,999
-
2025-10-27historical
-
2025-09-29$160,000 Active
-
2025-09-29$160,000 Active
-
2025-09-25historical
-
2025-08-15price $175,000
-
2025-08-14price $175,000
-
2025-06-09$190,000 Active
-
2025-06-08$190,000 Active
-
2024-01-31soldstatus $75,000 Sold
-
2024-01-31soldstatus $75,000 Sold
-
2024-01-31soldstatus $75,000 Closed
-
2024-01-24status Pending
-
2024-01-24status Pending
-
2024-01-24status Pending
-
2024-01-20price $109,900
-
2024-01-20price $109,900
-
2024-01-19price $109,900
-
2024-01-06price $114,900
-
2024-01-06price $114,900
-
2024-01-05price $114,900
-
2023-12-21price $119,900
-
2023-12-21price $119,900
-
2023-12-21price $119,900
-
2023-09-11$124,900 Active
ⓘ Source: listings_history table (triggers on properties + properties_extension) + one-shot
backfill from property_details.listing_events for pre-trigger history.
Nearby sold comps map
Loading sold comps map…
Walkable amenities ~0.75 mi
Loading nearby amenities…
Taxation est. · year 1
- Rental income
- $113,556
- − Mortgage interest
- −$5,316
- − Property taxes
- −$1,424
- − Insurance
- −$474
- − Repairs & maintenance
- −$9,084
- − Management
- −$9,084
- − Depreciation
- −$2,761
- Taxable income
- $85,412
- Est. tax owed @ 24.0%
- −$20,499
- After-tax cash flow
- $61,340/yr
For passive investors: Depreciation is non-cash, so a rental often shows a tax loss while cash-flowing — sheltering income. Rental losses are passive: they offset passive income freely, and up to $25,000/yr can offset ordinary (W-2) income if you actively participate and your MAGI is under $100k (phasing out to $0 by $150k); unused losses carry forward. On sale, claimed depreciation is recaptured at up to 25%, and gains may owe capital-gains tax (a 1031 exchange can defer both). Figures are a year-1 estimate at your 24.0% rate — not tax advice; consult a CPA.
Schools (NCES district)
- District
- Kalamazoo Public Schools
- NCES district ID
- 2619950
- Math proficiency
- 43% ▲ 13.00%
- Reading proficiency
- 72% ▲ 33.00%
- Median HH income
- $35,291
- Composite
- 47.48/100
- National rank
- #2275
- State rank
- #71 of 540 in MI
Livability — Kalamazoo
- Score
- 76/100
- State rank
- #141
- US rank
- #3492
Category grades
Schools grade is shown separately in the Schools card above.
Census & demographics
- Census place
- Kalamazoo, MI
- County
- Kalamazoo County · 224,317 people
- City population
- 121,397
- Metro
- Kalamazoo-Portage, MI
- Population (ZIP)
- 9,836
- Household income
- $39,344
- Rent vs Own
- Severe rent burden
- 816.0
Population outlook (Kalamazoo County) Hauer SSP2
- Today (2025)
- 280,982 people
- By 2030
- 292,068 · +3.9%
- By 2040
- 312,191 · +11.1%
- By 2050
- 331,196 · +17.9%
- By 2075
- 379,021 · +34.9%
- By 2100
- 396,579 · +41.1%
Race, ethnicity, and origin ACS 2023
- Neighborhood character
- Diverse neighborhood (Simpson 0.61)
- Race & ethnicity
- White 44% Black 44% Two or more races 7% Hispanic / Latino 3%
- Common ancestry
- Iranian 3% Romanian 2% Lithuanian 1%
- Foreign-born
- 3% · Canada
- Languages at home
- 94% English-only · Spanish 4% French/Haitian/Cajun 1% Arabic 1%
Political lean MEDSL · Kalamazoo
- 2024 margin
- D (+17.7) · D 58.0% · R 40.3% · Other 1.7%
- 2008→2024 swing
- -1.8pp toward R · 2008: 19.5pp · 2024: 17.7pp
- All cycles
- 2024: D+17.7 2020: D+18.7 2016: D+12.8 2012: D+13.3 2008: D+19.5
Not yet ingested
- Civics
- —
Market trends
- HPI YoY
- ▼ -68.80%
- Current HPI
- 112.4973
- Rent YoY
- ▼ -0.85%
- Metro
- Kalamazoo-Portage, MI
- State GDP YoY
- ▲ 1.37%
- F500 in state
- 28
Industry mix (Fortune 500 HQ in MI)
| Industry | F500 HQs | Revenue |
|---|---|---|
| Automotive Parts | 3 | $48B |
|
||
| Automotive | 2 | $372B |
|
||
| Chemicals | 1 | $45B |
|
||
| Automotive Retail | 1 | $29B |
|
||
| Healthcare / Medical Devices | 1 | $23B |
|
||
| Automotive Technology | 1 | $20B |
|
||
Price history
-34.6% since first listed47 events — show timeline
- 2026-04-07 Listed $94,900 REALCOMP
- 2026-04-07 Listed $94,900 MiRealSource-MiMLS
- 2026-04-01 Listing Removed — MiRealSource-MiMLS
- 2026-03-31 Listing Removed — REALCOMP
- 2026-03-27 Price Changed $109,900 MiRealSource-MiMLS
- 2026-03-27 Price Changed $109,900 REALCOMP
- 2026-02-20 Price Changed $119,900 MiRealSource-MiMLS
- 2026-02-19 Price Changed $119,900 REALCOMP
- 2025-10-29 Price Changed $149,999 MiRealSource-MiMLS
- 2025-10-28 Price Changed $149,999 REALCOMP
- 2025-10-27 Listing Removed — REALCOMP
- 2025-09-29 Listed $160,000 REALCOMP
- 2025-09-29 Listed $160,000 MiRealSource-MiMLS
- 2025-09-25 Listing Removed — MiRealSource-MiMLS
- 2025-08-15 Price Changed $175,000 MiRealSource-MiMLS
- 2025-08-14 Price Changed $175,000 REALCOMP
- 2025-06-09 Listed $190,000 REALCOMP
- 2025-06-08 Listed $190,000 MiRealSource-MiMLS
- 2024-01-31 Sold (MLS) $75,000 MiRealSource-MiMLS
- 2024-01-31 Sold (MLS) $75,000 SW Michigan MLS
- 2024-01-31 Sold (MLS) $75,000 REALCOMP
- 2024-01-24 Pending — REALCOMP
- 2024-01-24 Pending — MiRealSource-MiMLS
- 2024-01-24 Pending — SW Michigan MLS
- 2024-01-20 Price Changed $109,900 MiRealSource-MiMLS
- 2024-01-20 Price Changed $109,900 REALCOMP
- 2024-01-19 Price Changed $109,900 SW Michigan MLS
- 2024-01-06 Price Changed $114,900 MiRealSource-MiMLS
- 2024-01-06 Price Changed $114,900 REALCOMP
- 2024-01-05 Price Changed $114,900 SW Michigan MLS
- 2023-12-21 Price Changed $119,900 MiRealSource-MiMLS
- 2023-12-21 Price Changed $119,900 REALCOMP
- 2023-12-21 Price Changed $119,900 SW Michigan MLS
- 2023-09-11 Listed $124,900 MiRealSource-MiMLS
- 2023-09-11 Listed $124,900 SW Michigan MLS
- 2023-09-11 Listed $124,900 REALCOMP
- 2021-03-29 Sold (Public Records) $105,000 Public Records
- 2016-11-04 Sold (MLS) $127,000 SW Michigan MLS
- 2016-11-04 Sold (MLS) $127,000 REALCOMP
- 2016-10-17 Pending — SW Michigan MLS
- 2016-10-10 Price Changed $145,000 SW Michigan MLS
- 2016-08-09 Price Changed $150,000 SW Michigan MLS
- 2016-07-29 Price Changed $155,000 SW Michigan MLS
- 2016-07-29 Relisted — SW Michigan MLS
- 2016-04-20 Pending — SW Michigan MLS
- 2016-03-07 Listed $160,000 SW Michigan MLS
- 2016-03-06 Listed $145,000 REALCOMP
Property tax history
+3.9%/yrLatest (2025): $6,215 · +40.2% YoY. Source: county tax records.
Cash-flow waterfall
monthlySold comps — $/sqft
last 12 mo · ≤1 miLoading sold comps…