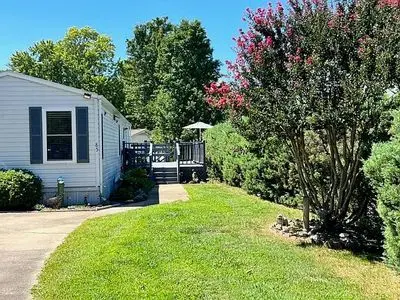
85 Ariel Loop · Fruitland, NC
Flood risk 1/10 · Minimal
- FEMA flood zone
- X (unshaded)
- Chance of flooding over 30 yrs
- 0.0%
- Est. flood insurance / yr
- $473 – $860
Fire risk 5/10 · Moderate
- Est. fire insurance / yr
- $906 – $1,684
Heat risk 4/10 · Minor
- Hot days now (above 98°F)
- 7 days/yr
- Hot days in 30 yrs
- 19 days/yr
Wind risk 2/10 · Minimal
- Chance of severe wind over 30 yrs
- —
Air-quality risk 3/10 · Minor
- Unhealthy air days now
- 2 days/yr
- Unhealthy air days in 30 yrs
- 3 days/yr
Risk factors via First Street. Map © Google.
Why this score? — see what drove the B grade
The composite is a weighted blend of 9 inputs, each scored 0–100. Each bar is that input's sub-score; the figure is the points it added to the 100-point composite (weight × sub-score).
- Cash flow +30.0/30.0
- 1% rule +10.0/10.0
- DSCR +10.0/10.0
- ARV discount +7.5/15.0
- Schools +4.2/10.0
- Condition / age +3.8/5.0
- Rent growth +3.4/5.0
- Livability +3.1/5.0
- Appreciation +0.0/10.0
$48,000
🖨 Deal sheet (PDF) 📄 Offer letter ✓ Due diligence
Listing remarks
In view of the Blue Ridge Mountains, this cottage inspired 1991 Clayton mobile home is located in Magnolia Place (an all-age community). Convenient access to Walmart/Sam& apos; s, Ingles, restaurants, I-26, 64, and within five miles you& apos; ll enjoy downtown Hendersonville. Light grey vinyl plank flooring, freshly painted walls, and modern ceiling fans throughout. Newly updated kitchen including cabinets, butcherblock countertop, eat-at bar, and bead board with open shelving. Bathroom features a walk-in shower, new toilet, vanity and sink. You& apos; ll find a substantial amount of storage inside and an 8x10 shed with electricity located on the back of the property. A large w
Key facts
- Large wooden deck
- Blue ridge mountains
- Walk-in shower
Tags
Neighborhood map
What this means for you Summary
Snapshot
- This is a 2-bed/1.0-bath single-family listed at $48k. Condition is rated good.
Deal economics
- At list price, monthly cash flow is $884 ($11k/yr) — positive.
- The deal already cash-flows at list — no discount required.
- Meets the 1% rule at list price ($2k rent vs $48k).
Location & tenants
- Location reads 62/100 on livability (#470 in NC) — a middle-class / working-renter tenant base. Strengths: cost of living A+, housing A+, crime A-; Watch: employment D+, schools F, amenities F.
- Henderson County Schools (suburban): math 48% / reading 52% proficiency, ranked #64 of 178 in NC (top 36%) — acceptable for families but not a draw, mixed tenant base, ~2y average lease.
- Market conditions: Rents rising (+3.6%/yr); 364 active listings in the ZIP; 1,534 units permitted in Henderson County in 2024 (558 in 5+ unit buildings).
- This rent runs 33% of the median local income ($56k/yr) — at the standard rent-burdened threshold; future hikes will face affordability resistance.
Forward outlook
- Local home prices are declining (-3.0%/yr); year-one equity from $332 of loan paydown is wiped out by about $1k of value loss. Plan a longer hold.
- Henderson County population projected at +20% by 2050 — long-run rental-demand tailwind backs the buy-and-hold thesis.
- At projected returns (-3.0% appreciation + 3.6% rent growth), your $13k cash investment doubles in ~2 years — after that, you're playing with house money.
Negotiation context
- Only 12 days on market — expect competitive offers; lowballing is unlikely to land.
- 2 sale attempts with the ask held roughly flat each time — persistent listings suggest the price (not the market) is what's stuck; bring a comps-based counter.
Risks & watch-outs
- Climate carrying-cost: moderate wildfire risk — expect insurance premiums to compound above CPI over the hold.
Questions for the listing agent
- Is there a deadline driving the sale (1031 exchange, divorce, estate, relocation)? That informs how much negotiation room exists.
- Schools are F-rated, which usually means shorter tenancies and higher turnover. Who's the typical renter profile here, and what's been the actual vacancy rate?
- What's the average days-on-market for RENTAL listings here right now (not sales)? A rising rental-DOM trend means longer vacancies and softer asking-rent achievability than the comps imply.
- What's the recent tenant-quality profile in this submarket — average credit score on applications, eviction rate, late-payment / NSF rate, and stable-employment percentage? A property-management company in the area should have these aggregated.
- How much new for-sale + rental construction is in the pipeline within 1–3 miles? Heavy new supply typically softens prices + rents 12–24 months out; constrained supply supports both.
Investment metrics
- 1% rule
- 3.21% ✓
- Cap rate
- 28.40%
- Cash-on-cash
- 78.94%
- DSCR
- 4.51
- GRM
- 2.6
CMA / ARV
No comps found within radius.
Projected returns pro-forma
-3.0% appreciation · 3.63% rent growth · sell at horizon
- IRR
- 79.8%
- Equity multiple
- 4.69×
- Total profit
- $49,535
- Equity at exit
- $7,157
- IRR
- 83.4%
- Equity multiple
- 9.91×
- Total profit
- $119,815
- Equity at exit
- $4,150
Cash invested: $13,440 (down + closing). Projections, not guarantees.
Landlord ↔ Tenant lean methodology
- Overall (STATE)
- 85 Strongly Landlord-Friendly
- State North Carolina
- 85 Strongly Landlord-Friendly · R+3
- County
- — inherits STATE
- City
- — inherits STATE
ZIP-level market 28792
- Rents YoY
- 3.6%
- Active inventory
- 364
- Price-to-rent
- 2.6×
Monthly cashflow live
- Estimated rent
- $1,539 medium interval (Pro) →
- Mortgage (P&I)
- −$252
- Tax est. 1.5%
- −$60 /mo · $720/yr
- Insurance
- −$20
- HOA
- −$0
- Vacancy / Maint / Mgmt
- −$323
- Net cashflow
- $884
Break-even live
Sensitivity live
| Price | -10% $917 | -5% $901 | +0% $884 | +5% $868 | +10% $851 |
|---|---|---|---|---|---|
| Rent | -10% $763 | -5% $823 | +0% $884 | +5% $945 | +10% $1,006 |
| Rate | -1.0pp $908 | -0.5pp $896 | base $884 | +0.5pp $872 | +1.0pp $859 |
UW: 25.0% down · 7.5% · 30yr · 1.5% tax · 5.0% vac · 8.0% maint · 8.0% mgmt
Financing live
Cash to close
- Down payment
- $12,000
- Closing costs
- $1,440
- Reserves months
- —
- Total cash needed
- —
Loan-product check · same deal, 3 products live
Conventional
25% down · 7.5% · 30yr
- Down + closing
- —
- Monthly P&I
- —
- Monthly cashflow
- —
- DSCR
- —
- Eligible?
- —
Personal DTI + credit; lowest rate.
DSCR
20% down · 8.5% · 30yr
- Down + closing
- —
- Monthly P&I
- —
- Monthly cashflow
- —
- DSCR
- —
- Eligible?
- —
No personal income docs; deal must DSCR.
Hard money
10% down · 12.0% · 12mo
- Down + closing
- —
- Monthly P&I
- —
- Monthly cashflow
- —
- DSCR
- —
- Eligible?
- —
Short-term bridge; refi at stabilization.
Listing history 11 events
-
2026-06-18days on market $48,000 Active 12 DOM
-
2026-06-17days on market $48,000 Active 11 DOM
-
2026-06-16days on market $48,000 Active 10 DOM
-
2026-06-15days on market $48,000 Active 9 DOM
-
2026-06-14days on market $48,000 Active 7 DOM
-
2026-06-13days on market $48,000 Active 6 DOM
-
2026-06-10days on market $48,000 Active 4 DOM
-
2026-06-09days on market $48,000 Active 3 DOM
-
2026-06-08days on market $48,000 Active 2 DOM
-
2026-06-07remarks 687-char remark
-
2026-06-07$48,000 Active 1 DOM
ⓘ Source: listings_history table (triggers on properties + properties_extension) + one-shot
backfill from property_details.listing_events for pre-trigger history.
Climate risk First Street
- Flood 1/10 Low FEMA zone X (unshaded) · 0% chance over 30 yrs
- Wildfire 5/10 Major
- Heat 4/10 Moderate 7 d/yr ≥98°F today · 19 d/yr by 30 yrs out
- Wind 2/10 Low
- Air quality 3/10 Moderate 2 unhealthy d/yr today · 3 by 30 yrs out
Nearby sold comps map
Loading sold comps map…
Walkable amenities ~0.75 mi
Loading nearby amenities…
Taxation est. · year 1
- Rental income
- $18,468
- − Mortgage interest
- −$2,689
- − Property taxes
- −$720
- − Insurance
- −$240
- − Repairs & maintenance
- −$1,477
- − Management
- −$1,477
- − Depreciation
- −$1,396
- Taxable income
- $10,468
- Est. tax owed @ 24.0%
- −$2,512
- After-tax cash flow
- $8,097/yr
For passive investors: Depreciation is non-cash, so a rental often shows a tax loss while cash-flowing — sheltering income. Rental losses are passive: they offset passive income freely, and up to $25,000/yr can offset ordinary (W-2) income if you actively participate and your MAGI is under $100k (phasing out to $0 by $150k); unused losses carry forward. On sale, claimed depreciation is recaptured at up to 25%, and gains may owe capital-gains tax (a 1031 exchange can defer both). Figures are a year-1 estimate at your 24.0% rate — not tax advice; consult a CPA.
Condition & rehab AI · 1 photo
This single-family home is in good condition with recent updates, offering a move-in-ready experience. However, some exterior and interior enhancements could further boost its value.
Value-add opportunities
- Both Paint exterior siding — Enhances curb appeal and value.
- Both Replace roof — Long-term durability and aesthetic improvement.
- Both Upgrade HVAC system — Improved comfort and energy efficiency.
- Both Landscaping improvements — Enhances curb appeal and value.
- Both Add outdoor lighting — Enhances safety and curb appeal.
Renovation cost estimate screening
Value-add ROI direction
- Both Paint exterior siding — Enhances curb appeal and value. ↑
- Both Replace roof — Long-term durability and aesthetic improvement. ↑
- Both Upgrade HVAC system — Improved comfort and energy efficiency. ↑
- Both Landscaping improvements — Enhances curb appeal and value. ↑
- Both Add outdoor lighting — Enhances safety and curb appeal. ↑
ⓘ Cost ranges are severity-bucket heuristics (US national rule-of-thumb). Get contractor quotes + a written scope before underwriting a rehab budget.
Schools (NCES district)
- District
- Henderson County Schools
- NCES district ID
- 3702100
- Math proficiency
- 48% ▼ -2.00%
- Reading proficiency
- 52% ▼ -2.00%
- Median HH income
- $47,101
- Composite
- 42.5/100
- National rank
- #3206
- State rank
- #64 of 178 in NC
Livability — Fruitland
- Score
- 62/100
- State rank
- #470
- US rank
- #17118
Category grades
Schools grade is shown separately in the Schools card above.
Census & demographics
- Census place
- Fruitland, NC
- County
- Henderson County · 78,587 people
- Metro
- Asheville, NC
- Population (ZIP)
- 36,645
- Household income
- $55,522
- Rent vs Own
- Severe rent burden
- 1420.0
Population outlook (Henderson County) Hauer SSP2
- Today (2025)
- 124,075 people
- By 2030
- 129,690 · +4.5%
- By 2040
- 139,898 · +12.8%
- By 2050
- 148,298 · +19.5%
- By 2075
- 163,980 · +32.2%
- By 2100
- 166,962 · +34.6%
Race, ethnicity, and origin ACS 2023
- Neighborhood character
- Predominantly White (72%)
- Race & ethnicity
- White 72% Hispanic / Latino 20% Two or more races 8% Black 4% Native American 1%
- Hispanic origin (detail)
- Mexican 15% Puerto Rican 1%
- Common ancestry
- Slovak 3% Serbian 2% Lithuanian 2%
- Foreign-born
- 10% · Canada, Jamaica
- Languages at home
- 82% English-only · Spanish 16%
Political lean MEDSL · Henderson
- 2024 margin
- R (+14.6) · D 42.1% · R 56.7% · Other 1.1%
- 2008→2024 swing
- +6.5pp toward D · 2008: -21.0pp · 2024: -14.6pp
- All cycles
- 2024: R+14.6 2020: R+18.8 2016: R+27.9 2012: R+27.6 2008: R+21.0
Not yet ingested
- Civics
- —
Market trends
- HPI YoY
- ▼ -174.29%
- Current HPI
- 214.0215
- Rent YoY
- ▲ 3.63%
- Metro
- Asheville, NC
- State GDP YoY
- ▲ 3.28%
- F500 in state
- 26
Industry mix (Fortune 500 HQ in NC)
| Industry | F500 HQs | Revenue |
|---|---|---|
| Financial Services | 2 | $213B |
|
||
| Retail | 2 | $95B |
|
||
| Industrial Conglomerate | 1 | $38B |
|
||
| Metals / Steel | 1 | $35B |
|
||
| Utilities | 1 | $30B |
|
||
| Industrial Machinery | 1 | $19B |
|
||
Price history
+3455.6% since first listed4 events — show timeline
- 2026-06-07 Listed $48,000 FSBO.com
- 2025-02-07 Rental Removed $1,200 SHOWMOJO
- 2025-01-28 Price Changed $1,200 SHOWMOJO
- 2025-01-07 Listed for Rent $1,350 SHOWMOJO
Cash-flow waterfall
monthlySold comps — $/sqft
last 12 mo · ≤1 miLoading sold comps…