355 Flanders H Pkwy Unit H · Delray Beach, FL
Flood risk 1/10 · Minimal
- FEMA flood zone
- X (unshaded)
- Chance of flooding over 30 yrs
- 0.0%
- Est. flood insurance / yr
- $507 – $1,088
Fire risk 1/10 · Minimal
- Est. fire insurance / yr
- $947 – $1,759
Heat risk 9/10 · Severe
- Hot days now (above 107°F)
- 7 days/yr
- Hot days in 30 yrs
- 26 days/yr
Wind risk 10/10 · Severe
- Chance of severe wind over 30 yrs
- 99.0%
Air-quality risk 3/10 · Minor
- Unhealthy air days now
- 2 days/yr
- Unhealthy air days in 30 yrs
- 3 days/yr
Risk factors via First Street. Map © Google.
Why this score? — see what drove the D grade
The composite is a weighted blend of 9 inputs, each scored 0–100. Each bar is that input's sub-score; the figure is the points it added to the 100-point composite (weight × sub-score).
- 1% rule +10.0/10.0
- Cash flow +7.6/30.0
- ARV discount +7.5/15.0
- Schools +4.3/10.0
- Livability +3.9/5.0
- Rent growth +3.6/5.0
- Condition / age +2.5/5.0
- DSCR +1.8/10.0
- Appreciation +0.0/10.0
$105,000
🖨 Deal sheet 📄 Offer letter ✓ Due diligence
Listing remarks
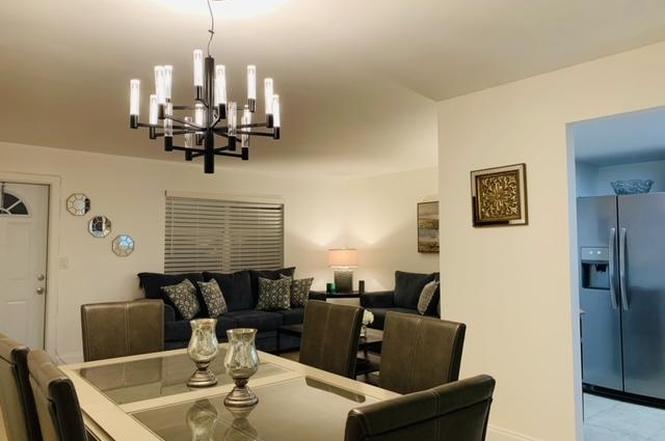
VERY NICE 1 BD, 1.5-BATH APARTMENT FOR SALE CURRENTLY RENTED FOR $1,550.00, CONDOMINIUM OFFERS MULTIPLE POOLS, GOLF COURSE, TENNIS COURTS, AND THEATER- STYLE AMENITIES, 15 MINUTES FROM THE BEACH GREAT INVESTMENT OPPORTUNITY
Key facts
- Tennis courts
- Multiple pools
- Golf course
Tags
Property features AI
Finance
- Financial info: Pets not allowed; Community includes 7,200 units
- HOA & community: HOA with monthly fee; HOA amenities include: pool, spa/hot tub, fitness center, clubhouse, billiard room, game room, tennis courts, golf course, community room, picnic area, workshop area, courtesy bus; HOA fee includes cable TV, insurance, grounds maintenance, security, common areas, and recreation facility
Exterior
- Parking: Assigned parking; Guest parking (1 open space)
- Security: Gated with guard
- Utilities: Public water; Public sewer; Three phase electric; Cable available
- Home design: Condominium; 2-story building; Faces east; Resale property
- Construction: CBS construction
- Exterior features: No waterfront; Accessible entrance; Gated community with guard
Interior
- Kitchen: Disposal; Dishwasher; Electric range
- Bedrooms: 1 bedroom on main level
- Flooring: Ceramic tile
- Bathrooms: 1 full bathroom; 1 half bathroom
- Heating & cooling: Central electric heat; Central electric air conditioning
- Interior features: Partially furnished; Blinds
- Laundry & utility: Interior laundry
Neighborhood map
What this means for you Summary
Snapshot
- This is a 1-bed/1.5-bath condo listed at $105k.
Deal economics
- At list price, monthly cash flow is $-124 ($-1k/yr) — negative.
- To cash-flow at today's rent, offer at most $87k (17.1% below list).
- Meets the 1% rule at list price ($2k rent vs $105k).
- Recommended offer: $87k (17.1% below list) — sets the bar for cash-flow.
Location & tenants
- Location reads 77/100 on livability (#202 in FL, #3,160 nationally) — a middle-class / working-renter tenant base. Strengths: housing A+, health & safety A+, commute A-; Watch: cost of living C-, crime D-, amenities F.
- Palm Beach (suburban): math 46% / reading 53% proficiency, ranked #34 of 73 in FL (top 47%) — families likely to look elsewhere, expect single-tenant / working-renter base with shorter leases.
- Zoned schools: Orchard View Elementary School (math 48% / reading 47%, grade D, #1,182 of 2,144 statewide, top 55%, 596 students, 76% FRL); Spanish River Community High School (math 64% / reading 74%, grade B, #63 of 667 statewide, top 10%, 2,578 students, 25% FRL) — zoned schools at 50% FRL track the district average.
- Market conditions: Rents rising fast (+4.3%/yr); 546 active listings in the ZIP; 39 comparable units currently listed for rent nearby; rentals at typical pace (median 21d on market — plan ~3-4 weeks tenant-placement turnaround); 3,974 units permitted in Palm Beach County in 2024 (1,012 in 5+ unit buildings).
- This rent runs 32% of the median local income ($62k/yr) — at the standard rent-burdened threshold; future hikes will face affordability resistance.
Forward outlook
- Local home prices are declining (-3.0%/yr); year-one equity from $726 of loan paydown is wiped out by about $3k of value loss. Plan a longer hold.
- Palm Beach County population projected at +30% by 2050 — long-run rental-demand tailwind backs the buy-and-hold thesis.
Negotiation context
- It's been on market 154 days — a 12% lower offer ($92k) is reasonable based on typical stale-listing flexibility.
- 4 sale attempts since 4y ago with the ask held roughly flat each time — persistent listings suggest the price (not the market) is what's stuck; bring a comps-based counter.
Risks & watch-outs
- Watch-outs: HOA is 43% of rent.
- Climate carrying-cost: severe wind risk, 99% chance of damaging wind over 30y; extreme-heat days projected 7→26/yr by 2055 (HVAC capex compounding) — expect insurance premiums to compound above CPI over the hold.
Questions for the listing agent
- What do current leases actually rent for vs. the listed asking? Can we see a recent rent roll and the last 12 months of T-12 income?
- It's been on market 154 days. Have you received any prior offers? Is the seller open to a 17% concession, seller financing, or rate buy-down credit?
- Built in 1975 — when were the roof, HVAC, electrical panel, plumbing, and water heater last replaced?
- What does the HOA fee cover, when was the last increase, and are there any pending special assessments or reserve-fund shortfalls?
- Any open or pending special assessments — roof, HVAC, plumbing, elevator, façade? What's the per-unit balance and payoff schedule, and is the seller paying it off at close or rolling it to the buyer?
- Why hasn't it sold? Are there any deal-killer items the seller is aware of (foundation, flood, title, zoning, code violations)?
- Is there a deadline driving the sale (1031 exchange, divorce, estate, relocation)? That informs how much negotiation room exists.
- Schools are B-rated — typically a magnet for longer-tenancy family renters. What's the average tenant stay here, and is there a school-zone premium baked into asking?
- Crime grade is D in this area — have there been break-ins, vandalism, or insurance claims at this property in the last 3 years? What carrier currently insures it and at what premium?
- The area grade is low — what's the realistic commute time and amenity access for the typical tenant pool here? Any planned neighborhood developments (good or bad) we should know about?
- What's the average days-on-market for RENTAL listings here right now (not sales)? A rising rental-DOM trend means longer vacancies and softer asking-rent achievability than the comps imply.
- What's the recent tenant-quality profile in this submarket — average credit score on applications, eviction rate, late-payment / NSF rate, and stable-employment percentage? A property-management company in the area should have these aggregated.
- How much new apartment / multifamily construction is in the pipeline within 1–3 miles? Heavy new supply (>2% of stock underway) typically softens rents 12–24 months out; light construction supports rent growth.
Investment metrics
- 1% rule
- 1.57% ✓
- Cap rate
- 4.88%
- Cash-on-cash
- -5.05%
- DSCR
- 0.78
- GRM
- 5.3
CMA / ARV
No comps found within radius.
Projected returns pro-forma
-3.0% appreciation · 4.28% rent growth · sell at horizon
- IRR
- -21.3%
- Equity multiple
- 0.24×
- Total profit
- $-22,295
- Equity at exit
- $15,656
- IRR
- -9.1%
- Equity multiple
- 0.37×
- Total profit
- $-18,658
- Equity at exit
- $9,078
Cash invested: $29,400 (down + closing). Projections, not guarantees.
Landlord ↔ Tenant lean methodology
- Overall (STATE)
- 87 Strongly Landlord-Friendly
- State Florida
- 87 Strongly Landlord-Friendly · R+3
- County
- — inherits STATE
- City
- — inherits STATE
ZIP-level market 33484
- Rents YoY
- 4.3%
- Active inventory
- 546
- Price-to-rent
- 5.3×
Monthly cashflow live
- Estimated rent
- $1,649 high interval (Pro) →
- Mortgage (P&I)
- −$551
- Tax est. 1.5%
- −$131 /mo · $1,575/yr
- Insurance
- −$44
- HOA
- −$701
- Vacancy / Maint / Mgmt
- −$346
- Net cashflow
- $-124
Break-even live
UW: 25.0% down · 7.5% · 30yr · 1.5% tax · 5.0% vac · 8.0% maint · 8.0% mgmt
Financing live
Cash to close
- Down payment
- $26,250
- Closing costs
- $3,150
- Reserves months
- —
- Total cash needed
- —
Loan-product check · same deal, 3 products live
Conventional
25% down · 7.5% · 30yr
- Down + closing
- —
- Monthly P&I
- —
- Monthly cashflow
- —
- DSCR
- —
- Eligible?
- —
Personal DTI + credit; lowest rate.
DSCR
20% down · 8.5% · 30yr
- Down + closing
- —
- Monthly P&I
- —
- Monthly cashflow
- —
- DSCR
- —
- Eligible?
- —
No personal income docs; deal must DSCR.
Hard money
10% down · 12.0% · 12mo
- Down + closing
- —
- Monthly P&I
- —
- Monthly cashflow
- —
- DSCR
- —
- Eligible?
- —
Short-term bridge; refi at stabilization.
Rent comps 39 comps
| Address | Beds | Baths | Sqft | Rent | $/sqft | DOM | Units | Dist |
|---|---|---|---|---|---|---|---|---|
| 522 Capri K Unit K Delray Beach, FL | 1.0 | 1.5 | 730 | $1,350 | $1.85 | 24d | 1 | 0.19mi |
| 111 Normandy Ln Delray Beach, FL | 1.0 | 1.5 | 726 | $1,450 | $2.00 | 1d | 1 | 0.59mi |
| 99 Saxony C Delray Beach, FL | 1.0 | 1.5 | 720 | $2,500 | $3.47 | 24d | 1 | 0.62mi |
| 151 Saxony D Delray Beach, FL | 1.0 | 1.5 | 726 | $1,500 | $2.07 | 11d | 1 | 0.64mi |
| 211 Saxony Ln #211 Delray Beach, FL | 1.0 | 1.5 | 720 | $1,400 | $1.94 | 7d | 1 | 0.69mi |
| 322 Seville N Delray Beach, FL | 1.0 | 1.5 | 720 | $1,495 | $2.08 | 24d | 1 | 0.77mi |
| 175 Valencia H Delray Beach, FL | 1.0 | 1.5 | 726 | $1,500 | $2.07 | 7d | 1 | 0.77mi |
| 318 Seville N #318 Delray Beach, FL | 1.0 | 1.5 | 720 | $1,495 | $2.08 | 24d | 1 | 0.81mi |
| 370 Saxony H Delray Beach, FL | 1.0 | 1.5 | 726 | $1,500 | $2.07 | 5d | 1 | 0.82mi |
| 23 Saxony a Delray Beach, FL | 1.0 | 1.5 | 726 | $1,300 | $1.79 | 7d | 1 | 0.83mi |
| 662 Saxony N Delray Beach, FL | 1.0 | 1.5 | 720 | $1,450 | $2.01 | 20d | 1 | 0.83mi |
| 594 Saxony Trl Unit 594 Delray Beach, FL | 1.0 | 1.5 | 720 | $1,550 | $2.15 | 2d | 1 | 0.83mi |
| 123 Saxony C Delray Beach, FL | 1.0 | 1.5 | 720 | $2,500 | $3.47 | 24d | 1 | 0.83mi |
| 594 Saxony Trl Unit 594 Delray Beach, FL | 1.0 | 1.5 | 720 | $1,650 | $2.29 | 24d | 1 | 0.83mi |
| 242 Seville K Unit 242 Delray Beach, FL | 1.0 | 1.5 | 720 | $1,380 | $1.92 | 24d | 1 | 0.86mi |
| 482 Monaco Blvd #482 Delray Beach, FL | 1.0 | 1.5 | 726 | $1,400 | $1.93 | 24d | 1 | 0.87mi |
| 399 Brittany I Delray Beach, FL | 1.0 | 1.5 | 720 | $1,450 | $2.01 | 12d | 1 | 0.87mi |
| 399 Brittany I Delray Beach, FL | 1.0 | 1.5 | 720 | $1,450 | $2.01 | 18d | 1 | 0.87mi |
| 451 Monaco Blvd Unit J Delray Beach, FL | 1.0 | 1.5 | 720 | $1,599 | $2.22 | 24d | 1 | 0.87mi |
| 459 Monaco Blvd Unit 459 Delray Beach, FL | 1.0 | 1.5 | 720 | $1,500 | $2.08 | 20d | 1 | 0.87mi |
| 711 Monaco O Delray Beach, FL | 1.0 | 1.5 | 720 | $1,550 | $2.15 | 24d | 1 | 0.87mi |
| 154 Seville G Delray Beach, FL | 1.0 | 1.0 | 720 | $1,490 | $2.07 | 14d | 1 | 0.87mi |
| 679 Saxony Way Delray Beach, FL | 1.0 | 1.5 | 720 | $1,600 | $2.22 | 5d | 1 | 0.88mi |
| 195 Monaco E Delray Beach, FL | 1.0 | 1.5 | 728 | $1,550 | $2.13 | 24d | 1 | 0.88mi |
| 126 Seville E Delray Beach, FL | 1.0 | 1.5 | 720 | $1,450 | $2.01 | 18d | 1 | 0.88mi |
| 459 Monaco J #459 Delray Beach, FL | 1.0 | 1.5 | 720 | $1,400 | $1.94 | 1d | 1 | 0.94mi |
| 58 Monaco Blvd Unit 58 Delray Beach, FL | 1.0 | 1.5 | 720 | $1,650 | $2.29 | 24d | 1 | 0.97mi |
| 286 Monaco F Delray Beach, FL | 1.0 | 2.0 | 726 | $1,700 | $2.34 | 24d | 1 | 0.97mi |
| 11 Brittany a Delray Beach, FL | 1.0 | 1.5 | 725 | $1,500 | $2.07 | 7d | 1 | 1.02mi |
| 675 Brittany O Delray Beach, FL | 1.0 | 1.5 | 720 | $1,500 | $2.08 | 24d | 1 | 1.02mi |
| 159 Brittany Ter Unit 159 Delray Beach, FL | 1.0 | 1.5 | 720 | $1,795 | $2.49 | 16d | 1 | 1.04mi |
| 419 Brittany I Delray Beach, FL | 1.0 | 1.5 | 720 | $1,450 | $2.01 | 24d | 1 | 1.04mi |
| 270 Brittany F Unit F Delray Beach, FL | 1.0 | 1.5 | 720 | $1,600 | $2.22 | 7d | 1 | 1.04mi |
| 43 Waterford B Delray Beach, FL | 1.0 | 1.5 | 720 | $1,400 | $1.94 | 24d | 1 | 1.06mi |
| 686 Brittany O Delray Beach, FL | 1.0 | 1.5 | 720 | $1,600 | $2.22 | 24d | 1 | 1.06mi |
| 715 Saxony O Delray Beach, FL | 1.0 | 1.5 | 726 | $1,200 | $1.65 | 24d | 1 | 1.08mi |
| 102 Waterford D Unit 102 Delray Beach, FL | 1.0 | 1.5 | 720 | $1,900 | $2.64 | 24d | 1 | 1.09mi |
| 718 Brittany Park #718 Delray Beach, FL | 1.0 | 1.5 | 720 | $1,795 | $2.49 | 16d | 1 | 1.09mi |
| 163 Tuscany C Unit C Delray Beach, FL | 1.0 | 1.5 | 720 | $1,300 | $1.81 | 14d | 1 | 1.24mi |
HOA detail condo
- Monthly dues
- $701 · $8,412/yr
- Likely covers
- pool
- Assessments
- None detected in remarks — confirm with the listing agent.
Listing history 19 events
-
2026-06-18days on market $105,000 Active 154 DOM
-
2026-06-17days on market $105,000 Active 153 DOM
-
2026-06-16days on market $105,000 Active 152 DOM
-
2026-06-15days on market $105,000 Active 151 DOM
-
2026-06-13days on market $105,000 Active 149 DOM
-
2026-06-09days on market $105,000 Active 145 DOM
-
2026-06-07days on market $105,000 Active 143 DOM
-
2026-06-04days on market $105,000 Active 140 DOM
-
2026-06-03days on market $105,000 Active 139 DOM
-
2026-06-01days on market $105,000 Active 137 DOM
-
2026-05-31days on market $105,000 Active 136 DOM
-
2026-01-15$105,000 Active
-
2024-06-05historical
-
2024-05-30price $132,000
-
2023-12-08status Active
-
2023-12-05historical
-
2023-12-04$137,000
-
2023-06-01historical
-
2022-11-08$135,000 Active
ⓘ Source: listings_history table (triggers on properties + properties_extension) + one-shot
backfill from property_details.listing_events for pre-trigger history.
Climate risk First Street
- Flood 1/10 Low FEMA zone X (unshaded) · 0% chance over 30 yrs
- Wildfire 1/10 Low
- Heat 9/10 Extreme 7 d/yr ≥107°F today · 26 d/yr by 30 yrs out
- Wind 10/10 Extreme 99% chance of damaging wind over 30 yrs
- Air quality 3/10 Moderate 2 unhealthy d/yr today · 3 by 30 yrs out
Nearby sold comps map
Loading sold comps map…
Walkable amenities ~0.75 mi
Loading nearby amenities…
Taxation est. · year 1
- Rental income
- $19,789
- − Mortgage interest
- −$5,882
- − Property taxes
- −$1,575
- − Insurance
- −$525
- − Repairs & maintenance
- −$1,583
- − Management
- −$1,583
- − HOA
- −$8,412
- − Depreciation
- −$3,055
- Taxable loss
- −$2,825
- Est. tax savings @ 24.0%
- +$678
- After-tax cash flow
- $-808/yr
For passive investors: Depreciation is non-cash, so a rental often shows a tax loss while cash-flowing — sheltering income. Rental losses are passive: they offset passive income freely, and up to $25,000/yr can offset ordinary (W-2) income if you actively participate and your MAGI is under $100k (phasing out to $0 by $150k); unused losses carry forward. On sale, claimed depreciation is recaptured at up to 25%, and gains may owe capital-gains tax (a 1031 exchange can defer both). Figures are a year-1 estimate at your 24.0% rate — not tax advice; consult a CPA.
Schools (NCES district)
- District
- Palm Beach
- NCES district ID
- 1201500
- Math proficiency
- 46% ▼ -16.00%
- Reading proficiency
- 53% ▼ -4.00%
- Median HH income
- $53,943
- Composite
- 42.72/100
- National rank
- #3160
- State rank
- #34 of 73 in FL
Livability — Delray Beach
- Score
- 77/100
- State rank
- #202
- US rank
- #3160
Category grades
Schools grade is shown separately in the Schools card above.
Census & demographics
- County
- Palm Beach County · 1,438,312 people
- City population
- 123,167
- Metro
- Miami-Fort Lauderdale-Pompano Beach, FL
- Population (ZIP)
- 26,208
- Household income
- $62,151
- Rent vs Own
- Severe rent burden
- 991.0
Population outlook (Palm Beach County) Hauer SSP2
- Today (2025)
- 1,637,487 people
- By 2030
- 1,743,255 · +6.5%
- By 2040
- 1,948,712 · +19.0%
- By 2050
- 2,132,979 · +30.3%
- By 2075
- 2,530,027 · +54.5%
- By 2100
- 2,706,979 · +65.3%
Race, ethnicity, and origin ACS 2023
- Neighborhood character
- Predominantly White (74%)
- Race & ethnicity
- White 74% Hispanic / Latino 14% Two or more races 10% Black 5% Asian 2%
- Hispanic origin (detail)
- Puerto Rican 2% Cuban 2%
- Common ancestry
- Scotch-Irish 7% Romanian 6% Italian 2%
- Foreign-born
- 23% · Canada, Jamaica, China
- Languages at home
- 76% English-only · Spanish 13% Russian/Polish/Slavic 3% French/Haitian/Cajun 3%
Political lean MEDSL · Palm Beach
- 2024 margin
- Toss-up / Even · D 50.0% · R 49.2%
- 2008→2024 swing
- -22.1pp toward R · 2008: 22.9pp · 2024: 0.8pp
- All cycles
- 2024: D+0.8 2020: D+12.8 2016: D+15.3 2012: D+17.0 2008: D+22.9
Not yet ingested
- Civics
- —
Market trends
- HPI YoY
- ▼ -232.73%
- Current HPI
- 254.5016
- Rent YoY
- ▲ 4.28%
- Metro
- Miami-Fort Lauderdale-Pompano Beach, FL
- State GDP YoY
- ▲ 3.28%
- F500 in state
- 36
Industry mix (Fortune 500 HQ in FL)
| Industry | F500 HQs | Revenue |
|---|---|---|
| Industrial Technology | 2 | $29B |
|
||
| Insurance | 2 | $17B |
|
||
| Retail | 1 | $60B |
|
||
| Technology Distribution | 1 | $58B |
|
||
| Homebuilding | 1 | $35B |
|
||
| Technology Manufacturing | 1 | $35B |
|
||
Price history
-22.2% since first listed8 events — show timeline
- 2026-01-15 Listed $105,000 Beaches MLS
- 2024-06-05 Listing Removed — Beaches MLS
- 2024-05-30 Price Changed $132,000 Beaches MLS
- 2023-12-08 Relisted — Beaches MLS
- 2023-12-05 Listing Removed — Beaches MLS
- 2023-12-04 Listed $137,000 Beaches MLS
- 2023-06-01 Listing Removed — Beaches MLS
- 2022-11-08 Listed $135,000 Beaches MLS
Cash-flow waterfall
monthlySold comps — $/sqft
last 12 mo · ≤1 miLoading sold comps…