 🏷️ Likely Rental
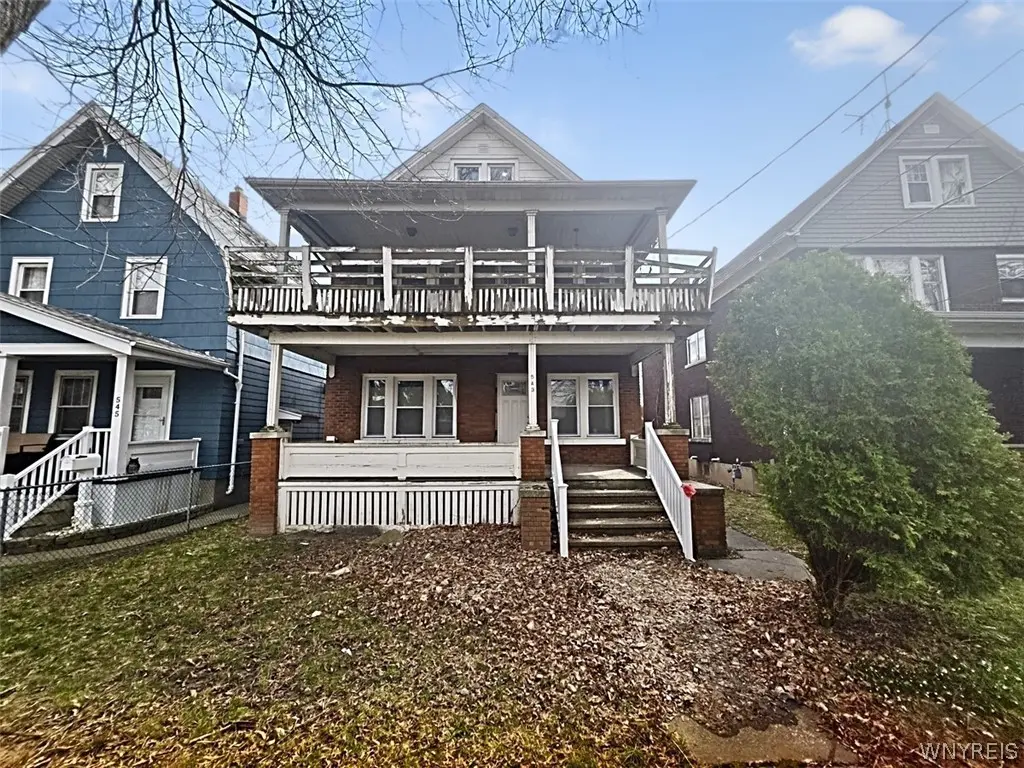
543 25th St · Niagara Falls, NY
Flood risk 1/10 · Minimal
- FEMA flood zone
- X (unshaded)
- Chance of flooding over 30 yrs
- 0.0%
- Est. flood insurance / yr
- $473 – $860
Fire risk 1/10 · Minimal
- Est. fire insurance / yr
- $691 – $1,283
Heat risk 2/10 · Minimal
- Hot days now (above 94°F)
- 7 days/yr
- Hot days in 30 yrs
- 15 days/yr
Wind risk 1/10 · Minimal
- Chance of severe wind over 30 yrs
- —
Air-quality risk 3/10 · Minor
- Unhealthy air days now
- 2 days/yr
- Unhealthy air days in 30 yrs
- 3 days/yr
Risk factors via First Street. Map © Google.
Why this score? — see what drove the A- grade
The composite is a weighted blend of 9 inputs, each scored 0–100. Each bar is that input's sub-score; the figure is the points it added to the 100-point composite (weight × sub-score).
- Cash flow +30.0/30.0
- 1% rule +10.0/10.0
- DSCR +10.0/10.0
- Appreciation +10.0/10.0
- ARV discount +7.5/15.0
- Rent growth +4.7/5.0
- Livability +3.0/5.0
- Schools +2.5/10.0
- Condition / age +2.5/5.0
$79,900
🖨 Deal sheet 📄 Offer letter ✓ Due diligence
Multi-family units
County records classify this as Multi-Family (2-4 Unit). Listing-text estimate: 2 units. confirmed
Listing remarks MLS
Let your tenant pay your mortgage! 2 bedrooms, eat in kitchen, living room and dining room in each unit. Separate utilities. Motivated seller says "Bring me an offer!"
Key facts
- Brick duplex
- Double porches
- Full basement
Tags
Property features AI
Finance
- Financial info: Owner pays water for the property; Operating expenses include water
Exterior
- Parking: Detached 2-car garage; Two or more off-street parking spaces
- Utilities: Public water connected; Sewer connected
- Home design: Two-story multi-family building; Existing/resale property
- Construction: Brick and frame construction; Built as existing (year built: existing)
- Exterior features: Fully fenced lot; Rectangular residential lot with city street frontage; Lot dimensions approximately 35 x 124
Interior
- Kitchen: Each unit includes an eat-in kitchen
- Bedrooms: Two 2-bedroom units (each unit has 2 bedrooms)
- Flooring: Hardwood; Laminate; Vinyl; Varies
- Bathrooms: Each unit has 1 full bathroom (2 full baths total)
- Heating & cooling: Gas forced-air heating
- Interior features: Hardwood, laminate, vinyl, and mixed flooring throughout; Full basement
- Laundry & utility: Gas water heater; Separate gas and electric meters for each unit
Neighborhood map
What this means for you Summary
Snapshot
- This is a 2 × 2-bed/1.0-bath units multifamily listed at $80k.
Deal economics
- At list price, monthly cash flow is $1k ($17k/yr) — positive. Per door: $704/mo.
- The deal already cash-flows at list — no discount required.
- Meets the 1% rule at list price ($2k rent vs $80k).
- Recommended offer: $78k (3.0% below list) — sets the bar for market timing.
- Cap rate 27.4% vs local median 7.7% in Niagara Falls — top-decile yield for the area; either an underpriced asset or a hidden risk that comps aren't pricing in. Stress-test before assuming the spread holds.
Location & tenants
- Location reads 60/100 on livability (#956 in NY) — a middle-class / working-renter tenant base. Strengths: cost of living A+, housing A+; Watch: schools F, crime F, amenities F.
- Niagara Falls City School District (urban): math 26% / reading 34% proficiency, ranked #578 of 590 in NY (top 98%) — families likely to look elsewhere, expect single-tenant / working-renter base with shorter leases; 66% free/reduced lunch — lower-income household profile, screen leases tightly.
- Market conditions: Rents rising fast (+8.8%/yr); 164 active listings in the ZIP; 2 comparable units currently listed for rent nearby; lower-income renter base — watch delinquency; 167 units permitted in Niagara County in 2024 (0 in 5+ unit buildings).
- At $2,482/mo this rent would consume 86% of the median local household income ($35k/yr) (locally 954% of renters already pay >50% of income on rent) — very limited rent-growth headroom before tenants either downsize or default.
Forward outlook
- In year one you build about $9k of equity ($552 loan paydown + $8k appreciation (10.0% local appreciation)).
- Niagara County population projected at -19% by 2050 — secular population decline; favor cash flow + early exit over multi-decade hold.
- At projected returns (10.0% appreciation + 8.0% rent growth), your $22k cash investment doubles in ~1 year — after that, you're playing with house money.
- By year 4, paydown + projected appreciation supports a ~$30k cash-out refi (75% LTV) — recoverable capital for the next deal without selling this one.
Negotiation context
- It's been on market 46 days — a 3% lower offer ($78k) is reasonable based on typical stale-listing flexibility.
- 3 sale attempts since 11y ago with the ask held roughly flat each time — persistent listings suggest the price (not the market) is what's stuck; bring a comps-based counter.
- Current owner paid $52k; list at $80k implies a 55% gain — meaningful room to come down on a strong offer.
Risks & watch-outs
- Watch-outs: built in 1930 — expect roof / HVAC / electrical / plumbing capex.
Questions for the listing agent
- It's been on market 46 days. Have you received any prior offers? Is the seller open to a 3% concession, seller financing, or rate buy-down credit?
- Can we see the unit-by-unit rent roll, current vacancy, and any below-market leases? What's the average tenancy length?
- What capital expenditures (roof, boiler, parking lot, exteriors) have been made in the last 5 years, and what's planned in the next 2?
- Built in 1930 — when were the roof, HVAC, electrical panel, plumbing, and water heater last replaced?
- Is there a deadline driving the sale (1031 exchange, divorce, estate, relocation)? That informs how much negotiation room exists.
- Schools are F-rated, which usually means shorter tenancies and higher turnover. Who's the typical renter profile here, and what's been the actual vacancy rate?
- Crime grade is F in this area — have there been break-ins, vandalism, or insurance claims at this property in the last 3 years? What carrier currently insures it and at what premium?
- What's the average days-on-market for RENTAL listings here right now (not sales)? A rising rental-DOM trend means longer vacancies and softer asking-rent achievability than the comps imply.
- What's the recent tenant-quality profile in this submarket — average credit score on applications, eviction rate, late-payment / NSF rate, and stable-employment percentage? A property-management company in the area should have these aggregated.
- How much new apartment / multifamily construction is in the pipeline within 1–3 miles? Heavy new supply (>2% of stock underway) typically softens rents 12–24 months out; light construction supports rent growth.
Investment metrics
- 1% rule
- 3.11% ✓
- Cap rate
- 27.45%
- Cash-on-cash
- 75.56%
- DSCR
- 4.36
- GRM
- 2.7
CMA / ARV
- ARV (median comp)
- $244,043
- List price
- $79,900
- Delta
- -67.26%
- Verdict
- UNDERPRICED
- Comps
- 20 within 1.0 mi
Show comp detail 12 sales within ~0.75 mi
| Address | Dist | Beds/Ba | Sqft | Sold | Price | $/sf | Match |
|---|---|---|---|---|---|---|---|
| 609 24th St | 0.09mi | 4/2.0 | 2,000 (-1%) | 4mo | $140,000 | $70 | 91 |
| 2615 Ferry Ave | 0.15mi | 4/2.0 | 1,848 (-8%) | 6mo | $115,000 | $62 | 74 |
| 2449 Grand Ave | 0.21mi | 5/2.0 (+1) | 1,918 (-5%) | 4mo | $135,000 | $70 | 74 |
| 541 20th St | 0.29mi | 5/2.0 (+1) | 1,917 (-5%) | 1mo | $112,000 | $58 | 73 |
| 2459 La Salle Ave | 0.47mi | 4/2.0 | 1,920 (-5%) | 2mo | $160,000 | $83 | 69 |
| 2219 Cudaback Ave | 0.52mi | 4/2.0 | 2,000 (-1%) | 8mo | $80,000 | $40 | 68 |
| 2455 La Salle Ave | 0.47mi | 4/2.0 | 2,152 (+7%) | 3mo | $112,000 | $52 | 65 |
| 2409 La Salle Ave | 0.47mi | 4/2.0 | 2,154 (+7%) | 6mo | $185,000 | $86 | 61 |
| 2443 Pierce Ave | 0.59mi | 4/2.0 | 2,112 (+5%) | 4mo | $120,000 | $57 | 61 |
| 2734 Forest Ave | 0.42mi | 4/2.0 | 2,208 (+10%) | 7mo | $160,000 | $72 | 59 |
| 346 Portage Rd | 0.69mi | 3/2.0 (-1) | 1,940 (-4%) | 4mo | $142,500 | $73 | 54 |
| 1023 15th St | 0.74mi | 5/4.0 (+1) | 2,304 (+14%) | 5mo | $190,000 | $82 | 24 |
Match score weights: distance 35% · size 25% · config 20% · recency 20%. Top-matched comps best support the ARV.
Projected returns pro-forma
10.0% appreciation · 8.0% rent growth · sell at horizon
- IRR
- 90.4%
- Equity multiple
- 7.54×
- Total profit
- $146,385
- Equity at exit
- $71,980
- IRR
- 86.7%
- Equity multiple
- 18.57×
- Total profit
- $393,098
- Equity at exit
- $155,228
Cash invested: $22,372 (down + closing). Projections, not guarantees.
Landlord ↔ Tenant lean methodology
- Overall (STATE)
- 15 Strongly Tenant-Friendly
- State New York
- 15 Strongly Tenant-Friendly · D+10
- County
- — inherits STATE
- City
- — inherits STATE
ZIP-level market 14301
- Home prices YoY
- 6.2%
- Rents YoY
- 8.8%
- Active inventory
- 164
- Price-to-rent
- 5.4×
Monthly cashflow live
- Estimated rent
- $2,482 high interval (Pro) →
- Mortgage (P&I)
- −$419
- Tax est. 1.5%
- −$100 /mo · $1,198/yr
- Insurance
- −$33
- HOA
- −$0
- Vacancy / Maint / Mgmt
- −$521
- Net cashflow
- $1,409
Break-even live
2-unit breakdown (identical units grouped — click to expand)
| Units | Beds | Baths | Est. rent |
|---|---|---|---|
| 2× units | 2 | 1 | $2,482 |
| #1 | 2 | 1 | $1,241 |
| #2 | 2 | 1 | $1,241 |
| Total (2 units) | $2,482 | ||
UW: 25.0% down · 7.5% · 30yr · 1.5% tax · 5.0% vac · 8.0% maint · 8.0% mgmt
Financing live
Cash to close
- Down payment
- $19,975
- Closing costs
- $2,397
- Reserves months
- —
- Total cash needed
- —
Loan-product check · same deal, 3 products live
Conventional
25% down · 7.5% · 30yr
- Down + closing
- —
- Monthly P&I
- —
- Monthly cashflow
- —
- DSCR
- —
- Eligible?
- —
Personal DTI + credit; lowest rate.
DSCR
20% down · 8.5% · 30yr
- Down + closing
- —
- Monthly P&I
- —
- Monthly cashflow
- —
- DSCR
- —
- Eligible?
- —
No personal income docs; deal must DSCR.
Hard money
10% down · 12.0% · 12mo
- Down + closing
- —
- Monthly P&I
- —
- Monthly cashflow
- —
- DSCR
- —
- Eligible?
- —
Short-term bridge; refi at stabilization.
Rent comps 2 comps
| Address | Beds | Baths | Sqft | Rent | $/sqft | DOM | Units | Dist |
|---|---|---|---|---|---|---|---|---|
| 1935 Niagara St Unit Upper Niagara Falls, NY | 3.0 | 1.0 | 2685 | $1,200 | $0.45 | 14d | 1 | 0.42mi |
| 2020 Forest Ave Niagara Falls, NY | 4.0 | 2.0 | 1600 | $1,500 | $0.94 | 17d | 1 | 0.43mi |
Listing history 24 events
-
2026-06-18days on market $79,900 Active 46 DOM
-
2026-06-17days on market $79,900 Active 45 DOM
-
2026-06-16days on market $79,900 Active 44 DOM
-
2026-06-15days on market $79,900 Active 43 DOM
-
2026-06-13days on market $79,900 Active 41 DOM
-
2026-06-13days on market $79,900 Active 40 DOM
-
2026-06-10days on market $79,900 Active 38 DOM
-
2026-06-09days on market $79,900 Active 37 DOM
-
2026-06-08days on market $79,900 Active 36 DOM
-
2026-06-07days on market $79,900 Active 35 DOM
-
2026-06-03days on market $79,900 Active 31 DOM
-
2026-06-02days on market $79,900 Active 30 DOM
-
2026-06-01days on market $79,900 Active 29 DOM
-
2026-05-31days on market $79,900 Active 28 DOM
-
2026-05-03$79,900 Active 713-char remark
-
2022-12-22historical
-
2022-09-22$109,900 Active
-
2016-03-04soldstatus $51,500
-
2015-08-19soldstatus $33,500 Closed Sale or Rented
Show marketing remark (177 chars)
Let your tenant pay your mortgage! 2 bedrooms, eat in kitchen, living room and dining room in each unit. Separate utilities. Motivated seller says "Bring me an offer!"
-
2015-08-19soldstatus $33,500
Show marketing remark (177 chars)
Let your tenant pay your mortgage! 2 bedrooms, eat in kitchen, living room and dining room in each unit. Separate utilities. Motivated seller says "Bring me an offer!"
-
2015-07-16status Pending Sale
Show marketing remark (177 chars)
Let your tenant pay your mortgage! 2 bedrooms, eat in kitchen, living room and dining room in each unit. Separate utilities. Motivated seller says "Bring me an offer!"
-
2015-05-27price $44,900
Show marketing remark (177 chars)
Let your tenant pay your mortgage! 2 bedrooms, eat in kitchen, living room and dining room in each unit. Separate utilities. Motivated seller says "Bring me an offer!"
-
2015-05-13$49,900 Active
Show marketing remark (177 chars)
Let your tenant pay your mortgage! 2 bedrooms, eat in kitchen, living room and dining room in each unit. Separate utilities. Motivated seller says "Bring me an offer!"
-
1993-06-07soldstatus $56,000
ⓘ Source: listings_history table (triggers on properties + properties_extension) + one-shot
backfill from property_details.listing_events for pre-trigger history.
Climate risk First Street
- Flood 1/10 Low FEMA zone X (unshaded) · 0% chance over 30 yrs
- Wildfire 1/10 Low
- Heat 2/10 Low 7 d/yr ≥94°F today · 15 d/yr by 30 yrs out
- Wind 1/10 Low
- Air quality 3/10 Moderate 2 unhealthy d/yr today · 3 by 30 yrs out
Nearby sold comps map
Loading sold comps map…
Walkable amenities ~0.75 mi
Loading nearby amenities…
Taxation est. · year 1
- Rental income
- $29,784
- − Mortgage interest
- −$4,476
- − Property taxes
- −$1,198
- − Insurance
- −$400
- − Repairs & maintenance
- −$2,383
- − Management
- −$2,383
- − Depreciation
- −$2,324
- Taxable income
- $16,621
- Est. tax owed @ 24.0%
- −$3,989
- After-tax cash flow
- $12,914/yr
For passive investors: Depreciation is non-cash, so a rental often shows a tax loss while cash-flowing — sheltering income. Rental losses are passive: they offset passive income freely, and up to $25,000/yr can offset ordinary (W-2) income if you actively participate and your MAGI is under $100k (phasing out to $0 by $150k); unused losses carry forward. On sale, claimed depreciation is recaptured at up to 25%, and gains may owe capital-gains tax (a 1031 exchange can defer both). Figures are a year-1 estimate at your 24.0% rate — not tax advice; consult a CPA.
Schools (NCES district)
- District
- Niagara Falls City School District
- NCES district ID
- 3620820
- Math proficiency
- 26% ▼ -10.00%
- Reading proficiency
- 34% ▲ 3.00%
- Median HH income
- $32,488
- Composite
- 24.5/100
- National rank
- #7655
- State rank
- #578 of 590 in NY
Livability — Niagara Falls
- Score
- 60/100
- State rank
- #956
- US rank
- #18749
Category grades
Schools grade is shown separately in the Schools card above.
Census & demographics
- Census place
- Niagara Falls, NY
- County
- Niagara County · 157,377 people
- City population
- 62,983
- Metro
- Buffalo-Cheektowaga, NY
- Population (ZIP)
- 10,923
- Household income
- $34,549
- Rent vs Own
- Severe rent burden
- 954.0
Population outlook (Niagara County) Hauer SSP2
- Today (2025)
- 204,149 people
- By 2030
- 197,900 · -3.1%
- By 2040
- 182,239 · -10.7%
- By 2050
- 165,198 · -19.1%
- By 2075
- 129,416 · -36.6%
- By 2100
- 96,222 · -52.9%
Race, ethnicity, and origin ACS 2023
- Neighborhood character
- Diverse neighborhood (Simpson 0.58)
- Race & ethnicity
- White 59% Black 25% Two or more races 8% Hispanic / Latino 8% Asian 2%
- Hispanic origin (detail)
- Puerto Rican 3% Cuban 2%
- Common ancestry
- Romanian 6% Slovak 2% Lithuanian 1%
- Foreign-born
- 5% · Canada, China, Dominican Republic
- Languages at home
- 90% English-only · Spanish 6% Other Indo-European 3% Chinese 1%
Political lean MEDSL · Niagara
- 2024 margin
- R (+14.9) · D 42.5% · R 57.5%
- 2008→2024 swing
- -15.9pp toward R · 2008: 1.0pp · 2024: -14.9pp
- All cycles
- 2024: R+14.9 2020: R+9.7 2016: R+19.0 2012: D+0.6 2008: D+1.0
Not yet ingested
- Civics
- —
Market trends
- HPI YoY
- ▲ 15.41%
- Current HPI
- 266.1457
- Rent YoY
- ▲ 8.79%
- Metro
- Buffalo-Cheektowaga, NY
- State GDP YoY
- ▲ 2.60%
- F500 in state
- 92
Industry mix (Fortune 500 HQ in NY)
| Industry | F500 HQs | Revenue |
|---|---|---|
| Financial Services | 10 | $950B |
|
||
| Consumer Goods | 9 | $162B |
|
||
| Insurance | 4 | $225B |
|
||
| Telecommunications | 2 | $144B |
|
||
| Pharmaceuticals | 2 | $112B |
|
||
| Media / Entertainment | 2 | $69B |
|
||
Price history
+42.7% since first listed10 events — show timeline
- 2026-05-03 Listed $79,900 WNYREIS
- 2022-12-22 Listing Removed — WNYREIS
- 2022-09-22 Listed $109,900 WNYREIS
- 2016-03-04 Sold (Public Records) $51,500 Public Records
- 2015-08-19 Sold (Public Records) $33,500 Public Records
- 2015-08-19 Sold (MLS) $33,500 WNYREIS
- 2015-07-16 Pending — WNYREIS
- 2015-05-27 Price Changed $44,900 WNYREIS
- 2015-05-13 Listed $49,900 WNYREIS
- 1993-06-07 Sold (Public Records) $56,000 Public Records
Property tax history
+7.6%/yrLatest (2025): $4,149 · +17.9% YoY. Source: county tax records.
Cash-flow waterfall
monthlySold comps — $/sqft
last 12 mo · ≤1 miLoading sold comps…