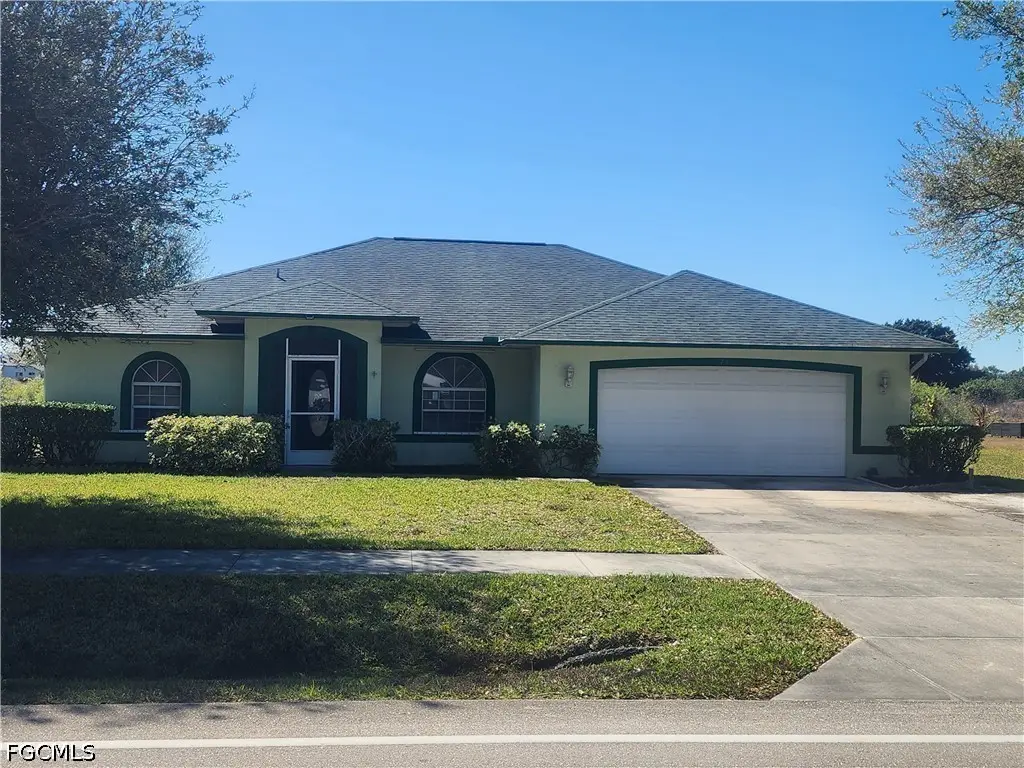
746 Milwaukee Blvd · Lehigh Acres, FL
Flood risk 1/10 · Minimal
- FEMA flood zone
- X (unshaded)
- Chance of flooding over 30 yrs
- 0.0%
- Est. flood insurance / yr
- $507 – $1,088
Fire risk 2/10 · Minimal
- Est. fire insurance / yr
- $947 – $1,759
Heat risk 9/10 · Severe
- Hot days now (above 108°F)
- 7 days/yr
- Hot days in 30 yrs
- 27 days/yr
Wind risk 10/10 · Severe
- Chance of severe wind over 30 yrs
- 99.0%
Air-quality risk 2/10 · Minimal
- Unhealthy air days now
- 1 days/yr
- Unhealthy air days in 30 yrs
- 2 days/yr
Risk factors via First Street. Map © Google.
Why this score? — see what drove the D grade
The composite is a weighted blend of 9 inputs, each scored 0–100. Each bar is that input's sub-score; the figure is the points it added to the 100-point composite (weight × sub-score).
- ARV discount +11.2/15.0
- Appreciation +10.0/10.0
- Cash flow +7.9/30.0
- Schools +4.1/10.0
- Livability +3.0/5.0
- Condition / age +2.5/5.0
- DSCR +2.0/10.0
- 1% rule +1.4/10.0
- Rent growth +1.3/5.0
$329,900
🖨 Deal sheet 📄 Offer letter ✓ Due diligence
Listing remarks MLS
Golf course and lake views . compare with other homes in area, this home is on city water and sewer with all assessments paid. Nicely manicured landscaping on 3/4 acre lot! This well maintained pool home is move in ready. Enjoy the expansive views as you enter the home or view from your family room. The large kitchen features an island and plenty of storage space. All bedrooms are spacious, master bedroom has asliding glass door to lanai. Master bath features his & her sinks. Oversized garage has space for your golfcart. The pool is heated and features a spill over waterfall. Outdoor shower has hot and cold water and there is an outside pool bath as well as pool storage. There is a screened front entry, new microwave, refrigerator & water heater. Compare this home with others in the area- Located in a nice community of homes, definitely worth seeing and best of all no maintenance fees to enjoy the views!
Key facts
- Pool bath
- Lake view
- Outdoor shower
Tags
Property features AI
Finance
- Financial info: Pets allowed
- HOA & community: Community with golf course access
Exterior
- Parking: Attached 2-car garage; Covered parking for 2 vehicles
- Security: Smoke detectors
- Utilities: Public water; Public sewer; Cable available
- Home design: Single-story; North-facing entry; Resale property; Entry on level 1
- Construction: Block, concrete and stucco construction; Shingle roof
- Exterior features: Deck; Porch; Lanai; Screened porch; Water feature; Private in-ground concrete pool with screen enclosure; Irrigation from well; Paved road access; Oversized lot; Lakefront
Interior
- Kitchen: Dishwasher; Microwave; Range; Refrigerator; Kitchen island
- Bedrooms: Split bedroom layout
- Flooring: Carpet; Tile
- Bathrooms: 2 full bathrooms; 1 half bathroom
- Heating & cooling: Central heating (electric); Central air; Ceiling fans
- Interior features: High ceilings; Kitchen island; Dual sinks; Family/dining room; Living/dining room; Cable TV; Walk-in closet(s); Window treatments; Window coverings; Split bedrooms
- Laundry & utility: Washer hookup; Dryer hookup
Neighborhood map
What this means for you Summary
Snapshot
- This is a 3-bed/3.0-bath single-family listed at $330k.
Deal economics
- At list price, monthly cash flow is $-349 ($-4k/yr) — negative.
- To cash-flow at today's rent, offer at most $268k (18.7% below list).
- To meet the 1% rule (rent ≥ 1% of price), the offer needs to be $210k (36.3% below list).
- Recommended offer: $210k (36.3% below list) — sets the bar for 1% rule.
Location & tenants
- Location reads 59/100 on livability (#826 in FL) — a working-class tenant base; expect higher turnover. Strengths: cost of living A+, housing A+; Watch: crime C-, employment D+, schools D-.
- Lee (suburban): math 47% / reading 50% proficiency, ranked #42 of 73 in FL (top 58%) — families likely to look elsewhere, expect single-tenant / working-renter base with shorter leases.
- Market conditions: Rents falling (-4.7%/yr); 2460 active listings in the ZIP; 40 comparable units currently listed for rent nearby; rentals at typical pace (median 21d on market — plan ~3-4 weeks tenant-placement turnaround); 15,411 units permitted in Lee County in 2024 (4,686 in 5+ unit buildings).
- This rent runs 35% of the median local income ($72k/yr) — at the standard rent-burdened threshold; future hikes will face affordability resistance.
Forward outlook
- In year one you build about $35k of equity ($2k loan paydown + $33k appreciation (10.0% local appreciation)).
- Lee County population projected at +44% by 2050 — long-run rental-demand tailwind backs the buy-and-hold thesis.
- By year 2, paydown + projected appreciation supports a ~$57k cash-out refi (75% LTV) — recoverable capital for the next deal without selling this one.
Negotiation context
- It's been on market 77 days — a 6% lower offer ($310k) is reasonable based on typical stale-listing flexibility.
- 2 sale attempts since 28y ago with the ask held roughly flat each time — persistent listings suggest the price (not the market) is what's stuck; bring a comps-based counter.
- Current owner paid $145k; list at $330k implies a 128% gain — meaningful room to come down on a strong offer.
Risks & watch-outs
- Climate carrying-cost: severe wind risk, 99% chance of damaging wind over 30y; extreme-heat days projected 7→27/yr by 2055 (HVAC capex compounding) — expect insurance premiums to compound above CPI over the hold.
Questions for the listing agent
- What do current leases actually rent for vs. the listed asking? Can we see a recent rent roll and the last 12 months of T-12 income?
- It's been on market 77 days. Have you received any prior offers? Is the seller open to a 36% concession, seller financing, or rate buy-down credit?
- Why hasn't it sold? Are there any deal-killer items the seller is aware of (foundation, flood, title, zoning, code violations)?
- Is there a deadline driving the sale (1031 exchange, divorce, estate, relocation)? That informs how much negotiation room exists.
- Schools are D-rated, which usually means shorter tenancies and higher turnover. Who's the typical renter profile here, and what's been the actual vacancy rate?
- The area grade is low — what's the realistic commute time and amenity access for the typical tenant pool here? Any planned neighborhood developments (good or bad) we should know about?
- What's the average days-on-market for RENTAL listings here right now (not sales)? A rising rental-DOM trend means longer vacancies and softer asking-rent achievability than the comps imply.
- What's the recent tenant-quality profile in this submarket — average credit score on applications, eviction rate, late-payment / NSF rate, and stable-employment percentage? A property-management company in the area should have these aggregated.
- How much new for-sale + rental construction is in the pipeline within 1–3 miles? Heavy new supply typically softens prices + rents 12–24 months out; constrained supply supports both.
Investment metrics
- 1% rule
- 0.64% ✗
- Cap rate
- 5.02%
- Cash-on-cash
- -4.53%
- DSCR
- 0.80
- GRM
- 13.1
CMA / ARV
- ARV (on-the-fly)
- $359,062
- Comps found
- 12
Show comp detail 12 sales within ~0.75 mi
| Address | Dist | Beds/Ba | Sqft | Sold | Price | $/sf | Match |
|---|---|---|---|---|---|---|---|
| 745 David Laird Ln | 0.19mi | 3/3.0 | 1,722 (+0%) | 11mo | $550,000 | $319 | 82 |
| 821 Frederick Reid St E | 0.39mi | 3/2.0 | 1,614 (-6%) | 1mo | $315,000 | $195 | 67 |
| 819 Frederick Reid St E | 0.38mi | 3/2.0 | 1,601 (-7%) | 2mo | $299,000 | $187 | 65 |
| 684 Kingsbury St E | 0.64mi | 4/3.0 (+1) | 1,719 (+0%) | 4mo | $380,000 | $221 | 61 |
| 841 Bently St E | 0.61mi | 3/3.0 | 1,735 (+1%) | 14mo | $395,000 | $228 | 58 |
| 849 Bently St E | 0.65mi | 3/2.0 | 1,670 (-3%) | 7mo | $300,000 | $180 | 55 |
| 823 Hoosier St E | 0.31mi | 3/2.0 | 1,478 (-14%) | 4mo | $325,000 | $220 | 55 |
| 853 Frederick Reid St E | 0.59mi | 3/2.0 | 1,630 (-5%) | 9mo | $339,900 | $209 | 53 |
| 712 Clemwood Ave S | 0.53mi | 3/3.0 | 1,500 (-13%) | 9mo | $318,000 | $212 | 47 |
| 789 Bell Blvd S | 0.69mi | 4/2.0 (+1) | 1,677 (-2%) | 10mo | $80,000 | $48 | 46 |
| 802 Kingsbury Ct | 0.39mi | 4/2.0 (+1) | 1,500 (-13%) | 7mo | $285,000 | $190 | 46 |
| 734 Fleming Ave S | 0.70mi | 3/2.0 | 1,477 (-14%) | 12mo | $289,990 | $196 | 30 |
Match score weights: distance 35% · size 25% · config 20% · recency 20%. Top-matched comps best support the ARV.
Projected returns pro-forma
10.0% appreciation · 0.0% rent growth · sell at horizon
- IRR
- 20.3%
- Equity multiple
- 2.64×
- Total profit
- $151,160
- Equity at exit
- $297,200
- IRR
- 18.0%
- Equity multiple
- 5.89×
- Total profit
- $451,323
- Equity at exit
- $640,923
Cash invested: $92,372 (down + closing). Projections, not guarantees.
Landlord ↔ Tenant lean methodology
- Overall (STATE)
- 87 Strongly Landlord-Friendly
- State Florida
- 87 Strongly Landlord-Friendly · R+3
- County
- — inherits STATE
- City
- — inherits STATE
ZIP-level market 33974
- Home prices YoY
- 5.8%
- Rents YoY
- -4.7%
- Active inventory
- 2460
- Price-to-rent
- 13.1×
Monthly cashflow live
- Estimated rent
- $2,101 high interval (Pro) →
- Mortgage (P&I)
- −$1,730
- Tax from tax record
- −$141 /mo · $1,693/yr
- Insurance
- −$137
- HOA
- −$0
- Vacancy / Maint / Mgmt
- −$441
- Net cashflow
- $-349
Break-even live
UW: 25.0% down · 7.5% · 30yr · 1.5% tax · 5.0% vac · 8.0% maint · 8.0% mgmt
Financing live
Cash to close
- Down payment
- $82,475
- Closing costs
- $9,897
- Reserves months
- —
- Total cash needed
- —
Loan-product check · same deal, 3 products live
Conventional
25% down · 7.5% · 30yr
- Down + closing
- —
- Monthly P&I
- —
- Monthly cashflow
- —
- DSCR
- —
- Eligible?
- —
Personal DTI + credit; lowest rate.
DSCR
20% down · 8.5% · 30yr
- Down + closing
- —
- Monthly P&I
- —
- Monthly cashflow
- —
- DSCR
- —
- Eligible?
- —
No personal income docs; deal must DSCR.
Hard money
10% down · 12.0% · 12mo
- Down + closing
- —
- Monthly P&I
- —
- Monthly cashflow
- —
- DSCR
- —
- Eligible?
- —
Short-term bridge; refi at stabilization.
Rent comps 40 comps
| Address | Beds | Baths | Sqft | Rent | $/sqft | DOM | Units | Dist |
|---|---|---|---|---|---|---|---|---|
| 684 Thomas Sherwin Ave S Lehigh Acres, FL | 3.0 | 2.0 | 1288 | $1,695 | $1.32 | 3d | 1 | 0.13mi |
| 604 Thomas Sherwin Ave S Lehigh Acres, FL | 4.0 | 2.0 | 1493 | $2,200 | $1.47 | 3d | 1 | 0.20mi |
| 530 Kilgour Ave Lehigh Acres, FL | 3.0 | 2.0 | 2214 | $1,795 | $0.81 | 3d | 1 | 0.42mi |
| 573 Bell Blvd S Lehigh Acres, FL | 3.0 | 2.0 | 1218 | $1,900 | $1.56 | 14d | 1 | 0.42mi |
| 874 Apartment St Lehigh Acres, FL | 3.0 | 2.0 | 1200 | $1,750 | $1.46 | 23d | 1 | 0.55mi |
| 886 Milwaukee Blvd Lehigh Acres, FL | 3.0 | 2.0 | 1205 | $1,900 | $1.58 | 23d | 1 | 0.58mi |
| 715 Bering Ave S Lehigh Acres, FL | 3.0 | 2.0 | 1835 | $1,895 | $1.03 | 21d | 1 | 0.59mi |
| 541 Chalet Ave S Lehigh Acres, FL | 4.0 | 3.0 | 1650 | $2,400 | $1.45 | 23d | 1 | 0.60mi |
| 546 Whispering Wind Bnd Lehigh Acres, FL | 3.0 | 2.0 | 1437 | $1,950 | $1.36 | 1d | 1 | 0.63mi |
| 728 Crestline Ave S Lehigh Acres, FL | 4.0 | 3.0 | 1904 | $2,000 | $1.05 | 21d | 1 | 0.64mi |
| 708 Godwid Ave S Lehigh Acres, FL | 3.0 | 2.0 | 1758 | $2,150 | $1.22 | 21d | 1 | 0.65mi |
| 541 Hawthorne Ave S Lehigh Acres, FL | 3.0 | 2.0 | 1634 | $1,921 | $1.18 | 3d | 1 | 0.66mi |
| 710 Godwid Ave S Lehigh Acres, FL | 3.0 | 2.0 | 1758 | $2,150 | $1.22 | 3d | 1 | 0.66mi |
| 710 Godwid Ave S Lehigh Acres, FL | 3.0 | 2.0 | 1758 | $2,150 | $1.22 | 2d | 1 | 0.66mi |
| 710 Godwid Ave S Lehigh Acres, FL | 3.0 | 2.0 | 1758 | $2,150 | $1.22 | 21d | 1 | 0.66mi |
| 567 Charwood Ave S Lehigh Acres, FL | 3.0 | 2.0 | 1564 | $1,900 | $1.21 | 14d | 1 | 0.68mi |
| 862 Charles Sise St E Lehigh Acres, FL | 3.0 | 2.0 | 1582 | $2,664 | $1.68 | 23d | 1 | 0.72mi |
| 508 Bell Blvd S Lehigh Acres, FL | 3.0 | 2.0 | 1200 | $1,800 | $1.50 | 23d | 1 | 0.73mi |
| 908 Winters St E Lehigh Acres, FL | 3.0 | 2.0 | 1639 | $2,200 | $1.34 | 10d | 1 | 0.76mi |
| 606 Morningmist Ln Lehigh Acres, FL | 4.0 | 2.5 | 1817 | $2,295 | $1.26 | 3d | 1 | 0.83mi |
| 598 Aston Lake Ct Lehigh Acres, FL | 3.0 | 2.0 | 1703 | $2,395 | $1.41 | 21d | 1 | 0.83mi |
| 719 Fullerton Ave S Lehigh Acres, FL | 3.0 | 2.0 | 1650 | $2,000 | $1.21 | 19d | 1 | 0.83mi |
| 720 Chavers St Lehigh Acres, FL | 3.0 | 2.0 | 1547 | $2,200 | $1.42 | 23d | 1 | 0.84mi |
| 928 Milwaukee Blvd Lehigh Acres, FL | 4.0 | 2.0 | 1719 | $1,990 | $1.16 | 23d | 1 | 0.86mi |
| 459 Lockport Ave S Lehigh Acres, FL | 3.0 | 2.0 | 1650 | $2,000 | $1.21 | 23d | 1 | 0.92mi |
| 762 Gallo Ave S #764 Lehigh Acres, FL | 3.0 | 2.0 | 1127 | $1,195 | $1.06 | 21d | 1 | 0.93mi |
| 515 Croydon Ave S Lehigh Acres, FL | 3.0 | 3.0 | 1253 | $2,200 | $1.76 | 3d | 1 | 0.93mi |
| 760 Festival Ave S Lehigh Acres, FL | 3.0 | 2.0 | 1650 | $2,000 | $1.21 | 23d | 1 | 0.94mi |
| 455 Bell Blvd Unit 1 Lehigh Acres, FL | 3.0 | 2.0 | 1142 | $1,600 | $1.40 | 23d | 1 | 0.95mi |
| 406 Chalet Ave S Lehigh Acres, FL | 3.0 | 2.0 | 1200 | $1,850 | $1.54 | 23d | 1 | 0.99mi |
| 404 Chalet Ave S Lehigh Acres, FL | 3.0 | 2.0 | 1200 | $1,850 | $1.54 | 23d | 1 | 0.99mi |
| 696 Homestead Rd S Lehigh Acres, FL | 4.0 | 2.0 | 1777 | $2,200 | $1.24 | 23d | 1 | 1.02mi |
| 510 Caywood Ave S Lehigh Acres, FL | 3.0 | 2.0 | 1582 | $2,664 | $1.68 | 23d | 1 | 1.04mi |
| 954 Pilgrim St E Lehigh Acres, FL | 3.0 | 2.0 | 1246 | $1,625 | $1.30 | 1d | 1 | 1.04mi |
| 814 Crystal Ave S Lehigh Acres, FL | 3.0 | 2.0 | 1865 | $1,815 | $0.97 | 23d | 1 | 1.07mi |
| 645 Homestead Rd S Lehigh Acres, FL | 3.0 | 2.0 | 1165 | $1,700 | $1.46 | 23d | 1 | 1.10mi |
| 940 Sterling St E Lehigh Acres, FL | 4.0 | 2.0 | 1389 | $1,750 | $1.26 | 3d | 1 | 1.11mi |
| 825 Carbon St E Lehigh Acres, FL | 3.0 | 2.0 | 1582 | $2,300 | $1.45 | 23d | 1 | 1.18mi |
| 397 Carrillon Ave S Lehigh Acres, FL | 3.0 | 2.0 | 1200 | $1,550 | $1.29 | 3d | 1 | 1.19mi |
| 758 Worth Ave Lehigh Acres, FL | 3.0 | 2.0 | 1360 | $2,000 | $1.47 | 15d | 1 | 1.20mi |
Listing history 15 events
-
2026-06-17days on market $329,900 Active 77 DOM
-
2026-06-16days on market $329,900 Active 76 DOM
-
2026-06-15days on market $329,900 Active 75 DOM
-
2026-06-13days on market $329,900 Active 73 DOM
-
2026-06-10days on market $329,900 Active 70 DOM
-
2026-06-09days on market $329,900 Active 69 DOM
-
2026-06-07days on market $329,900 Active 67 DOM
-
2026-06-03days on market $329,900 Active 63 DOM
-
2026-06-02days on market $329,900 Active 62 DOM
-
2026-06-01days on market $329,900 Active 61 DOM
-
2026-06-01days on market $329,900 Active 60 DOM
-
2026-03-15$329,900 Active
-
2010-05-07soldstatus $145,000 929-char remark
Show marketing remark (929 chars)
Golf course and lake views . compare with other homes in area, this home is on city water and sewer with all assessments paid. Nicely manicured landscaping on 3/4 acre lot! This well maintained pool home is move in ready. Enjoy the expansive views as you enter the home or view from your family room. The large kitchen features an island and plenty of storage space. All bedrooms are spacious, master bedroom has asliding glass door to lanai. Master bath features his & her sinks. Oversized garage has space for your golfcart. The pool is heated and features a spill over waterfall. Outdoor shower has hot and cold water and there is an outside pool bath as well as pool storage. There is a screened front entry, new microwave, refrigerator & water heater. Compare this home with others in the area- Located in a nice community of homes, definitely worth seeing and best of all no maintenance fees to enjoy the views!
-
2010-04-19price $155,000 929-char remark
Show marketing remark (929 chars)
Golf course and lake views . compare with other homes in area, this home is on city water and sewer with all assessments paid. Nicely manicured landscaping on 3/4 acre lot! This well maintained pool home is move in ready. Enjoy the expansive views as you enter the home or view from your family room. The large kitchen features an island and plenty of storage space. All bedrooms are spacious, master bedroom has asliding glass door to lanai. Master bath features his & her sinks. Oversized garage has space for your golfcart. The pool is heated and features a spill over waterfall. Outdoor shower has hot and cold water and there is an outside pool bath as well as pool storage. There is a screened front entry, new microwave, refrigerator & water heater. Compare this home with others in the area- Located in a nice community of homes, definitely worth seeing and best of all no maintenance fees to enjoy the views!
-
1998-12-30$126,245
ⓘ Source: listings_history table (triggers on properties + properties_extension) + one-shot
backfill from property_details.listing_events for pre-trigger history.
Tax reassessment forecast FL · Resets to sale price
- Current annual tax
- $1,693 · $141/mo
- Projected year-2 tax
- $2,738 · $228/mo
- Expected delta
- +$1,045/yr (+$87/mo · 61.8%)
ⓘ Screening estimate from a state-policy table — verify with the county assessor before closing.
Climate risk First Street
- Flood 1/10 Low FEMA zone X (unshaded) · 0% chance over 30 yrs
- Wildfire 2/10 Low
- Heat 9/10 Extreme 7 d/yr ≥108°F today · 27 d/yr by 30 yrs out
- Wind 10/10 Extreme 99% chance of damaging wind over 30 yrs
- Air quality 2/10 Low 1 unhealthy d/yr today · 2 by 30 yrs out
Nearby sold comps map
Loading sold comps map…
Walkable amenities ~0.75 mi
Loading nearby amenities…
Taxation est. · year 1
- Rental income
- $25,210
- − Mortgage interest
- −$18,480
- − Property taxes
- −$1,693
- − Insurance
- −$1,650
- − Repairs & maintenance
- −$2,017
- − Management
- −$2,017
- − Depreciation
- −$9,597
- Taxable loss
- −$10,242
- Est. tax savings @ 24.0%
- +$2,458
- After-tax cash flow
- $-1,728/yr
For passive investors: Depreciation is non-cash, so a rental often shows a tax loss while cash-flowing — sheltering income. Rental losses are passive: they offset passive income freely, and up to $25,000/yr can offset ordinary (W-2) income if you actively participate and your MAGI is under $100k (phasing out to $0 by $150k); unused losses carry forward. On sale, claimed depreciation is recaptured at up to 25%, and gains may owe capital-gains tax (a 1031 exchange can defer both). Figures are a year-1 estimate at your 24.0% rate — not tax advice; consult a CPA.
Schools (NCES district)
- District
- Lee
- NCES district ID
- 1201080
- Math proficiency
- 47% ▼ -11.00%
- Reading proficiency
- 50% ▼ -4.00%
- Median HH income
- $49,518
- Composite
- 41.49/100
- National rank
- #3458
- State rank
- #42 of 73 in FL
Livability — Lehigh Acres
- Score
- 59/100
- State rank
- #826
- US rank
- #20055
Category grades
Schools grade is shown separately in the Schools card above.
Census & demographics
- Census place
- Lehigh Acres, FL
- County
- Lee County · 788,662 people
- City population
- 130,638
- Metro
- Cape Coral-Fort Myers, FL
- Population (ZIP)
- 19,927
- Household income
- $72,192
- Rent vs Own
- Severe rent burden
- 434.0
Population outlook (Lee County) Hauer SSP2
- Today (2025)
- 871,946 people
- By 2030
- 955,468 · +9.6%
- By 2040
- 1,113,587 · +27.7%
- By 2050
- 1,256,891 · +44.1%
- By 2075
- 1,560,270 · +78.9%
- By 2100
- 1,726,848 · +98.0%
Race, ethnicity, and origin ACS 2023
- Neighborhood character
- Diverse neighborhood (Simpson 0.64)
- Race & ethnicity
- Hispanic / Latino 52% Two or more races 31% White 26% Black 18%
- Hispanic origin (detail)
- Mexican 12% Puerto Rican 7% Cuban 20% Dominican 4%
- Common ancestry
- Hispanic 7% Italian 1% Portuguese 1%
- Foreign-born
- 32% · Canada, Jamaica
- Languages at home
- 48% English-only · Spanish 43% French/Haitian/Cajun 7% Other Indo-European 1%
Political lean MEDSL · Lee
- 2024 margin
- Strong R (+28.4) · D 35.5% · R 63.9%
- 2008→2024 swing
- -18.0pp toward R · 2008: -10.4pp · 2024: -28.4pp
- All cycles
- 2024: R+28.4 2020: R+19.2 2016: R+20.4 2012: R+16.6 2008: R+10.4
Not yet ingested
- Civics
- —
Market trends
- HPI YoY
- ▲ 16.53%
- Current HPI
- 303.3399
- Rent YoY
- ▼ -4.68%
- Metro
- Cape Coral-Fort Myers, FL
- State GDP YoY
- ▲ 3.28%
- F500 in state
- 36
Industry mix (Fortune 500 HQ in FL)
| Industry | F500 HQs | Revenue |
|---|---|---|
| Industrial Technology | 2 | $29B |
|
||
| Insurance | 2 | $17B |
|
||
| Retail | 1 | $60B |
|
||
| Technology Distribution | 1 | $58B |
|
||
| Homebuilding | 1 | $35B |
|
||
| Technology Manufacturing | 1 | $35B |
|
||
Price history
+161.3% since first listed4 events — show timeline
- 2026-03-15 Listed $329,900 FORTMLS
- 2010-05-07 Sold (MLS) $145,000 FORTMLS
- 2010-04-19 Price Changed $155,000 FORTMLS
- 1998-12-30 Listed $126,245 FORTMLS
Property tax history
+1.8%/yrLatest (2022): $1,693 · +5.5% YoY. Source: county tax records.
Cash-flow waterfall
monthlySold comps — $/sqft
last 12 mo · ≤1 miLoading sold comps…