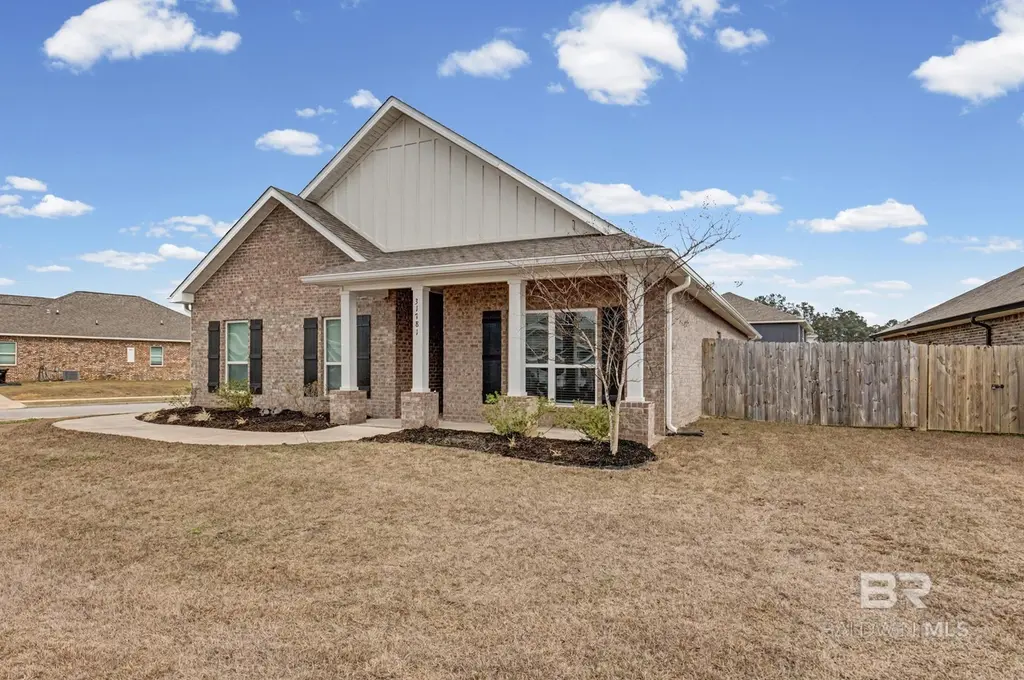
31781 Memphis Loop · Loxley, AL
Flood risk No data
- FEMA flood zone
- —
- Chance of flooding over 30 yrs
- —
- Est. flood insurance / yr
- —
Fire risk No data
- Est. fire insurance / yr
- —
Heat risk No data
- Hot days now (above threshold)
- —
- Hot days in 30 yrs
- —
Wind risk No data
- Chance of severe wind over 30 yrs
- —
Air-quality risk No data
- Unhealthy air days now
- —
- Unhealthy air days in 30 yrs
- —
Risk factors via First Street. Map © Google.
Why this score? — see what drove the D grade
The composite is a weighted blend of 9 inputs, each scored 0–100. Each bar is that input's sub-score; the figure is the points it added to the 100-point composite (weight × sub-score).
- Cash flow +11.2/30.0
- ARV discount +9.5/15.0
- Rent growth +4.1/5.0
- Schools +3.9/10.0
- DSCR +3.3/10.0
- Livability +3.3/5.0
- Condition / age +2.5/5.0
- 1% rule +2.3/10.0
- Appreciation +0.0/10.0
$339,999
🖨 Deal sheet 📄 Offer letter ✓ Due diligence
Listing remarks MLS
Beautiful Gold Fortified Ryder floor plan on a corner lot in Stonebridge, offering 4 bedrooms, 2 baths, and a bright, open layout designed for easy living. The fenced backyard and covered patio create a perfect space for relaxing or entertaining. Residents enjoy exceptional neighborhood amenities—multiple pools, playgrounds, sports courts, sidewalks, and scenic walking trails. Convenient Spanish Fort location with quick access to Hwy 31 and I-10, plus close proximity to schools, shopping, and dining. Buyer to verify all information during due diligence.
Key facts
- Clubhouse
- Playgrounds
- Sports courts
Tags
Neighborhood map
What this means for you Summary
Snapshot
- This is a 4-bed/2.0-bath single-family listed at $340k.
Deal economics
- At list price, monthly cash flow is $-131 ($-2k/yr) — negative.
- To cash-flow at today's rent, offer at most $317k (6.8% below list).
- To meet the 1% rule (rent ≥ 1% of price), the offer needs to be $247k (27.4% below list).
- Recommended offer: $247k (27.4% below list) — sets the bar for 1% rule.
- Cap rate 5.8% vs local median 4.1% in Loxley — top-decile yield for the area; either an underpriced asset or a hidden risk that comps aren't pricing in. Stress-test before assuming the spread holds.
Location & tenants
- Location reads 66/100 on livability (#95 in AL) — a middle-class / working-renter tenant base. Strengths: housing A+, cost of living A, employment B; Watch: schools D, crime D, amenities F.
- Baldwin County (rural): math 33% / reading 57% proficiency, ranked #18 of 129 in AL (top 14%) — families likely to look elsewhere, expect single-tenant / working-renter base with shorter leases.
- Market conditions: Rents rising fast (+6.5%/yr); 331 active listings in the ZIP; 13 comparable units currently listed for rent nearby; rentals at typical pace (median 21d on market — plan ~3-4 weeks tenant-placement turnaround); high-income renter base; 3,883 units permitted in Baldwin County in 2024 (481 in 5+ unit buildings).
Forward outlook
- Local home prices are declining (-3.0%/yr); year-one equity from $2k of loan paydown is wiped out by about $10k of value loss. Plan a longer hold.
- Baldwin County population projected at +42% by 2050 — long-run rental-demand tailwind backs the buy-and-hold thesis.
Negotiation context
- It's been on market 118 days — a 9% lower offer ($309k) is reasonable based on typical stale-listing flexibility.
- 5 sale attempts since 5y ago with the ask held roughly flat each time — persistent listings suggest the price (not the market) is what's stuck; bring a comps-based counter.
Questions for the listing agent
- What do current leases actually rent for vs. the listed asking? Can we see a recent rent roll and the last 12 months of T-12 income?
- It's been on market 118 days. Have you received any prior offers? Is the seller open to a 27% concession, seller financing, or rate buy-down credit?
- What does the HOA fee cover, when was the last increase, and are there any pending special assessments or reserve-fund shortfalls?
- Why hasn't it sold? Are there any deal-killer items the seller is aware of (foundation, flood, title, zoning, code violations)?
- Is there a deadline driving the sale (1031 exchange, divorce, estate, relocation)? That informs how much negotiation room exists.
- Schools are D-rated, which usually means shorter tenancies and higher turnover. Who's the typical renter profile here, and what's been the actual vacancy rate?
- Crime grade is D in this area — have there been break-ins, vandalism, or insurance claims at this property in the last 3 years? What carrier currently insures it and at what premium?
- The area grade is low — what's the realistic commute time and amenity access for the typical tenant pool here? Any planned neighborhood developments (good or bad) we should know about?
- What's the average days-on-market for RENTAL listings here right now (not sales)? A rising rental-DOM trend means longer vacancies and softer asking-rent achievability than the comps imply.
- What's the recent tenant-quality profile in this submarket — average credit score on applications, eviction rate, late-payment / NSF rate, and stable-employment percentage? A property-management company in the area should have these aggregated.
- How much new for-sale + rental construction is in the pipeline within 1–3 miles? Heavy new supply typically softens prices + rents 12–24 months out; constrained supply supports both.
Investment metrics
- 1% rule
- 0.73% ✗
- Cap rate
- 5.83%
- Cash-on-cash
- -1.66%
- DSCR
- 0.93
- GRM
- 11.5
CMA / ARV
- ARV (median comp)
- $356,008
- List price
- $339,999
- Delta
- -4.50%
- Verdict
- FAIR
- Comps
- 20 within 1.0 mi
Show comp detail 12 sales within ~0.75 mi
| Address | Dist | Beds/Ba | Sqft | Sold | Price | $/sf | Match |
|---|---|---|---|---|---|---|---|
| 31579 Lyon Rd | 0.36mi | 4/2.0 | 2,031 (-0%) | 1mo | $360,558 | $178 | 82 |
| 31847 Lyon Rd | 0.49mi | 4/2.0 | 2,031 (-0%) | 2mo | $356,650 | $176 | 75 |
| 12738 Chickadee Ln | 0.50mi | 4/2.0 | 1,960 (-4%) | 2mo | $344,900 | $176 | 68 |
| 12693 Waxwing Ave | 0.52mi | 4/2.0 | 1,940 (-5%) | 1mo | $339,500 | $175 | 67 |
| 31147 Semper Dr | 0.35mi | 4/2.0 | 1,835 (-10%) | 1mo | $345,000 | $188 | 66 |
| 31578 Lyon Rd | 0.30mi | 4/2.0 | 1,791 (-12%) | 1mo | $349,558 | $195 | 65 |
| 31662 Lyon Rd | 0.35mi | 4/2.0 | 1,791 (-12%) | 1mo | $351,058 | $196 | 63 |
| 31625 Lyon Rd | 0.37mi | 4/2.0 | 1,791 (-12%) | 1mo | $349,558 | $195 | 62 |
| 31697 Lyon Rd | 0.39mi | 4/2.0 | 1,791 (-12%) | 2mo | $342,308 | $191 | 60 |
| 30954 Semper Dr | 0.39mi | 4/2.5 | 2,306 (+13%) | 1mo | $430,000 | $186 | 57 |
| 30629 Ashville Rd | 0.65mi | 4/3.0 | 2,231 (+10%) | 1mo | $397,280 | $178 | 49 |
| 30560 Ashville Rd | 0.71mi | 4/2.5 | 2,256 (+11%) | 1mo | $403,248 | $179 | 46 |
Match score weights: distance 35% · size 25% · config 20% · recency 20%. Top-matched comps best support the ARV.
Projected returns pro-forma
-3.0% appreciation · 6.52% rent growth · sell at horizon
- IRR
- -15.7%
- Equity multiple
- 0.43×
- Total profit
- $-54,532
- Equity at exit
- $50,695
- IRR
- -2.6%
- Equity multiple
- 0.80×
- Total profit
- $-18,817
- Equity at exit
- $29,397
Cash invested: $95,200 (down + closing). Projections, not guarantees.
Landlord ↔ Tenant lean methodology
- Overall (STATE)
- 90 Strongly Landlord-Friendly
- State Alabama
- 90 Strongly Landlord-Friendly · R+15
- County
- — inherits STATE
- City
- — inherits STATE
ZIP-level market 36527
- Home prices YoY
- -14.4%
- Rents YoY
- 6.5%
- Active inventory
- 331
- Price-to-rent
- 11.5×
Monthly cashflow live
- Estimated rent
- $2,470 high interval (Pro) →
- Mortgage (P&I)
- −$1,783
- Tax from tax record
- −$100 /mo · $1,200/yr
- Insurance
- −$142
- HOA
- −$58
- Vacancy / Maint / Mgmt
- −$519
- Net cashflow
- $-131
Break-even live
UW: 25.0% down · 7.5% · 30yr · 1.5% tax · 5.0% vac · 8.0% maint · 8.0% mgmt
Financing live
Cash to close
- Down payment
- $85,000
- Closing costs
- $10,200
- Reserves months
- —
- Total cash needed
- —
Loan-product check · same deal, 3 products live
Conventional
25% down · 7.5% · 30yr
- Down + closing
- —
- Monthly P&I
- —
- Monthly cashflow
- —
- DSCR
- —
- Eligible?
- —
Personal DTI + credit; lowest rate.
DSCR
20% down · 8.5% · 30yr
- Down + closing
- —
- Monthly P&I
- —
- Monthly cashflow
- —
- DSCR
- —
- Eligible?
- —
No personal income docs; deal must DSCR.
Hard money
10% down · 12.0% · 12mo
- Down + closing
- —
- Monthly P&I
- —
- Monthly cashflow
- —
- DSCR
- —
- Eligible?
- —
Short-term bridge; refi at stabilization.
Rent comps 13 comps
| Address | Beds | Baths | Sqft | Rent | $/sqft | DOM | Units | Dist |
|---|---|---|---|---|---|---|---|---|
| 31448 Memphis Loop Daphne, AL | 4.0 | 2.0 | 2033 | $2,400 | $1.18 | 13d | 1 | 0.01mi |
| 31407 Montalto Ct Daphne, AL | 4.0 | 3.0 | 2796 | $2,700 | $0.97 | 13d | 1 | 0.06mi |
| 12941 Sanderling Loop Daphne, AL | 4.0 | 3.0 | 2536 | $2,695 | $1.06 | 21d | 1 | 0.31mi |
| 13522 Monticello Blvd Daphne, AL | 4.0 | 2.0 | 2318 | $2,700 | $1.16 | 21d | 1 | 0.34mi |
| 31697 Lyon Rd Spanish Fort, AL | 4.0 | 2.0 | 1787 | $2,500 | $1.40 | 21d | 1 | 0.41mi |
| 31100 Falling Waters Loop Daphne, AL | 2.0–4.0 | 1.0–2.0 | 1158 | $2,299 | $1.99 | 43d | 1 | 0.58mi |
| 31573 Shearwater Dr Daphne, AL | 4.0 | 2.0 | 1830 | $1,995 | $1.09 | 21d | 1 | 0.62mi |
| 13445 Antler Hill Rd Spanish Fort, AL | 4.0 | 2.0 | 1921 | $2,100 | $1.09 | 43d | 1 | 0.67mi |
| 32231 Emancipation Cir Spanish Fort, AL | 3.0 | 2.5 | 1492 | $1,850 | $1.24 | 43d | 1 | 0.70mi |
| 31566 Spoonbill Rd Daphne, AL | 4.0 | 3.0 | 2970 | $2,800 | $0.94 | 13d | 1 | 0.76mi |
| 31399 Spoonbill Rd Daphne, AL | 4.0 | 3.5 | 2567 | $2,995 | $1.17 | 21d | 1 | 0.79mi |
| 13708 Antler Hill Rd Daphne, AL | 4.0 | 2.0 | 1948 | $2,300 | $1.18 | 43d | 1 | 0.86mi |
| 11801 Balsam Ct Daphne, AL | 4.0 | 2.0 | 1783 | $2,195 | $1.23 | 21d | 1 | 1.48mi |
HOA detail
- Monthly dues
- $58 · $696/yr
- Likely covers
- landscapingpool
Listing history 37 events
-
2026-06-19days on market $339,999 Active 118 DOM
-
2026-06-18days on market $339,999 Active 117 DOM
-
2026-06-17days on market $339,999 Active 116 DOM
-
2026-06-16days on market $339,999 Active 115 DOM
-
2026-06-15days on market $339,999 Active 114 DOM
-
2026-06-14days on market $339,999 Active 112 DOM
-
2026-06-13days on market $339,999 Active 111 DOM
-
2026-06-10days on market $339,999 Active 109 DOM
-
2026-06-09days on market $339,999 Active 108 DOM
-
2026-06-08days on market $339,999 Active 107 DOM
-
2026-06-07days on market $339,999 Active 106 DOM
-
2026-06-05days on market $339,999 Active 103 DOM
-
2026-06-03days on market $339,999 Active 102 DOM
-
2026-06-02days on market $339,999 Active 101 DOM
-
2026-06-01days on market $339,999 Active 100 DOM
-
2026-05-31days on market $339,999 Active 99 DOM
-
2026-05-30days on market $339,999 Active 98 DOM
-
2026-04-12price $345,000 565-char remark
Show marketing remark (565 chars)
Beautiful Gold Fortified Ryder floor plan on a corner lot in Stonebridge, offering 4 bedrooms, 2 baths, and a bright, open layout designed for easy living. The fenced backyard and covered patio create a perfect space for relaxing or entertaining. Residents enjoy exceptional neighborhood amenities—multiple pools, playgrounds, sports courts, sidewalks, and scenic walking trails. Convenient Spanish Fort location with quick access to Hwy 31 and I-10, plus close proximity to schools, shopping, and dining. Buyer to verify all information during due diligence.
-
2026-03-15price $346,999 565-char remark
Show marketing remark (565 chars)
Beautiful Gold Fortified Ryder floor plan on a corner lot in Stonebridge, offering 4 bedrooms, 2 baths, and a bright, open layout designed for easy living. The fenced backyard and covered patio create a perfect space for relaxing or entertaining. Residents enjoy exceptional neighborhood amenities—multiple pools, playgrounds, sports courts, sidewalks, and scenic walking trails. Convenient Spanish Fort location with quick access to Hwy 31 and I-10, plus close proximity to schools, shopping, and dining. Buyer to verify all information during due diligence.
-
2026-02-21$349,999 Active 565-char remark
Show marketing remark (565 chars)
Beautiful Gold Fortified Ryder floor plan on a corner lot in Stonebridge, offering 4 bedrooms, 2 baths, and a bright, open layout designed for easy living. The fenced backyard and covered patio create a perfect space for relaxing or entertaining. Residents enjoy exceptional neighborhood amenities—multiple pools, playgrounds, sports courts, sidewalks, and scenic walking trails. Convenient Spanish Fort location with quick access to Hwy 31 and I-10, plus close proximity to schools, shopping, and dining. Buyer to verify all information during due diligence.
-
2023-06-26soldstatus $320,000
-
2023-06-23soldstatus $320,000 Closed
-
2023-06-23soldstatus $320,000 Closed
-
2023-06-07historical Active Under Contract
-
2023-05-30historical
-
2023-05-30historical Active Under Contract
-
2023-05-11price $329,999
-
2023-05-11price $329,999
-
2023-05-01price $339,900
-
2023-05-01price $339,900
-
2023-03-16$354,900 Active
-
2023-03-16$354,900 Active
-
2022-03-30historical
-
2022-03-16$364,900 Active
-
2022-01-18soldstatus $319,578 Closed
-
2021-11-14$319,578
-
2021-11-11historical
ⓘ Source: listings_history table (triggers on properties + properties_extension) + one-shot
backfill from property_details.listing_events for pre-trigger history.
Tax reassessment forecast AL · Resets to sale price
- Current annual tax
- $1,200 · $100/mo
- Projected year-2 tax
- $1,394 · $116/mo
- Expected delta
- +$194/yr (+$16/mo · 16.1%)
ⓘ Screening estimate from a state-policy table — verify with the county assessor before closing.
Nearby sold comps map
Loading sold comps map…
Walkable amenities ~0.75 mi
Loading nearby amenities…
Taxation est. · year 1
- Rental income
- $29,640
- − Mortgage interest
- −$19,045
- − Property taxes
- −$1,200
- − Insurance
- −$1,700
- − Repairs & maintenance
- −$2,371
- − Management
- −$2,371
- − HOA
- −$696
- − Depreciation
- −$9,891
- Taxable loss
- −$7,635
- Est. tax savings @ 24.0%
- +$1,832
- After-tax cash flow
- $256/yr
For passive investors: Depreciation is non-cash, so a rental often shows a tax loss while cash-flowing — sheltering income. Rental losses are passive: they offset passive income freely, and up to $25,000/yr can offset ordinary (W-2) income if you actively participate and your MAGI is under $100k (phasing out to $0 by $150k); unused losses carry forward. On sale, claimed depreciation is recaptured at up to 25%, and gains may owe capital-gains tax (a 1031 exchange can defer both). Figures are a year-1 estimate at your 24.0% rate — not tax advice; consult a CPA.
Schools (NCES district)
- District
- Baldwin County
- NCES district ID
- 0100270
- Math proficiency
- 33% ▼ -26.00%
- Reading proficiency
- 57% ▲ 1.00%
- Median HH income
- $50,677
- Composite
- 38.61/100
- National rank
- #4157
- State rank
- #18 of 129 in AL
Livability — Loxley
- Score
- 66/100
- State rank
- #95
- US rank
- #11346
Category grades
Schools grade is shown separately in the Schools card above.
Census & demographics
- Census place
- Loxley, AL
- County
- Baldwin County · 181,514 people
- Metro
- Daphne-Fairhope-Foley, AL
- Population (ZIP)
- 21,765
- Household income
- $120,189
- Rent vs Own
- Severe rent burden
- 378.0
Population outlook (Baldwin County) Hauer SSP2
- Today (2025)
- 248,264 people
- By 2030
- 270,315 · +8.9%
- By 2040
- 312,967 · +26.1%
- By 2050
- 352,262 · +41.9%
- By 2075
- 438,841 · +76.8%
- By 2100
- 487,736 · +96.5%
Race, ethnicity, and origin ACS 2023
- Neighborhood character
- Predominantly White (80%)
- Race & ethnicity
- White 80% Two or more races 8% Black 6% Hispanic / Latino 5% Asian 2%
- Hispanic origin (detail)
- Mexican 2%
- Common ancestry
- Lithuanian 4% Slovak 2% Serbian 2%
- Foreign-born
- 6% · Canada, Jamaica, South Korea
- Languages at home
- 95% English-only · Spanish 3%
Political lean MEDSL · Baldwin
- 2024 margin
- Solid R (+58.2) · D 20.5% · R 78.7%
- 2008→2024 swing
- -6.7pp toward R · 2008: -51.5pp · 2024: -58.2pp
- All cycles
- 2024: R+58.2 2020: R+53.8 2016: R+57.8 2012: R+55.8 2008: R+51.5
Not yet ingested
- Civics
- —
Market trends
- HPI YoY
- ▼ -39.56%
- Current HPI
- 234.5113
- Rent YoY
- ▲ 6.52%
- Metro
- Daphne-Fairhope-Foley, AL
- State GDP YoY
- ▲ 2.94%
- F500 in state
- 4
Industry mix (Fortune 500 HQ in AL)
| Industry | F500 HQs | Revenue |
|---|---|---|
| Financial Services | 1 | $8B |
|
||
| Healthcare | 1 | $5B |
|
||
Price history
+8.0% since first listed20 events — show timeline
- 2026-04-12 Price Changed $345,000 BCAR
- 2026-03-15 Price Changed $346,999 BCAR
- 2026-02-21 Listed $349,999 BCAR
- 2023-06-26 Sold (Public Records) $320,000 Public Records
- 2023-06-23 Sold (MLS) $320,000 BCAR
- 2023-06-23 Sold (MLS) $320,000 GCMLS AL
- 2023-06-07 Contingent — BCAR
- 2023-05-30 Delisted — BCAR
- 2023-05-30 Contingent — GCMLS AL
- 2023-05-11 Price Changed $329,999 GCMLS AL
- 2023-05-11 Price Changed $329,999 BCAR
- 2023-05-01 Price Changed $339,900 GCMLS AL
- 2023-05-01 Price Changed $339,900 BCAR
- 2023-03-16 Listed $354,900 GCMLS AL
- 2023-03-16 Listed $354,900 BCAR
- 2022-03-30 Delisted — BCAR
- 2022-03-16 Listed $364,900 BCAR
- 2022-01-18 Sold (MLS) $319,578 BCAR
- 2021-11-14 Listed $319,578 BCAR
- 2021-11-11 Delisted — BCAR
Property tax history
+51.0%/yrLatest (2025): $1,200 · -49.8% YoY. Source: county tax records.
Cash-flow waterfall
monthlySold comps — $/sqft
last 12 mo · ≤1 miLoading sold comps…