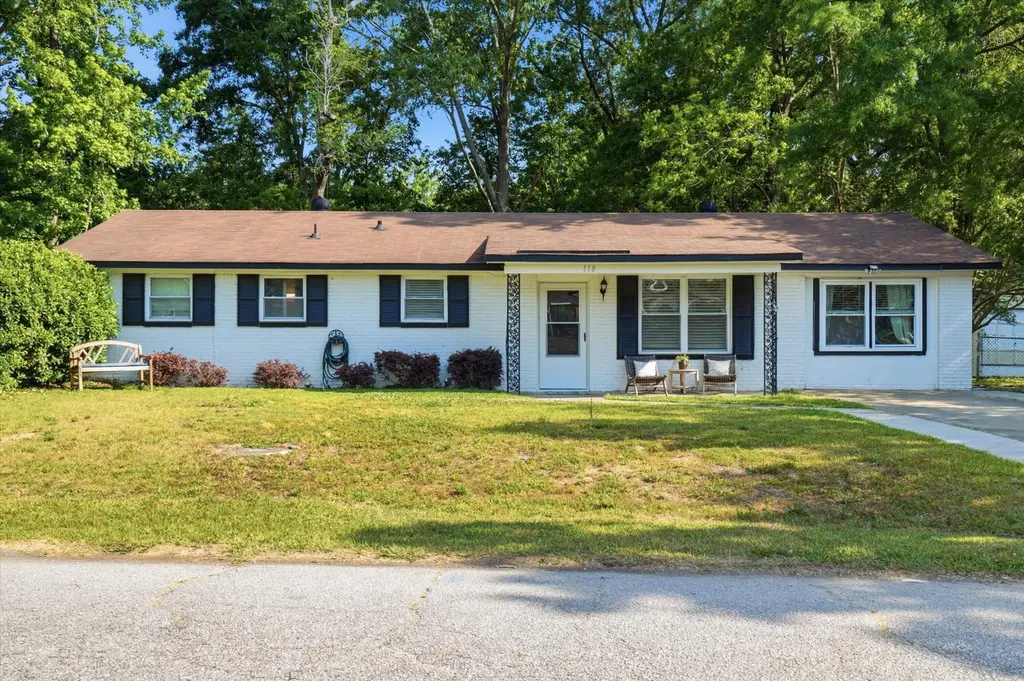
118 Froman Dr · Summerville, SC
Flood risk 1/10 · Minimal
- FEMA flood zone
- X (unshaded)
- Chance of flooding over 30 yrs
- 0.0%
- Est. flood insurance / yr
- $507 – $1,088
Fire risk 3/10 · Minor
- Est. fire insurance / yr
- $783 – $1,453
Heat risk 9/10 · Severe
- Hot days now (above 108°F)
- 7 days/yr
- Hot days in 30 yrs
- 17 days/yr
Wind risk 8/10 · Major
- Chance of severe wind over 30 yrs
- 98.0%
Air-quality risk 3/10 · Minor
- Unhealthy air days now
- 3 days/yr
- Unhealthy air days in 30 yrs
- 3 days/yr
Risk factors via First Street. Map © Google.
Why this score? — see what drove the D+ grade
The composite is a weighted blend of 9 inputs, each scored 0–100. Each bar is that input's sub-score; the figure is the points it added to the 100-point composite (weight × sub-score).
- Cash flow +14.0/30.0
- ARV discount +13.1/15.0
- DSCR +4.2/10.0
- Schools +4.1/10.0
- Livability +3.2/5.0
- 1% rule +3.0/10.0
- Rent growth +2.9/5.0
- Condition / age +2.5/5.0
- Appreciation +0.0/10.0
$293,000
🖨 Deal sheet (PDF) 📄 Offer letter ✓ Due diligence
Listing remarks
This one checks all the boxes! A 4-bedroom, 1.5-bath ranch in a sought-after, no HOA neighborhood in the Dorchester District 2 school zone -- and it's truly move-in ready. The big stuff is already taken care of: HVAC, windows, bathrooms and LVP flooring all updated in 2021, a brand new water heater in 2026, and a roof replaced in 2015. The kitchen has been remodeled, the garage was converted into a versatile flex space perfect for a home office, playroom, or guest suite, and the fully fenced lot gives you room to breathe. To top it off, a 4.375% FHA assumable loan is available (subject to lender approval). Storage shed conveys, so don't miss this incredible opportunity in a prime Summervill
Key facts
- Recent updates
- Remodeled kitchen
- Converted garage
Tags
Property features AI
Exterior
- Parking: Off-street parking; Converted garage
- Utilities: Public sewer; Dominion Energy service; Summerville CPW service
- Home design: Single-family detached home; One story; Ground-level entry
- Construction: Asphalt roof; Fee simple ownership
- Exterior features: Chain link fence; Shed(s); Lot size between 0 and 0.5 acre
Interior
- Kitchen: Electric range; Refrigerator
- Bedrooms: 4 bedrooms; Primary bedroom on lower level
- Flooring: Carpet; Luxury vinyl
- Bathrooms: 1.5 bathrooms
- Heating & cooling: Electric heating; Central air conditioning
- Interior features: Blown ceiling insulation; Eat-in kitchen; Family room; Pantry; Utility room
- Laundry & utility: Washer hookup; Electric dryer hookup
Neighborhood map
What this means for you Summary
Snapshot
- This is a 4-bed/1.0-bath single-family listed at $293k.
Deal economics
- At list price, monthly cash flow is $35 ($419/yr) — positive.
- The deal already cash-flows at list — no discount required.
- To meet the 1% rule (rent ≥ 1% of price), the offer needs to be $233k (20.4% below list).
- Recommended offer: $233k (20.4% below list) — sets the bar for 1% rule.
- Cap rate 6.4% vs local median 3.9% in Summerville — top-decile yield for the area; either an underpriced asset or a hidden risk that comps aren't pricing in. Stress-test before assuming the spread holds.
Location & tenants
- Location reads 63/100 on livability (#167 in SC) — a middle-class / working-renter tenant base. Strengths: housing A+, cost of living B+; Watch: amenities F, commute F, health & safety F.
- Dorchester 02 (suburban): math 40% / reading 55% proficiency, ranked #12 of 80 in SC (top 15%) — families likely to look elsewhere, expect single-tenant / working-renter base with shorter leases.
- Zoned schools: Newington Elementary (math 42% / reading 48%, grade D-, #224 of 597 statewide, top 38%, 758 students, 81% FRL); Gregg Middle (math 28% / reading 45%, grade F, #98 of 229 statewide, top 43%, 850 students, 76% FRL); Summerville High (math 60% / reading 92%, grade A-, #34 of 196 statewide, top 17%, 3,308 students, 59% FRL) — zoned schools average 72% FRL vs 36% district-wide (36 pts higher); higher-poverty schools than district average — tighter screening recommended.
- Market conditions: Rents rising (+1.4%/yr); 741 active listings in the ZIP; 9 comparable units currently listed for rent nearby; rentals at typical pace (median 26d on market — plan ~3-4 weeks tenant-placement turnaround); solid renter incomes; 1,199 units permitted in Dorchester County in 2024 (0 in 5+ unit buildings).
- This rent runs 33% of the median local income ($86k/yr) — at the standard rent-burdened threshold; future hikes will face affordability resistance.
Forward outlook
- Local home prices are declining (-3.0%/yr); year-one equity from $2k of loan paydown is wiped out by about $9k of value loss. Plan a longer hold.
- Dorchester County population projected at +43% by 2050 — long-run rental-demand tailwind backs the buy-and-hold thesis.
Negotiation context
- It's been on market 55 days — a 3% lower offer ($284k) is reasonable based on typical stale-listing flexibility.
- 5 sale attempts since 6y ago with the ask held roughly flat each time — persistent listings suggest the price (not the market) is what's stuck; bring a comps-based counter.
- Current owner paid $250k; 17% above their basis — modest negotiation headroom, anchor on the comps not their cost.
Risks & watch-outs
- Climate carrying-cost: severe wind risk, 98% chance of damaging wind over 30y; extreme-heat days projected 7→17/yr by 2055 (HVAC capex compounding) — expect insurance premiums to compound above CPI over the hold.
Questions for the listing agent
- It's been on market 55 days. Have you received any prior offers? Is the seller open to a 20% concession, seller financing, or rate buy-down credit?
- Built in 1976 — when were the roof, HVAC, electrical panel, plumbing, and water heater last replaced?
- Is there a deadline driving the sale (1031 exchange, divorce, estate, relocation)? That informs how much negotiation room exists.
- Schools are B-rated — typically a magnet for longer-tenancy family renters. What's the average tenant stay here, and is there a school-zone premium baked into asking?
- The area grade is low — what's the realistic commute time and amenity access for the typical tenant pool here? Any planned neighborhood developments (good or bad) we should know about?
- What's the average days-on-market for RENTAL listings here right now (not sales)? A rising rental-DOM trend means longer vacancies and softer asking-rent achievability than the comps imply.
- What's the recent tenant-quality profile in this submarket — average credit score on applications, eviction rate, late-payment / NSF rate, and stable-employment percentage? A property-management company in the area should have these aggregated.
- How much new for-sale + rental construction is in the pipeline within 1–3 miles? Heavy new supply typically softens prices + rents 12–24 months out; constrained supply supports both.
Investment metrics
- 1% rule
- 0.80% ✗
- Cap rate
- 6.44%
- Cash-on-cash
- 0.51%
- DSCR
- 1.02
- GRM
- 10.5
CMA / ARV
- ARV (on-the-fly)
- $334,776
- Comps found
- 12
Show comp detail 12 sales within ~0.75 mi
| Address | Dist | Beds/Ba | Sqft | Sold | Price | $/sf | Match |
|---|---|---|---|---|---|---|---|
| 114 Froman Dr | 0.03mi | 3/1.5 (-1) | 1,456 (+1%) | 2mo | $202,000 | $139 | 89 |
| 121 Apache Dr | 0.42mi | 3/2.0 (-1) | 1,462 (+1%) | 1mo | $310,000 | $212 | 68 |
| 108 Apache Dr | 0.47mi | 3/2.0 (-1) | 1,445 (+0%) | 2mo | $325,000 | $225 | 67 |
| 322 Damascus Dr | 0.31mi | 3/2.0 (-1) | 1,342 (-7%) | 4mo | $312,000 | $232 | 61 |
| 237 Moon Dance Ln | 0.59mi | 3/2.0 (-1) | 1,423 (-1%) | 2mo | $343,000 | $241 | 60 |
| 142 Moon Dance Ln | 0.65mi | 3/2.0 (-1) | 1,452 (+1%) | 2mo | $307,000 | $211 | 58 |
| 141 Casein St | 0.55mi | 3/2.0 (-1) | 1,500 (+4%) | 3mo | $364,000 | $243 | 56 |
| 108 Jupiter Ln | 0.60mi | 3/2.0 (-1) | 1,353 (-6%) | 1mo | $310,000 | $229 | 52 |
| 103 O'leary Cir | 0.70mi | 3/2.0 (-1) | 1,548 (+7%) | 1mo | $387,500 | $250 | 45 |
| 425 Verbena Ave | 0.74mi | 3/2.5 (-1) | 1,328 (-8%) | 3mo | $320,000 | $241 | 39 |
| 116 Forest Cir | 0.70mi | 3/2.0 (-1) | 1,300 (-10%) | 4mo | $225,000 | $173 | 38 |
| 207 Apache Dr | 0.59mi | 3/2.0 (-1) | 1,237 (-14%) | 4mo | $299,000 | $242 | 36 |
Match score weights: distance 35% · size 25% · config 20% · recency 20%. Top-matched comps best support the ARV.
Projected returns pro-forma
-3.0% appreciation · 1.45% rent growth · sell at horizon
- IRR
- -17.1%
- Equity multiple
- 0.40×
- Total profit
- $-48,933
- Equity at exit
- $43,687
- IRR
- -11.9%
- Equity multiple
- 0.34×
- Total profit
- $-54,389
- Equity at exit
- $25,333
Cash invested: $82,040 (down + closing). Projections, not guarantees.
Landlord ↔ Tenant lean methodology
- Overall (STATE)
- 90 Strongly Landlord-Friendly
- State South Carolina
- 90 Strongly Landlord-Friendly · R+6
- County
- — inherits STATE
- City
- — inherits STATE
ZIP-level market 29483
- Home prices YoY
- -34.6%
- Rents YoY
- 1.4%
- Active inventory
- 741
- Price-to-rent
- 10.5×
Monthly cashflow live
- Estimated rent
- $2,332 high interval (Pro) →
- Mortgage (P&I)
- −$1,537
- Tax from tax record
- −$148 /mo · $1,781/yr
- Insurance
- −$122
- HOA
- −$0
- Lot rent
- −$0
- Vacancy / Maint / Mgmt
- −$490
- Net cashflow
- $35
Break-even live
Sensitivity live
| Price | -10% $201 | -5% $118 | +0% $35 | +5% $-48 | +10% $-131 |
|---|---|---|---|---|---|
| Rent | -10% $-149 | -5% $-57 | +0% $35 | +5% $127 | +10% $219 |
| Rate | -1.0pp $183 | -0.5pp $109 | base $35 | +0.5pp $-41 | +1.0pp $-118 |
UW: 25.0% down · 7.5% · 30yr · 1.5% tax · 5.0% vac · 8.0% maint · 8.0% mgmt
Financing live
Cash to close
- Down payment
- $73,250
- Closing costs
- $8,790
- Reserves months
- —
- Total cash needed
- —
Loan-product check · same deal, 3 products live
Conventional
25% down · 7.5% · 30yr
- Down + closing
- —
- Monthly P&I
- —
- Monthly cashflow
- —
- DSCR
- —
- Eligible?
- —
Personal DTI + credit; lowest rate.
DSCR
20% down · 8.5% · 30yr
- Down + closing
- —
- Monthly P&I
- —
- Monthly cashflow
- —
- DSCR
- —
- Eligible?
- —
No personal income docs; deal must DSCR.
Hard money
10% down · 12.0% · 12mo
- Down + closing
- —
- Monthly P&I
- —
- Monthly cashflow
- —
- DSCR
- —
- Eligible?
- —
Short-term bridge; refi at stabilization.
Rent comps 9 comps
| Address | Beds | Baths | Sqft | Rent | $/sqft | DOM | Units | Dist |
|---|---|---|---|---|---|---|---|---|
| 153 Omalley Dr Summerville, SC | 3.0 | 3.0 | 1760 | $2,290 | $1.30 | 25d | 1 | 0.40mi |
| 409 Verbena Ave Summerville, SC | 3.0 | 2.5 | 1301 | $1,950 | $1.50 | 25d | 1 | 0.72mi |
| 207 Ruth Anne Dr Summerville, SC | 3.0 | 1.0 | 1000 | $1,600 | $1.60 | 21d | 1 | 0.95mi |
| 157 Cantona Dr Summerville, SC | 3.0 | 2.5 | 1737 | $2,300 | $1.32 | 25d | 1 | 0.99mi |
| 319 Pimpernel St Summerville, SC | 3.0 | 2.5 | 1660 | $2,400 | $1.45 | 5d | 1 | 1.04mi |
| 105 Barberry St Summerville, SC | 3.0 | 2.5 | 1285 | $2,050 | $1.60 | 5d | 1 | 1.21mi |
| 103 Barberry St Summerville, SC | 3.0 | 2.5 | 1548 | $2,011 | $1.30 | 25d | 1 | 1.21mi |
| 303 Canaberry Cir Summerville, SC | 3.0 | 2.0 | 1438 | $2,395 | $1.67 | 25d | 1 | 1.31mi |
| 133 Cableswynd Way Summerville, SC | 3.0 | 2.0 | 1405 | $2,200 | $1.57 | 25d | 1 | 1.39mi |
Listing history 35 events
-
2026-06-22pricedays on market $293,000 Active 55 DOM
-
2026-06-18days on market $293,500 Active 52 DOM
-
2026-06-17days on market $293,500 Active 51 DOM
-
2026-06-16days on market $293,500 Active 50 DOM
-
2026-06-15days on market $293,500 Active 49 DOM
-
2026-06-13days on market $293,500 Active 47 DOM
-
2026-06-13days on market $293,500 Active 46 DOM
-
2026-06-10days on market $293,500 Active 44 DOM
-
2026-06-09days on market $293,500 Active 43 DOM
-
2026-06-08pricedays on market $293,500 Active 42 DOM
-
2026-06-07days on market $294,000 Active 41 DOM
-
2026-06-03pricedays on market $294,000 Active 37 DOM
-
2026-06-01days on market $295,000 Active 35 DOM
-
2026-05-31days on market $295,000 Active 34 DOM
-
2026-05-21price $295,000
-
2026-05-10price $297,900
-
2026-04-27$299,900 Active
-
2026-04-16historical
-
2026-04-10price $293,000
-
2026-04-05price $305,000
-
2026-03-31price $310,000
-
2026-03-05$295,000 Active
-
2026-03-04historical
-
2026-02-24price $315,000
-
2026-01-20$300,000 Active
-
2022-05-16soldstatus $250,000 Closed
-
2022-04-04status Pending
-
2022-04-01price $255,000
-
2022-03-23price $260,000
-
2022-03-15$275,000 Active
-
2020-07-13soldstatus $138,500
-
2020-06-30soldstatus $138,500 Closed
-
2020-05-26historical Active Contingent
-
2020-05-22$142,900 Active
-
1991-07-24soldstatus $41,082
ⓘ Source: listings_history table (triggers on properties + properties_extension) + one-shot
backfill from property_details.listing_events for pre-trigger history.
Tax reassessment forecast SC · Resets to sale price
- Current annual tax
- $1,781 · $148/mo
- Projected year-2 tax
- $1,781 · $148/mo
- Expected delta
- $0/yr ($0/mo · 0.0%)
ⓘ Screening estimate from a state-policy table — verify with the county assessor before closing.
Climate risk First Street
- Flood 1/10 Low FEMA zone X (unshaded) · 0% chance over 30 yrs
- Wildfire 3/10 Moderate
- Heat 9/10 Extreme 7 d/yr ≥108°F today · 17 d/yr by 30 yrs out
- Wind 8/10 Severe 98% chance of damaging wind over 30 yrs
- Air quality 3/10 Moderate 3 unhealthy d/yr today · 3 by 30 yrs out
Nearby sold comps map
Loading sold comps map…
Walkable amenities ~0.75 mi
Loading nearby amenities…
Taxation est. · year 1
- Rental income
- $27,979
- − Mortgage interest
- −$16,413
- − Property taxes
- −$1,781
- − Insurance
- −$1,465
- − Repairs & maintenance
- −$2,238
- − Management
- −$2,238
- − Depreciation
- −$8,524
- Taxable loss
- −$4,680
- Est. tax savings @ 24.0%
- +$1,123
- After-tax cash flow
- $1,542/yr
For passive investors: Depreciation is non-cash, so a rental often shows a tax loss while cash-flowing — sheltering income. Rental losses are passive: they offset passive income freely, and up to $25,000/yr can offset ordinary (W-2) income if you actively participate and your MAGI is under $100k (phasing out to $0 by $150k); unused losses carry forward. On sale, claimed depreciation is recaptured at up to 25%, and gains may owe capital-gains tax (a 1031 exchange can defer both). Figures are a year-1 estimate at your 24.0% rate — not tax advice; consult a CPA.
Schools (NCES district)
- District
- Dorchester 02
- NCES district ID
- 4502010
- Math proficiency
- 40% ▼ -13.00%
- Reading proficiency
- 55% ▼ -4.00%
- Median HH income
- $57,937
- Composite
- 41.41/100
- National rank
- #3475
- State rank
- #12 of 80 in SC
Livability — Summerville
- Score
- 63/100
- State rank
- #167
- US rank
- #15058
Category grades
Schools grade is shown separately in the Schools card above.
Census & demographics
- County
- Dorchester County · 182,866 people
- City population
- 171,668
- Metro
- Charleston-North Charleston, SC
- Population (ZIP)
- 59,186
- Household income
- $85,750
- Rent vs Own
- Severe rent burden
- 1309.0
Population outlook (Dorchester County) Hauer SSP2
- Today (2025)
- 186,982 people
- By 2030
- 203,967 · +9.1%
- By 2040
- 237,160 · +26.8%
- By 2050
- 267,479 · +43.1%
- By 2075
- 333,025 · +78.1%
- By 2100
- 366,560 · +96.0%
Race, ethnicity, and origin ACS 2023
- Neighborhood character
- Predominantly White (68%)
- Race & ethnicity
- White 68% Black 19% Hispanic / Latino 7% Two or more races 6% Asian 1%
- Hispanic origin (detail)
- Mexican 3% Puerto Rican 1%
- Common ancestry
- Slovak 3% Lithuanian 3% Romanian 3%
- Foreign-born
- 5% · Canada
- Languages at home
- 93% English-only · Spanish 4%
Political lean MEDSL · Dorchester
- 2024 margin
- R (+14.6) · D 41.8% · R 56.4% · Other 1.9%
- 2008→2024 swing
- +0.9pp no change · 2008: -15.5pp · 2024: -14.6pp
- All cycles
- 2024: R+14.6 2020: R+10.5 2016: R+17.5 2012: R+16.0 2008: R+15.5
Not yet ingested
- Civics
- —
Market trends
- HPI YoY
- ▼ -131.42%
- Current HPI
- 248.8406
- Rent YoY
- ▲ 1.45%
- Metro
- Charleston-North Charleston, SC
- State GDP YoY
- ▲ 4.51%
- F500 in state
- 2
Industry mix (Fortune 500 HQ in SC)
| Industry | F500 HQs | Revenue |
|---|---|---|
| Packaging | 1 | $7B |
|
||
Price history
+618.1% since first listed21 events — show timeline
- 2026-05-21 Price Changed $295,000 Charleston Trident MLS
- 2026-05-10 Price Changed $297,900 Charleston Trident MLS
- 2026-04-27 Listed $299,900 Charleston Trident MLS
- 2026-04-16 Listing Removed — Charleston Trident MLS
- 2026-04-10 Price Changed $293,000 Charleston Trident MLS
- 2026-04-05 Price Changed $305,000 Charleston Trident MLS
- 2026-03-31 Price Changed $310,000 Charleston Trident MLS
- 2026-03-05 Listed $295,000 Charleston Trident MLS
- 2026-03-04 Listing Removed — Charleston Trident MLS
- 2026-02-24 Price Changed $315,000 Charleston Trident MLS
- 2026-01-20 Listed $300,000 Charleston Trident MLS
- 2022-05-16 Sold (MLS) $250,000 Charleston Trident MLS
- 2022-04-04 Pending — Charleston Trident MLS
- 2022-04-01 Price Changed $255,000 Charleston Trident MLS
- 2022-03-23 Price Changed $260,000 Charleston Trident MLS
- 2022-03-15 Listed $275,000 Charleston Trident MLS
- 2020-07-13 Sold (Public Records) $138,500 Public Records
- 2020-06-30 Sold (MLS) $138,500 Charleston Trident MLS
- 2020-05-26 Contingent — Charleston Trident MLS
- 2020-05-22 Listed $142,900 Charleston Trident MLS
- 1991-07-24 Sold (Public Records) $41,082 Public Records
Property tax history
-1.0%/yrLatest (2025): $1,781 · -0.0% YoY. Source: county tax records.
Cash-flow waterfall
monthlySold comps — $/sqft
last 12 mo · ≤1 miLoading sold comps…