 🏷️ Likely Rental
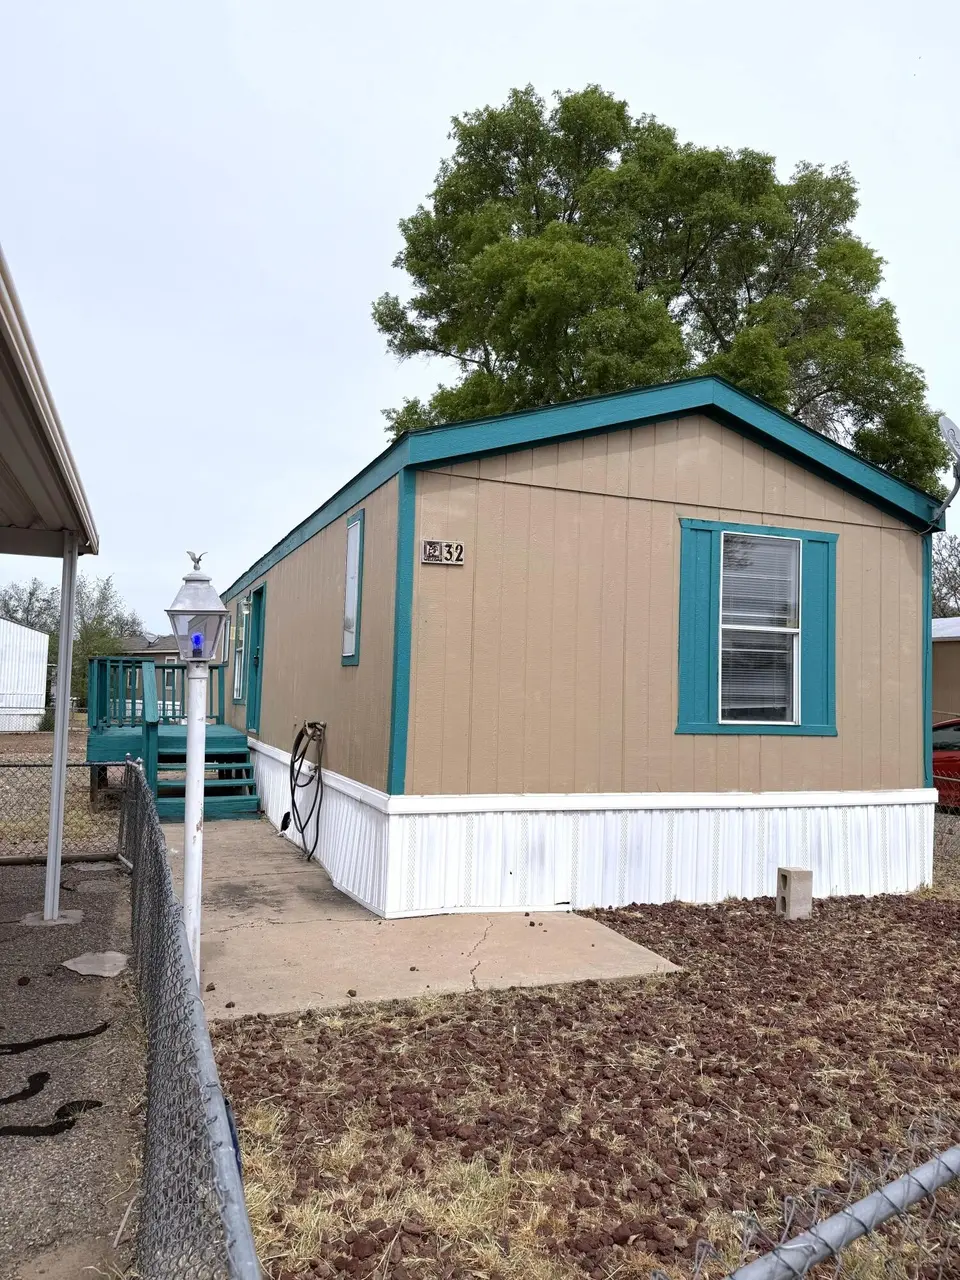
8900 2nd St NW #32 · North Valley, NM
Flood risk 4/10 · Minor
- FEMA flood zone
- X (unshaded)
- Chance of flooding over 30 yrs
- 0.24%
- Est. flood insurance / yr
- $507 – $1,088
Fire risk 1/10 · Minimal
- Est. fire insurance / yr
- $706 – $1,312
Heat risk 5/10 · Moderate
- Hot days now (above 96°F)
- 7 days/yr
- Hot days in 30 yrs
- 18 days/yr
Wind risk 1/10 · Minimal
- Chance of severe wind over 30 yrs
- —
Air-quality risk 3/10 · Minor
- Unhealthy air days now
- 3 days/yr
- Unhealthy air days in 30 yrs
- 3 days/yr
Risk factors via First Street. Map © Google.
Why this score? — see what drove the B+ grade
The composite is a weighted blend of 9 inputs, each scored 0–100. Each bar is that input's sub-score; the figure is the points it added to the 100-point composite (weight × sub-score).
- Cash flow +30.0/30.0
- ARV discount +15.0/15.0
- 1% rule +10.0/10.0
- DSCR +10.0/10.0
- Schools +5.3/10.0
- Livability +3.4/5.0
- Condition / age +2.2/5.0
- Rent growth +1.9/5.0
- Appreciation +0.0/10.0
$65,000
🖨 Deal sheet (PDF) 📄 Offer letter ✓ Due diligence
Listing remarks MLS
Welcome to this charming 3-bedroom, 2-bath manufactured home located in a desirable 55+ mobile home park. Perfect for active adults seeking easy, worry-free living with fantastic outdoor space. Outside, enjoy a nice-sized fenced lot that provides privacy and room to relax or garden. A 2-car carport offers convenient covered parking, while the included Tuff Shed provides excellent additional storage for tools, equipment, or seasonal items. Manufactured home is in a land-lease 55+ community. Buyer must be approved by the park and meet age requirements. Base rent is $675/month.
Key facts
- 2 parking spots
- Built 2000
- Listed 74 days
Neighborhood map
What this means for you Summary
Snapshot
- This is a 3-bed/2.0-bath manufactured listed at $65k. Condition is rated fair.
Deal economics
- At list price, monthly cash flow is $1k ($14k/yr) — positive.
- The deal already cash-flows at list — no discount required.
- Meets the 1% rule at list price ($2k rent vs $65k).
- Recommended offer: $61k (6.0% below list) — sets the bar for market timing.
- Cap rate 27.3% vs local median 2.1% in North Valley — top-decile yield for the area; either an underpriced asset or a hidden risk that comps aren't pricing in. Stress-test before assuming the spread holds.
Location & tenants
- Location reads 67/100 on livability (#28 in NM) — a middle-class / working-renter tenant base. Strengths: cost of living A+, housing A-; Watch: crime F, amenities F, health & safety F.
- Albuquerque Public Schools (urban): math 51% / reading 75% proficiency, ranked #3 of 29 in NM (top 10%) — acceptable for families but not a draw, mixed tenant base, ~2y average lease; 60% free/reduced lunch — lower-income household profile, screen leases tightly.
- Zoned schools: Coronado Elementary (308 students, 30% FRL); Taylor Middle (315 students, 100% FRL); Valley High (math 24% / reading 75%, grade D+, #36 of 110 statewide, top 45%, 1,039 students, 100% FRL) — zoned schools average 77% FRL vs 60% district-wide (17 pts higher); higher-poverty schools than district average — tighter screening recommended.
- Zoned-school proficiency averages 50% at this address vs 63% district-wide (-13 pts) — the specific schools serving this property underperform the Albuquerque Public Schools average; the district grade overstates school quality for this exact location.
- Market conditions: Rents soft (-2.5%/yr); 347 active listings in the ZIP; 3 comparable units currently listed for rent nearby; rentals at typical pace (median 21d on market — plan ~3-4 weeks tenant-placement turnaround); solid renter incomes; 1,316 units permitted in Bernalillo County in 2024 (546 in 5+ unit buildings).
Forward outlook
- Local home prices are declining (-3.0%/yr); year-one equity from $449 of loan paydown is wiped out by about $2k of value loss. Plan a longer hold.
- At projected returns (-3.0% appreciation + 0.0% rent growth), your $18k cash investment doubles in ~2 years — after that, you're playing with house money.
Negotiation context
- It's been on market 74 days — a 6% lower offer ($61k) is reasonable based on typical stale-listing flexibility.
Risks & watch-outs
- Climate carrying-cost: extreme-heat days projected 7→18/yr by 2055 (HVAC capex compounding) — expect insurance premiums to compound above CPI over the hold.
Questions for the listing agent
- It's been on market 74 days. Have you received any prior offers? Is the seller open to a 6% concession, seller financing, or rate buy-down credit?
- Have any recent inspections been done? Can we get a copy of the seller's disclosures and any deferred-maintenance estimates?
- Why hasn't it sold? Are there any deal-killer items the seller is aware of (foundation, flood, title, zoning, code violations)?
- Is there a deadline driving the sale (1031 exchange, divorce, estate, relocation)? That informs how much negotiation room exists.
- Crime grade is F in this area — have there been break-ins, vandalism, or insurance claims at this property in the last 3 years? What carrier currently insures it and at what premium?
- What's the average days-on-market for RENTAL listings here right now (not sales)? A rising rental-DOM trend means longer vacancies and softer asking-rent achievability than the comps imply.
- What's the recent tenant-quality profile in this submarket — average credit score on applications, eviction rate, late-payment / NSF rate, and stable-employment percentage? A property-management company in the area should have these aggregated.
- How much new for-sale + rental construction is in the pipeline within 1–3 miles? Heavy new supply typically softens prices + rents 12–24 months out; constrained supply supports both.
Investment metrics
- 1% rule
- 3.09% ✓
- Cap rate
- 27.33%
- Cash-on-cash
- 75.15%
- DSCR
- 4.34
- GRM
- 2.7
CMA / ARV
- ARV (median comp)
- $94,750
- List price
- $65,000
- Delta
- -31.40%
- Verdict
- UNDERPRICED
- Comps
- 2 within 2.0 mi
Show comp detail 1 sale within ~0.75 mi
| Address | Dist | Beds/Ba | Sqft | Sold | Price | $/sf | Match |
|---|---|---|---|---|---|---|---|
| 8900 2nd St NW #36 | 0.00mi | 2/2.0 (-1) | 980 (+6%) | 4mo | $42,000 | $43 | 82 |
Match score weights: distance 35% · size 25% · config 20% · recency 20%. Top-matched comps best support the ARV.
Projected returns pro-forma
-3.0% appreciation · 0.0% rent growth · sell at horizon
- IRR
- 71.6%
- Equity multiple
- 4.09×
- Total profit
- $56,196
- Equity at exit
- $9,692
- IRR
- 74.7%
- Equity multiple
- 7.58×
- Total profit
- $119,753
- Equity at exit
- $5,620
Cash invested: $18,200 (down + closing). Projections, not guarantees.
Landlord ↔ Tenant lean methodology
- Overall (STATE)
- 55 Moderately Landlord-Leaning
- State New Mexico
- 55 Moderately Landlord-Leaning · D+3
- County
- — inherits STATE
- City
- — inherits STATE
ZIP-level market 87114
- Rents YoY
- -2.5%
- Active inventory
- 347
- Price-to-rent
- 2.7×
Monthly cashflow live
- Estimated rent
- $2,011 medium interval (Pro) →
- Mortgage (P&I)
- −$341
- Tax est. 1.5%
- −$81 /mo · $975/yr
- Insurance
- −$27
- HOA
- −$0
- Vacancy / Maint / Mgmt
- −$422
- Net cashflow
- $1,140
Break-even live
Sensitivity live
| Price | -10% $1,185 | -5% $1,162 | +0% $1,140 | +5% $1,117 | +10% $1,095 |
|---|---|---|---|---|---|
| Rent | -10% $981 | -5% $1,060 | +0% $1,140 | +5% $1,219 | +10% $1,299 |
| Rate | -1.0pp $1,173 | -0.5pp $1,156 | base $1,140 | +0.5pp $1,123 | +1.0pp $1,106 |
UW: 25.0% down · 7.5% · 30yr · 1.5% tax · 5.0% vac · 8.0% maint · 8.0% mgmt
Financing live
Cash to close
- Down payment
- $16,250
- Closing costs
- $1,950
- Reserves months
- —
- Total cash needed
- —
Loan-product check · same deal, 3 products live
Conventional
25% down · 7.5% · 30yr
- Down + closing
- —
- Monthly P&I
- —
- Monthly cashflow
- —
- DSCR
- —
- Eligible?
- —
Personal DTI + credit; lowest rate.
DSCR
20% down · 8.5% · 30yr
- Down + closing
- —
- Monthly P&I
- —
- Monthly cashflow
- —
- DSCR
- —
- Eligible?
- —
No personal income docs; deal must DSCR.
Hard money
10% down · 12.0% · 12mo
- Down + closing
- —
- Monthly P&I
- —
- Monthly cashflow
- —
- DSCR
- —
- Eligible?
- —
Short-term bridge; refi at stabilization.
Rent comps 3 comps
| Address | Beds | Baths | Sqft | Rent | $/sqft | DOM | Units | Dist |
|---|---|---|---|---|---|---|---|---|
| 8943 Boe Ln NE Albuquerque, NM | 3.0 | 1.0 | 1000 | $2,300 | $2.30 | 20d | 1 | 0.12mi |
| 9131 4th St NW Apt B Albuquerque, NM | 2.0 | 1.0 | 900 | $1,150 | $1.28 | 45d | 1 | 0.37mi |
| 8901 Jefferson St NE Albuquerque, NM | 1.0–2.0 | 1.0–2.0 | 706 | $1,275 | $1.80 | 5d | 8 | 1.30mi |
Listing history 16 events
-
2026-06-22days on market $65,000 Active 74 DOM
-
2026-06-18days on market $65,000 Active 71 DOM
-
2026-06-17days on market $65,000 Active 70 DOM
-
2026-06-16days on market $65,000 Active 69 DOM
-
2026-06-15days on market $65,000 Active 68 DOM
-
2026-06-13days on market $65,000 Active 66 DOM
-
2026-06-10days on market $65,000 Active 63 DOM
-
2026-06-09days on market $65,000 Active 62 DOM
-
2026-06-08days on market $65,000 Active 61 DOM
-
2026-06-07days on market $65,000 Active 60 DOM
-
2026-06-05days on market $65,000 Active 57 DOM
-
2026-06-03days on market $65,000 Active 56 DOM
-
2026-06-02days on market $65,000 Active 55 DOM
-
2026-06-01days on market $65,000 Active 54 DOM
-
2026-05-31days on market $65,000 Active 53 DOM
-
2026-03-11$65,000 Active 581-char remark
Show marketing remark (581 chars)
Welcome to this charming 3-bedroom, 2-bath manufactured home located in a desirable 55+ mobile home park. Perfect for active adults seeking easy, worry-free living with fantastic outdoor space. Outside, enjoy a nice-sized fenced lot that provides privacy and room to relax or garden. A 2-car carport offers convenient covered parking, while the included Tuff Shed provides excellent additional storage for tools, equipment, or seasonal items. Manufactured home is in a land-lease 55+ community. Buyer must be approved by the park and meet age requirements. Base rent is $675/month.
ⓘ Source: listings_history table (triggers on properties + properties_extension) + one-shot
backfill from property_details.listing_events for pre-trigger history.
Climate risk First Street
- Flood 4/10 Moderate FEMA zone X (unshaded) · 24% chance over 30 yrs
- Wildfire 1/10 Low
- Heat 5/10 Major 7 d/yr ≥96°F today · 18 d/yr by 30 yrs out
- Wind 1/10 Low
- Air quality 3/10 Moderate 3 unhealthy d/yr today · 3 by 30 yrs out
Nearby sold comps map
Loading sold comps map…
Walkable amenities ~0.75 mi
Loading nearby amenities…
Taxation est. · year 1
- Rental income
- $24,136
- − Mortgage interest
- −$3,641
- − Property taxes
- −$975
- − Insurance
- −$325
- − Repairs & maintenance
- −$1,931
- − Management
- −$1,931
- − Depreciation
- −$1,891
- Taxable income
- $13,443
- Est. tax owed @ 24.0%
- −$3,226
- After-tax cash flow
- $10,451/yr
For passive investors: Depreciation is non-cash, so a rental often shows a tax loss while cash-flowing — sheltering income. Rental losses are passive: they offset passive income freely, and up to $25,000/yr can offset ordinary (W-2) income if you actively participate and your MAGI is under $100k (phasing out to $0 by $150k); unused losses carry forward. On sale, claimed depreciation is recaptured at up to 25%, and gains may owe capital-gains tax (a 1031 exchange can defer both). Figures are a year-1 estimate at your 24.0% rate — not tax advice; consult a CPA.
Condition & rehab AI · 12 photos
This 3-bedroom, 2-bath manufactured home in a 55+ community is in fair condition with cosmetic updates needed to improve its curb appeal and value.
Repairs flagged
- Minor Landscaping — Overgrown vegetation needs trimming
- Minor Exterior paint — Painted walls show some wear
Value-add opportunities
- Both Landscaping and exterior painting — Improves curb appeal and resale value
- Both Kitchen and bathroom updates — Modernizes the home and enhances both resale and rental appeal
Renovation cost estimate screening
| Repair item | Severity | Est. cost |
|---|---|---|
| Landscaping · Overgrown vegetation needs trimming | Minor | $500–3,000 |
| Exterior paint · Painted walls show some wear | Minor | $500–3,000 |
| Total estimated repair cost · 2 items | $1,000–6,000 |
Value-add ROI direction
- Both Landscaping and exterior painting — Improves curb appeal and resale value ↑
- Both Kitchen and bathroom updates — Modernizes the home and enhances both resale and rental appeal ↑
ⓘ Cost ranges are severity-bucket heuristics (US national rule-of-thumb). Get contractor quotes + a written scope before underwriting a rehab budget.
Schools (NCES district)
- District
- Albuquerque Public Schools
- NCES district ID
- 3500060
- Math proficiency
- 51% ▲ 30.00%
- Reading proficiency
- 75% ▲ 45.00%
- Median HH income
- $48,151
- Composite
- 53.29/100
- National rank
- #1487
- State rank
- #3 of 29 in NM
Livability — North Valley
- Score
- 67/100
- State rank
- #28
- US rank
- #10375
Category grades
Schools grade is shown separately in the Schools card above.
Census & demographics
- Census place
- North Valley, NM
- County
- Bernalillo County · 647,165 people
- Metro
- Albuquerque, NM
- Population (ZIP)
- 70,117
- Household income
- $84,277
- Rent vs Own
- Severe rent burden
- 2293.0
Population outlook (Bernalillo County) Hauer SSP2
- Today (2025)
- 704,528 people
- By 2030
- 711,723 · +1.0%
- By 2040
- 714,522 · +1.4%
- By 2050
- 709,274 · +0.7%
- By 2075
- 680,015 · -3.5%
- By 2100
- 619,879 · -12.0%
Race, ethnicity, and origin ACS 2023
- Neighborhood character
- Diverse neighborhood (Simpson 0.63)
- Race & ethnicity
- Hispanic / Latino 46% White 40% Two or more races 21% Native American 4% Black 4% Asian 2%
- Hispanic origin (detail)
- Mexican 23% Puerto Rican 1%
- Common ancestry
- Lithuanian 3% Romanian 2% Italian 2%
- Foreign-born
- 6% · Canada, China
- Languages at home
- 83% English-only · Spanish 13% Other Indo-European 1%
Political lean MEDSL · Bernalillo
- 2024 margin
- Strong D (+21.0) · D 59.2% · R 38.2% · Other 2.6%
- 2008→2024 swing
- -0.3pp no change · 2008: 21.4pp · 2024: 21.0pp
- All cycles
- 2024: D+21.0 2020: D+24.4 2016: D+17.8 2012: D+16.2 2008: D+21.4
Not yet ingested
- Civics
- —
Market trends
- HPI YoY
- ▼ -227.99%
- Current HPI
- 232.3689
- Rent YoY
- ▼ -2.45%
- Metro
- Albuquerque, NM
- State GDP YoY
- —
- F500 in state
- 0
Price history
1 event — show timeline
- 2026-03-11 Listed $65,000 Southwest MLS
Cash-flow waterfall
monthlySold comps — $/sqft
last 12 mo · ≤1 miLoading sold comps…