 6-Plex
162 Burke St · River Rouge, MI
Flood risk 7/10 · Major
- FEMA flood zone
- X (unshaded)
- Chance of flooding over 30 yrs
- 0.97%
- Est. flood insurance / yr
- $507 – $1,088
Fire risk 1/10 · Minimal
- Est. fire insurance / yr
- $784 – $1,456
Heat risk 3/10 · Minor
- Hot days now (above 95°F)
- 7 days/yr
- Hot days in 30 yrs
- 15 days/yr
Wind risk 2/10 · Minimal
- Chance of severe wind over 30 yrs
- —
Air-quality risk 4/10 · Minor
- Unhealthy air days now
- 6 days/yr
- Unhealthy air days in 30 yrs
- 8 days/yr
Risk factors via First Street. Map © Google.
Why this score? — see what drove the B grade
The composite is a weighted blend of 9 inputs, each scored 0–100. Each bar is that input's sub-score; the figure is the points it added to the 100-point composite (weight × sub-score).
- Cash flow +27.1/30.0
- Appreciation +10.0/10.0
- DSCR +9.4/10.0
- ARV discount +7.5/15.0
- 1% rule +7.3/10.0
- Condition / age +3.8/5.0
- Livability +3.2/5.0
- Rent growth +2.5/5.0
- Schools +0.5/10.0
$399,900
🖨 Deal sheet 📄 Offer letter ✓ Due diligence
Listing remarks
Excellent investment opportunity! Fully occupied 6-unit multifamily property offering immediate positive cash flow. Several units have been beautifully updated with remodeled kitchens and bathrooms, providing modern finishes that tenants appreciate. Property features coin-operated laundry for additional income and convenience. Well-maintained with strong rental history and stable occupancy. A turnkey investment with income from day one, making it a great addition to any investor's portfolio. Don't miss this opportunity to own a solid income-producing property! BATVAI
Key facts
- Stable occupancy
- Remodeled kitchens
- Remodeled bathrooms
Tags
Neighborhood map
What this means for you Summary
Snapshot
- This is a 6 × 2-bed/1.0-bath units multifamily listed at $400k. Condition is rated good.
Deal economics
- At list price, monthly cash flow is $1k ($13k/yr) — positive. Per door: $178/mo.
- The deal already cash-flows at list — no discount required.
- Meets the 1% rule at list price ($5k rent vs $400k).
- Cap rate 9.7% vs local median 8.1% in River Rouge — meaningfully above typical; check what's discounted (condition, days-on-market, listing class) to confirm the premium yield is real.
Location & tenants
- Location reads 65/100 on livability (#454 in MI) — a middle-class / working-renter tenant base. Strengths: commute A+, cost of living A+, housing B+; Watch: health & safety D, schools F, crime F.
- River Rouge School District (suburban): math 3% / reading 12% proficiency, ranked #535 of 540 in MI (top 99%) — low school quality limits family demand, transient renter base, plan for 1-2y turnover; 89% free/reduced lunch — lower-income household profile, screen leases tightly.
- Market conditions: 58 active listings in the ZIP; 2,639 units permitted in Wayne County in 2024 (1,216 in 5+ unit buildings).
Forward outlook
- In year one you build about $43k of equity ($3k loan paydown + $40k appreciation (10.0% local appreciation)).
- Wayne County population projected at -17% by 2050 — secular population decline; favor cash flow + early exit over multi-decade hold.
- At projected returns (10.0% appreciation + 3.0% rent growth), your $112k cash investment doubles in ~2 years — after that, you're playing with house money.
- By year 2, paydown + projected appreciation supports a ~$69k cash-out refi (75% LTV) — recoverable capital for the next deal without selling this one.
Negotiation context
- Only 4 days on market — expect competitive offers; lowballing is unlikely to land.
Risks & watch-outs
- Watch-outs: flood insurance adds $66/mo; built in 1957 — expect roof / HVAC / electrical / plumbing capex.
- Climate carrying-cost: major flood risk — expect insurance premiums to compound above CPI over the hold.
Questions for the listing agent
- Can we see the unit-by-unit rent roll, current vacancy, and any below-market leases? What's the average tenancy length?
- What capital expenditures (roof, boiler, parking lot, exteriors) have been made in the last 5 years, and what's planned in the next 2?
- Built in 1957 — when were the roof, HVAC, electrical panel, plumbing, and water heater last replaced?
- What's the actual annual flood-insurance premium (NFIP or private), and is the property in a SFHA with mandatory coverage?
- Is there a deadline driving the sale (1031 exchange, divorce, estate, relocation)? That informs how much negotiation room exists.
- Schools are F-rated, which usually means shorter tenancies and higher turnover. Who's the typical renter profile here, and what's been the actual vacancy rate?
- Crime grade is F in this area — have there been break-ins, vandalism, or insurance claims at this property in the last 3 years? What carrier currently insures it and at what premium?
- What's the average days-on-market for RENTAL listings here right now (not sales)? A rising rental-DOM trend means longer vacancies and softer asking-rent achievability than the comps imply.
- What's the recent tenant-quality profile in this submarket — average credit score on applications, eviction rate, late-payment / NSF rate, and stable-employment percentage? A property-management company in the area should have these aggregated.
- How much new apartment / multifamily construction is in the pipeline within 1–3 miles? Heavy new supply (>2% of stock underway) typically softens rents 12–24 months out; light construction supports rent growth.
Investment metrics
- 1% rule
- 1.23% ✓
- Cap rate
- 9.69%
- Cash-on-cash
- 12.14%
- DSCR
- 1.54
- GRM
- 6.8
CMA / ARV
No comps found within radius.
Projected returns pro-forma
10.0% appreciation · 3.0% rent growth · sell at horizon
- IRR
- 32.7%
- Equity multiple
- 3.55×
- Total profit
- $285,818
- Equity at exit
- $360,262
- IRR
- 28.2%
- Equity multiple
- 8.04×
- Total profit
- $788,516
- Equity at exit
- $776,918
Cash invested: $111,972 (down + closing). Projections, not guarantees.
Landlord ↔ Tenant lean methodology
- Overall (STATE)
- 62 Landlord-Friendly
- State Michigan
- 62 Landlord-Friendly · EVEN
- County
- — inherits STATE
- City
- — inherits STATE
ZIP-level market 48218
- Home prices YoY
- 28.4%
- Active inventory
- 58
- Price-to-rent
- 40.5×
Monthly cashflow live
- Estimated rent
- $4,932 medium interval (Pro) →
- Mortgage (P&I)
- −$2,097
- Tax est. 1.5%
- −$500 /mo · $5,998/yr
- Insurance
- −$167
- Flood insurance flood zone
- −$66 /mo · $798/yr
- HOA
- −$0
- Vacancy / Maint / Mgmt
- −$1,036
- Net cashflow
- $1,066
Break-even live
6-unit breakdown (identical units grouped — click to expand)
| Units | Beds | Baths | Est. rent |
|---|---|---|---|
| 6× units | 2 | 1 | $4,932 |
| #1 | 2 | 1 | $822 |
| #2 | 2 | 1 | $822 |
| #3 | 2 | 1 | $822 |
| #4 | 2 | 1 | $822 |
| #5 | 2 | 1 | $822 |
| #6 | 2 | 1 | $822 |
| Total (6 units) | $4,932 | ||
UW: 25.0% down · 7.5% · 30yr · 1.5% tax · 5.0% vac · 8.0% maint · 8.0% mgmt
Financing live
Cash to close
- Down payment
- $99,975
- Closing costs
- $11,997
- Reserves months
- —
- Total cash needed
- —
Loan-product check · same deal, 3 products live
Conventional
25% down · 7.5% · 30yr
- Down + closing
- —
- Monthly P&I
- —
- Monthly cashflow
- —
- DSCR
- —
- Eligible?
- —
Personal DTI + credit; lowest rate.
DSCR
20% down · 8.5% · 30yr
- Down + closing
- —
- Monthly P&I
- —
- Monthly cashflow
- —
- DSCR
- —
- Eligible?
- —
No personal income docs; deal must DSCR.
Hard money
10% down · 12.0% · 12mo
- Down + closing
- —
- Monthly P&I
- —
- Monthly cashflow
- —
- DSCR
- —
- Eligible?
- —
Short-term bridge; refi at stabilization.
Listing history 8 events
-
2026-06-18days on market $399,900 Active 4 DOM
-
2026-06-17days on market $399,900 Active 3 DOM
-
2026-06-16days on market $399,900 Active 2 DOM
-
2026-06-15days on market $399,900 Active 1 DOM
-
2026-06-15days on market $399,900 Active 2 DOM
-
2026-06-13remarks 573-char remark
-
2026-06-13price $399,900 Active 1 DOM
-
2026-05-26$400,000 Active
ⓘ Source: listings_history table (triggers on properties + properties_extension) + one-shot
backfill from property_details.listing_events for pre-trigger history.
Climate risk First Street
- Flood 7/10 Severe FEMA zone X (unshaded) · 97% chance over 30 yrs
- Wildfire 1/10 Low
- Heat 3/10 Moderate 7 d/yr ≥95°F today · 15 d/yr by 30 yrs out
- Wind 2/10 Low
- Air quality 4/10 Moderate 6 unhealthy d/yr today · 8 by 30 yrs out
Nearby sold comps map
Loading sold comps map…
Walkable amenities ~0.75 mi
Loading nearby amenities…
Taxation est. · year 1
- Rental income
- $59,184
- − Mortgage interest
- −$22,401
- − Property taxes
- −$5,998
- − Insurance
- −$2,797
- − Repairs & maintenance
- −$4,735
- − Management
- −$4,735
- − Depreciation
- −$11,633
- Taxable income
- $6,885
- Est. tax owed @ 24.0%
- −$1,652
- After-tax cash flow
- $11,142/yr
For passive investors: Depreciation is non-cash, so a rental often shows a tax loss while cash-flowing — sheltering income. Rental losses are passive: they offset passive income freely, and up to $25,000/yr can offset ordinary (W-2) income if you actively participate and your MAGI is under $100k (phasing out to $0 by $150k); unused losses carry forward. On sale, claimed depreciation is recaptured at up to 25%, and gains may owe capital-gains tax (a 1031 exchange can defer both). Figures are a year-1 estimate at your 24.0% rate — not tax advice; consult a CPA.
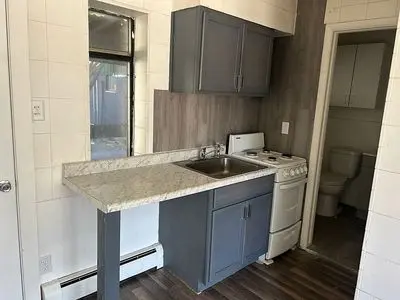
Condition & rehab AI · 2 photos
This fully occupied 6-unit multifamily property offers immediate positive cash flow and is in good condition with modern updates. It presents a solid investment opportunity with potential for minor cosmetic improvements to further enhance its value.
Value-add opportunities
- Both Painting exterior and interior walls — Fresh paint can enhance curb appeal and interior aesthetics.
- Both Landscaping improvements — Enhanced landscaping can improve curb appeal and attract tenants.
- Rental HVAC maintenance and tune-up — A well-maintained HVAC system ensures comfort and reduces utility costs for tenants.
Renovation cost estimate screening
Value-add ROI direction
- Both Painting exterior and interior walls — Fresh paint can enhance curb appeal and interior aesthetics. ↑
- Both Landscaping improvements — Enhanced landscaping can improve curb appeal and attract tenants. ↑
- Rental HVAC maintenance and tune-up — A well-maintained HVAC system ensures comfort and reduces utility costs for tenants. ↑
ⓘ Cost ranges are severity-bucket heuristics (US national rule-of-thumb). Get contractor quotes + a written scope before underwriting a rehab budget.
Schools (NCES district)
- District
- River Rouge School District
- NCES district ID
- 2629760
- Math proficiency
- 3% ▼ -7.00%
- Reading proficiency
- 12% ▼ -4.00%
- Median HH income
- $26,664
- Composite
- 5.29/100
- National rank
- #10033
- State rank
- #535 of 540 in MI
Livability — River Rouge
- Score
- 65/100
- State rank
- #454
- US rank
- #12700
Category grades
Schools grade is shown separately in the Schools card above.
Census & demographics
- Census place
- River Rouge, MI
- City population
- 7,096
- Population (ZIP)
- 7,096
Population outlook (Wayne County) Hauer SSP2
- Today (2025)
- 1,675,273 people
- By 2030
- 1,620,300 · -3.3%
- By 2040
- 1,502,341 · -10.3%
- By 2050
- 1,384,039 · -17.4%
- By 2075
- 1,124,592 · -32.9%
- By 2100
- 881,193 · -47.4%
Race, ethnicity, and origin ACS 2023
- Neighborhood character
- Diverse neighborhood (Simpson 0.66)
- Race & ethnicity
- Black 45% White 34% Two or more races 16% Hispanic / Latino 16%
- Hispanic origin (detail)
- Mexican 9% Puerto Rican 5%
- Common ancestry
- Romanian 4% Lithuanian 2% Italian 1%
- Foreign-born
- 6% · Canada
- Languages at home
- 86% English-only · Spanish 11% Arabic 2% Other Indo-European 1%
Political lean MEDSL · Wayne
- 2024 margin
- Strong D (+29.0) · D 62.7% · R 33.7% · Other 3.6%
- 2008→2024 swing
- -20.5pp toward R · 2008: 49.5pp · 2024: 29.0pp
- All cycles
- 2024: D+29.0 2020: D+38.1 2016: D+37.3 2012: D+46.9 2008: D+49.5
Not yet ingested
- Civics
- —
Market trends
- HPI YoY
- ▲ 77.93%
- Current HPI
- 352.3551
- Rent YoY
- —
- Metro
- —
- State GDP YoY
- ▲ 1.37%
- F500 in state
- 28
Industry mix (Fortune 500 HQ in MI)
| Industry | F500 HQs | Revenue |
|---|---|---|
| Automotive Parts | 3 | $48B |
|
||
| Automotive | 2 | $372B |
|
||
| Chemicals | 1 | $45B |
|
||
| Automotive Retail | 1 | $29B |
|
||
| Healthcare / Medical Devices | 1 | $23B |
|
||
| Automotive Technology | 1 | $20B |
|
||
Price history
1 event — show timeline
- 2026-05-26 Listed $400,000 FSBO.com
Cash-flow waterfall
monthlySold comps — $/sqft
last 12 mo · ≤1 miLoading sold comps…