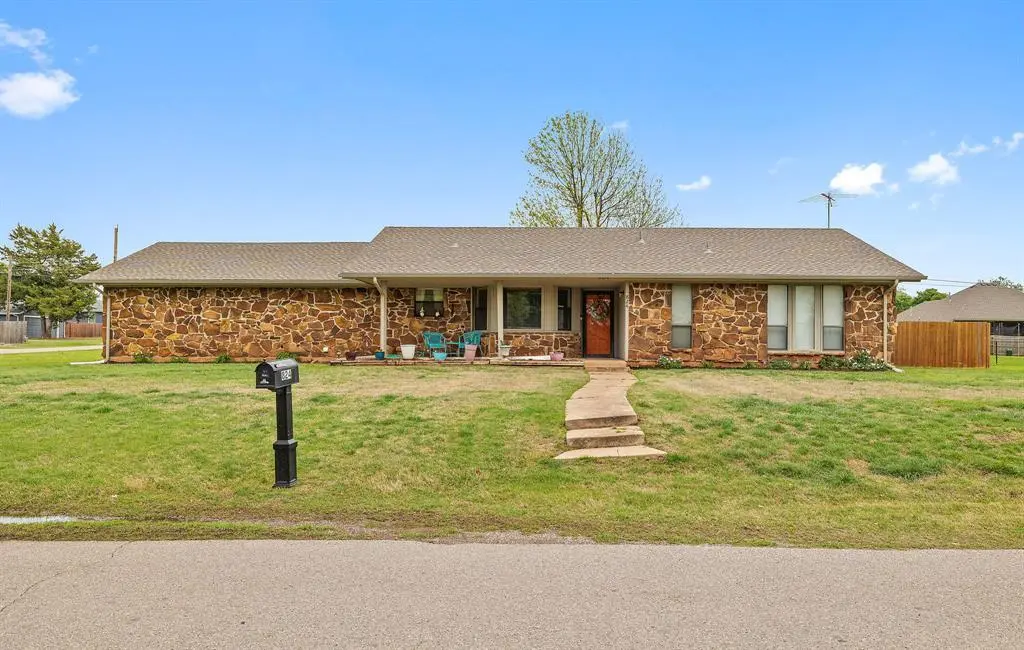
824 N Madison Ave · Blanchard, OK
Flood risk 1/10 · Minimal
- FEMA flood zone
- X (unshaded)
- Chance of flooding over 30 yrs
- 0.0%
- Est. flood insurance / yr
- $507 – $1,088
Fire risk 5/10 · Moderate
- Est. fire insurance / yr
- $2,463 – $4,575
Heat risk 6/10 · Moderate
- Hot days now (above 108°F)
- 7 days/yr
- Hot days in 30 yrs
- 19 days/yr
Wind risk 3/10 · Minor
- Chance of severe wind over 30 yrs
- 5.0%
Air-quality risk 2/10 · Minimal
- Unhealthy air days now
- 1 days/yr
- Unhealthy air days in 30 yrs
- 2 days/yr
Risk factors via First Street. Map © Google.
Why this score? — see what drove the D+ grade
The composite is a weighted blend of 9 inputs, each scored 0–100. Each bar is that input's sub-score; the figure is the points it added to the 100-point composite (weight × sub-score).
- Cash flow +12.3/30.0
- ARV discount +10.0/15.0
- Appreciation +5.7/10.0
- DSCR +3.6/10.0
- Schools +3.6/10.0
- Livability +3.5/5.0
- 1% rule +2.6/10.0
- Rent growth +2.5/5.0
- Condition / age +2.5/5.0
$215,000
🖨 Deal sheet 📄 Offer letter ✓ Due diligence
Listing remarks
Welcome to this charming and very well kept home in the heart of Blanchard. This home features 2 beds 2 baths with large, open living room with wood burning fireplace and very spacious bedrooms. Primary bath has been updated with a walk-in tile shower, this room also features a very nice walk in closet. Laundry room features a sink and ample storage. The 2 car garage is oversized for all your storage needs. This corner lot is expansive and most of it fenced with newer privacy fence. The roof was replaced in 2019 as well as HVAC. Hot water tank was replaced in 2014. Seller has always had a pest control company come yearly to spray for all insects as a preventative. All maintenance on HVAC is
Key facts
- Walk in tile shower
- Expansive corner lot
- Newer privacy fence
Tags
Neighborhood map
What this means for you Summary
Snapshot
- This is a 3-bed/2.0-bath single-family listed at $215k.
Deal economics
- At list price, monthly cash flow is $-41 ($-488/yr) — negative.
- To cash-flow at today's rent, offer at most $208k (3.3% below list).
- To meet the 1% rule (rent ≥ 1% of price), the offer needs to be $163k (24.2% below list).
- Recommended offer: $163k (24.2% below list) — sets the bar for 1% rule.
- Cap rate 6.1% vs local median 2.6% in Blanchard — top-decile yield for the area; either an underpriced asset or a hidden risk that comps aren't pricing in. Stress-test before assuming the spread holds.
Location & tenants
- Location reads 69/100 on livability (#47 in OK) — a middle-class / working-renter tenant base. Strengths: crime A+, cost of living A+, housing A+; Watch: amenities F, commute F, health & safety F.
- Blanchard (rural): math 39% / reading 41% proficiency, ranked #13 of 270 in OK (top 5%) — families likely to look elsewhere, expect single-tenant / working-renter base with shorter leases.
- Zoned schools: Blanchard Intermediate Es (math 57% / reading 38%, grade D, #50 of 845 statewide, top 6%, 481 students, 0% FRL); Blanchard Hs (math 27% / reading 42%, grade F, #48 of 447 statewide, top 14%, 724 students, 0% FRL) — zoned schools average 0% FRL vs 38% district-wide (38 pts lower); this property's tenant base skews higher-income than the district average.
- Market conditions: 507 active listings in the ZIP; 6 comparable units currently listed for rent nearby; rentals leasing fast (median 2d on market — plan ~1-2 weeks tenant-placement turnaround); solid renter incomes; 334 units permitted in McClain County in 2024 (0 in 5+ unit buildings).
Forward outlook
- In year one you build about $5k of equity ($1k loan paydown + $3k appreciation (1.4% local appreciation)).
- McClain County population projected at +44% by 2050 — long-run rental-demand tailwind backs the buy-and-hold thesis.
- At projected returns (1.4% appreciation + 3.0% rent growth), your $60k cash investment doubles in ~10 years — after that, you're playing with house money.
- By year 7, paydown + projected appreciation supports a ~$30k cash-out refi (75% LTV) — recoverable capital for the next deal without selling this one.
Negotiation context
- Only 6 days on market — expect competitive offers; lowballing is unlikely to land.
- Current owner paid $110k; list at $215k implies a 95% gain — meaningful room to come down on a strong offer.
Risks & watch-outs
- Climate carrying-cost: moderate wildfire risk; extreme-heat days projected 7→19/yr by 2055 (HVAC capex compounding) — expect insurance premiums to compound above CPI over the hold.
Questions for the listing agent
- What do current leases actually rent for vs. the listed asking? Can we see a recent rent roll and the last 12 months of T-12 income?
- Built in 1978 — when were the roof, HVAC, electrical panel, plumbing, and water heater last replaced?
- Is there a deadline driving the sale (1031 exchange, divorce, estate, relocation)? That informs how much negotiation room exists.
- Schools are D-rated, which usually means shorter tenancies and higher turnover. Who's the typical renter profile here, and what's been the actual vacancy rate?
- The area grade is low — what's the realistic commute time and amenity access for the typical tenant pool here? Any planned neighborhood developments (good or bad) we should know about?
- What's the average days-on-market for RENTAL listings here right now (not sales)? A rising rental-DOM trend means longer vacancies and softer asking-rent achievability than the comps imply.
- What's the recent tenant-quality profile in this submarket — average credit score on applications, eviction rate, late-payment / NSF rate, and stable-employment percentage? A property-management company in the area should have these aggregated.
- How much new for-sale + rental construction is in the pipeline within 1–3 miles? Heavy new supply typically softens prices + rents 12–24 months out; constrained supply supports both.
Investment metrics
- 1% rule
- 0.76% ✗
- Cap rate
- 6.07%
- Cash-on-cash
- -0.81%
- DSCR
- 0.96
- GRM
- 11.0
CMA / ARV
- ARV (on-the-fly)
- $227,520
- Comps found
- 12
Show comp detail 12 sales within ~0.75 mi
| Address | Dist | Beds/Ba | Sqft | Sold | Price | $/sf | Match |
|---|---|---|---|---|---|---|---|
| 824 N Madison Ave | 0.00mi | 2/2.0 (-1) | 1,422 (0%) | 1mo | $215,000 | $151 | 94 |
| 720 N Main St | 0.16mi | 3/2.0 | 1,434 (+1%) | 9mo | $162,000 | $113 | 84 |
| 801 N Madison Ave | 0.05mi | 2/2.0 (-1) | 1,475 (+4%) | 10mo | $212,000 | $144 | 79 |
| 321 N Madison Ave | 0.34mi | 3/2.0 | 1,276 (-10%) | 2mo | $218,000 | $171 | 65 |
| 1605 Silver Oak Dr | 0.57mi | 3/3.0 | 1,393 (-2%) | 3mo | $235,000 | $169 | 63 |
| 301 Cherokee Ct | 0.38mi | 3/2.0 | 1,309 (-8%) | 8mo | $210,000 | $160 | 62 |
| 603 N Madison Ave | 0.18mi | 3/1.0 | 1,570 (+10%) | 11mo | $199,000 | $127 | 61 |
| 314 Cherokee Ct | 0.35mi | 3/2.0 | 1,504 (+6%) | 20mo | $245,000 | $163 | 57 |
| 1621 Silver Oak Dr | 0.63mi | 3/2.0 | 1,552 (+9%) | 4mo | $245,000 | $158 | 52 |
| 521 N Harrison Ave | 0.38mi | 3/2.0 | 1,239 (-13%) | 19mo | $193,000 | $156 | 45 |
| 213 S Tyler | 0.74mi | 3/2.0 | 1,350 (-5%) | 22mo | $234,900 | $174 | 39 |
| 2499 Erin Way | 0.75mi | 3/2.0 | 1,295 (-9%) | 22mo | $264,180 | $204 | 32 |
Match score weights: distance 35% · size 25% · config 20% · recency 20%. Top-matched comps best support the ARV.
Projected returns pro-forma
1.45% appreciation · 3.0% rent growth · sell at horizon
- IRR
- 1.9%
- Equity multiple
- 1.10×
- Total profit
- $6,085
- Equity at exit
- $78,425
- IRR
- 6.2%
- Equity multiple
- 1.80×
- Total profit
- $47,974
- Equity at exit
- $108,225
Cash invested: $60,200 (down + closing). Projections, not guarantees.
Landlord ↔ Tenant lean methodology
- Overall (STATE)
- 83 Strongly Landlord-Friendly
- State Oklahoma
- 83 Strongly Landlord-Friendly · R+20
- County
- — inherits STATE
- City
- — inherits STATE
ZIP-level market 73010
- Home prices YoY
- 0.5%
- Active inventory
- 507
- Price-to-rent
- 11.0×
Monthly cashflow live
- Estimated rent
- $1,629 high interval (Pro) →
- Mortgage (P&I)
- −$1,127
- Tax from tax record
- −$111 /mo · $1,329/yr
- Insurance
- −$90
- HOA
- −$0
- Vacancy / Maint / Mgmt
- −$342
- Net cashflow
- $-41
Break-even live
UW: 25.0% down · 7.5% · 30yr · 1.5% tax · 5.0% vac · 8.0% maint · 8.0% mgmt
Financing live
Cash to close
- Down payment
- $53,750
- Closing costs
- $6,450
- Reserves months
- —
- Total cash needed
- —
Loan-product check · same deal, 3 products live
Conventional
25% down · 7.5% · 30yr
- Down + closing
- —
- Monthly P&I
- —
- Monthly cashflow
- —
- DSCR
- —
- Eligible?
- —
Personal DTI + credit; lowest rate.
DSCR
20% down · 8.5% · 30yr
- Down + closing
- —
- Monthly P&I
- —
- Monthly cashflow
- —
- DSCR
- —
- Eligible?
- —
No personal income docs; deal must DSCR.
Hard money
10% down · 12.0% · 12mo
- Down + closing
- —
- Monthly P&I
- —
- Monthly cashflow
- —
- DSCR
- —
- Eligible?
- —
Short-term bridge; refi at stabilization.
Rent comps 6 comps
| Address | Beds | Baths | Sqft | Rent | $/sqft | DOM | Units | Dist |
|---|---|---|---|---|---|---|---|---|
| 720 N Main Blanchard, OK | 3.0 | 2.0 | 1434 | $1,650 | $1.15 | 2d | 1 | 0.20mi |
| 300 Point Pleasant Ct Blanchard, OK | 2.0–3.0 | 2.0 | 1150 | $1,264 | $1.10 | 1d | 2 | 0.27mi |
| 509 Harris Blanchard, OK | 2.0 | 1.0 | 1000 | $895 | $0.90 | 1d | 1 | 0.43mi |
| 2449 Heather Rd Blanchard, OK | 3.0 | 2.0 | 1385 | $1,750 | $1.26 | 10d | 1 | 0.99mi |
| 2449 Heather Rd Blanchard, OK | 3.0 | 2.0 | 1385 | $1,750 | $1.26 | 1d | 1 | 0.99mi |
| 490 Elena Dr Blanchard, OK | 3.0 | 2.0 | 1652 | $1,995 | $1.21 | 1d | 1 | 1.01mi |
Listing history 3 events
-
2026-04-22status Pending
-
2026-04-16$215,000 Active
-
2013-08-05soldstatus $110,000
ⓘ Source: listings_history table (triggers on properties + properties_extension) + one-shot
backfill from property_details.listing_events for pre-trigger history.
Tax reassessment forecast OK · Resets to sale price
- Current annual tax
- $1,329 · $111/mo
- Projected year-2 tax
- $1,935 · $161/mo
- Expected delta
- +$606/yr (+$50/mo · 45.6%)
ⓘ Screening estimate from a state-policy table — verify with the county assessor before closing.
Climate risk First Street
- Flood 1/10 Low FEMA zone X (unshaded) · 0% chance over 30 yrs
- Wildfire 5/10 Major
- Heat 6/10 Major 7 d/yr ≥108°F today · 19 d/yr by 30 yrs out
- Wind 3/10 Moderate 5% chance of damaging wind over 30 yrs
- Air quality 2/10 Low 1 unhealthy d/yr today · 2 by 30 yrs out
Nearby sold comps map
Loading sold comps map…
Walkable amenities ~0.75 mi
Loading nearby amenities…
Taxation est. · year 1
- Rental income
- $19,552
- − Mortgage interest
- −$12,043
- − Property taxes
- −$1,329
- − Insurance
- −$1,075
- − Repairs & maintenance
- −$1,564
- − Management
- −$1,564
- − Depreciation
- −$6,255
- Taxable loss
- −$4,278
- Est. tax savings @ 24.0%
- +$1,027
- After-tax cash flow
- $539/yr
For passive investors: Depreciation is non-cash, so a rental often shows a tax loss while cash-flowing — sheltering income. Rental losses are passive: they offset passive income freely, and up to $25,000/yr can offset ordinary (W-2) income if you actively participate and your MAGI is under $100k (phasing out to $0 by $150k); unused losses carry forward. On sale, claimed depreciation is recaptured at up to 25%, and gains may owe capital-gains tax (a 1031 exchange can defer both). Figures are a year-1 estimate at your 24.0% rate — not tax advice; consult a CPA.
Schools (NCES district)
- District
- Blanchard
- NCES district ID
- 4004680
- Math proficiency
- 39% ▼ -2.00%
- Reading proficiency
- 41% ▼ -6.00%
- Median HH income
- $61,936
- Composite
- 35.63/100
- National rank
- #4887
- State rank
- #13 of 270 in OK
Livability — Blanchard
- Score
- 69/100
- State rank
- #47
- US rank
- #8299
Category grades
Schools grade is shown separately in the Schools card above.
Census & demographics
- Census place
- Blanchard, OK
- County
- McClain County · 33,206 people
- City population
- 21,521
- Metro
- Oklahoma City, OK
- Population (ZIP)
- 21,521
- Household income
- $90,110
- Rent vs Own
- Severe rent burden
- 239.0
Population outlook (McClain County) Hauer SSP2
- Today (2025)
- 46,053 people
- By 2030
- 50,081 · +8.7%
- By 2040
- 58,231 · +26.4%
- By 2050
- 66,276 · +43.9%
- By 2075
- 86,558 · +88.0%
- By 2100
- 100,421 · +118.1%
Race, ethnicity, and origin ACS 2023
- Neighborhood character
- Predominantly White (81%)
- Race & ethnicity
- White 81% Two or more races 10% Hispanic / Latino 6% Native American 4%
- Hispanic origin (detail)
- Mexican 5%
- Common ancestry
- Italian 2% Lithuanian 2% Slovak 2%
- Foreign-born
- 1% · Canada
- Languages at home
- 97% English-only · Spanish 3%
Political lean MEDSL · McClain
- 2024 margin
- Solid R (+60.6) · D 18.8% · R 79.5% · Other 1.7%
- 2008→2024 swing
- -8.8pp toward R · 2008: -51.8pp · 2024: -60.6pp
- All cycles
- 2024: R+60.6 2020: R+60.9 2016: R+60.9 2012: R+55.4 2008: R+51.8
Not yet ingested
- Civics
- —
Market trends
- HPI YoY
- ▲ 1.45%
- Current HPI
- 285.8653
- Rent YoY
- —
- Metro
- Oklahoma City, OK
- State GDP YoY
- ▲ 1.55%
- F500 in state
- 6
Industry mix (Fortune 500 HQ in OK)
| Industry | F500 HQs | Revenue |
|---|---|---|
| Energy | 3 | $48B |
|
||
Price history
+95.5% since first listed3 events — show timeline
- 2026-04-22 Pending — MLSOK
- 2026-04-16 Listed $215,000 MLSOK
- 2013-08-05 Sold (Public Records) $110,000 Public Records
Property tax history
-0.5%/yrLatest (2025): $1,329 · +3.2% YoY. Source: county tax records.
Cash-flow waterfall
monthlySold comps — $/sqft
last 12 mo · ≤1 miLoading sold comps…