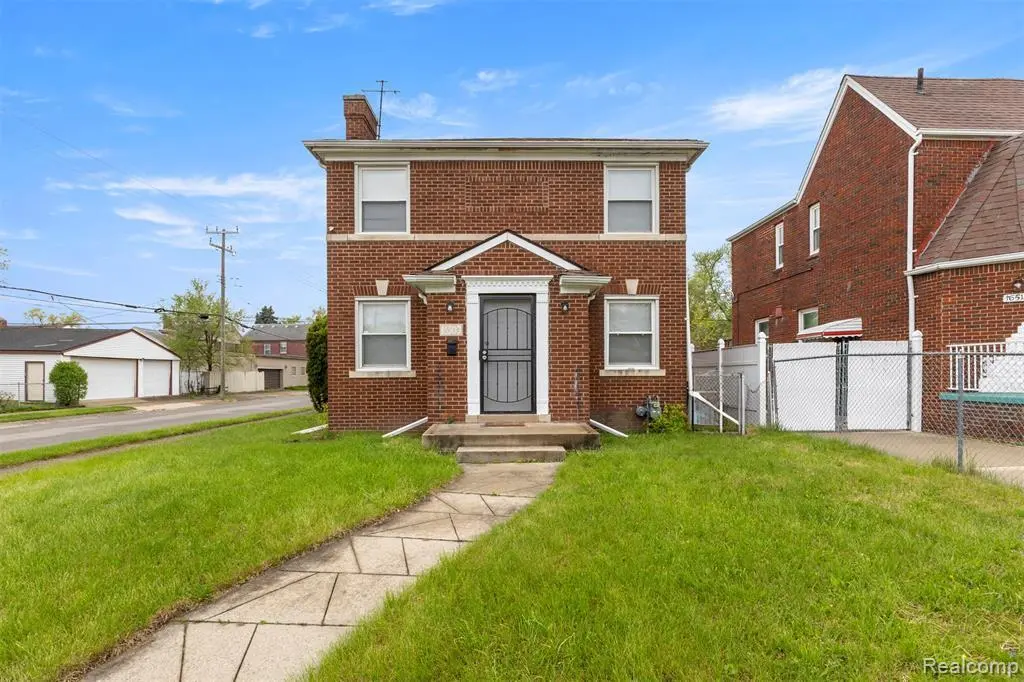
16503 Ilene St · Detroit, MI
Flood risk 1/10 · Minimal
- FEMA flood zone
- X (unshaded)
- Chance of flooding over 30 yrs
- 0.0%
- Est. flood insurance / yr
- $473 – $860
Fire risk 1/10 · Minimal
- Est. fire insurance / yr
- $784 – $1,456
Heat risk 3/10 · Minor
- Hot days now (above 97°F)
- 7 days/yr
- Hot days in 30 yrs
- 15 days/yr
Wind risk 2/10 · Minimal
- Chance of severe wind over 30 yrs
- —
Air-quality risk 3/10 · Minor
- Unhealthy air days now
- 2 days/yr
- Unhealthy air days in 30 yrs
- 5 days/yr
Risk factors via First Street. Map © Google.
Why this score? — see what drove the C grade
The composite is a weighted blend of 9 inputs, each scored 0–100. Each bar is that input's sub-score; the figure is the points it added to the 100-point composite (weight × sub-score).
- Cash flow +21.1/30.0
- ARV discount +11.7/15.0
- DSCR +6.7/10.0
- 1% rule +6.4/10.0
- Livability +3.7/5.0
- Rent growth +3.4/5.0
- Condition / age +2.5/5.0
- Schools +1.3/10.0
- Appreciation +0.0/10.0
$105,000
🖨 Deal sheet 📄 Offer letter ✓ Due diligence
Listing remarks MLS
Welcome home!!! This beautiful and unique brick colonial, located on a corner lot, is move-in ready and ideal for first-time homebuyers or investors looking to expand their portfolio. Conveniently situated in the Fitzgerald/Marygrove neighborhood, the property offers easy access to Puritan Ave and Wyoming Ave, and is just minutes from the John C. Lodge Freeway. The entire home has been updated, featuring fresh paint, new carpet, and new flooring in the dining room and kitchen. The bathroom has been fully renovated with new ceramic tile walls, modern wallpaper, a matching mirror, a new toilet, and a new vanity. The home also includes new light fixtures throughout. The basement features freshly painted walls and durable epoxy flooring. Outside, you'll find a spacious backyard that can be fenced for added privacy, along with a 2-car garage. Schedule your showing today! All measurements are estimated. Property is under surveillance. Land contract terms available: $115,000 purchase price, 10% interest, 60-month term.
Key facts
- Fresh paint
- New carpet
- Updated home
Tags
Property features AI
Exterior
- Parking: Detached 2-car garage
- Utilities: Public water; Public sewer; Water available
- Home design: Single-family residence; Two levels; Above-grade finished area approximately 1,048 square feet
- Construction: Brick construction; Block foundation
- Exterior features: Paved road access; Lot dimensions approximately 40 x 108 (0.1 acre); Ground-level entry with steps
Interior
- Bathrooms: One full bathroom
- Heating & cooling: Forced air heating (natural gas); No central cooling
- Interior features: Unfinished basement; Five total rooms
Neighborhood map
What this means for you Summary
Snapshot
- This is a 2-bed/1.0-bath single-family listed at $105k.
Deal economics
- At list price, monthly cash flow is $149 ($2k/yr) — positive.
- The deal already cash-flows at list — no discount required.
- Meets the 1% rule at list price ($1k rent vs $105k).
- Recommended offer: $103k (1.5% below list) — sets the bar for market timing.
- Cap rate 8.0% vs local median 10.2% in Detroit — below-typical yield; the buyer is paying a premium for something (appreciation thesis, condition, location) that the cap rate doesn't capture.
Location & tenants
- Location reads 73/100 on livability (#218 in MI) — a middle-class / working-renter tenant base. Strengths: amenities A+, commute A+, cost of living A+; Watch: schools F, crime F, employment F.
- Detroit Public Schools Community District (urban): math 10% / reading 24% proficiency, ranked #499 of 540 in MI (top 92%) — low school quality limits family demand, transient renter base, plan for 1-2y turnover; 90% free/reduced lunch — lower-income household profile, screen leases tightly.
- Market conditions: Rents rising (+3.4%/yr); 349 active listings in the ZIP; 40 comparable units currently listed for rent nearby; rentals at typical pace (median 24d on market — plan ~3-4 weeks tenant-placement turnaround); 2,639 units permitted in Wayne County in 2024 (1,216 in 5+ unit buildings).
Forward outlook
- Local home prices are declining (-3.0%/yr); year-one equity from $726 of loan paydown is wiped out by about $3k of value loss. Plan a longer hold.
- Wayne County population projected at -17% by 2050 — secular population decline; favor cash flow + early exit over multi-decade hold.
Negotiation context
- It's been on market 28 days — a 2% lower offer ($103k) is reasonable based on typical stale-listing flexibility.
- 17 sale attempts since 24y ago with the ask held roughly flat each time — persistent listings suggest the price (not the market) is what's stuck; bring a comps-based counter.
Risks & watch-outs
- Watch-outs: built in 1938 — expect roof / HVAC / electrical / plumbing capex.
Questions for the listing agent
- Built in 1938 — when were the roof, HVAC, electrical panel, plumbing, and water heater last replaced?
- Is there a deadline driving the sale (1031 exchange, divorce, estate, relocation)? That informs how much negotiation room exists.
- Schools are F-rated, which usually means shorter tenancies and higher turnover. Who's the typical renter profile here, and what's been the actual vacancy rate?
- Crime grade is F in this area — have there been break-ins, vandalism, or insurance claims at this property in the last 3 years? What carrier currently insures it and at what premium?
- What's the average days-on-market for RENTAL listings here right now (not sales)? A rising rental-DOM trend means longer vacancies and softer asking-rent achievability than the comps imply.
- What's the recent tenant-quality profile in this submarket — average credit score on applications, eviction rate, late-payment / NSF rate, and stable-employment percentage? A property-management company in the area should have these aggregated.
- How much new for-sale + rental construction is in the pipeline within 1–3 miles? Heavy new supply typically softens prices + rents 12–24 months out; constrained supply supports both.
Investment metrics
- 1% rule
- 1.14% ✓
- Cap rate
- 8.00%
- Cash-on-cash
- 6.09%
- DSCR
- 1.27
- GRM
- 7.3
CMA / ARV
- ARV (median comp)
- $115,820
- List price
- $105,000
- Delta
- -9.34%
- Verdict
- FAIR
- Comps
- 20 within 1.0 mi
Show comp detail 12 sales within ~0.75 mi
| Address | Dist | Beds/Ba | Sqft | Sold | Price | $/sf | Match |
|---|---|---|---|---|---|---|---|
| 16503 Ilene St | 0.00mi | 2/1.0 | 1,048 (0%) | 0mo | $115,000 | $110 | 100 |
| 15775 Indiana St | 0.41mi | 3/1.5 (+1) | 967 (-8%) | 1mo | $45,000 | $47 | 60 |
| 15756 Meyers Rd | 0.51mi | 2/1.0 | 946 (-10%) | 4mo | $65,000 | $69 | 57 |
| 15754 Meyers Rd | 0.51mi | 2/1.0 | 946 (-10%) | 4mo | $65,000 | $69 | 57 |
| 18000 Ilene St | 0.70mi | 3/2.0 (+1) | 1,057 (+1%) | 2mo | $135,000 | $128 | 55 |
| 17147 Appoline St | 0.58mi | 3/2.0 (+1) | 1,100 (+5%) | 1mo | $170,000 | $155 | 54 |
| 16191 Sorrento St | 0.56mi | 2/1.0 | 1,141 (+9%) | 7mo | $38,500 | $34 | 54 |
| 16230 Cheyenne St | 0.64mi | 3/1.0 (+1) | 1,000 (-5%) | 6mo | $135,000 | $135 | 52 |
| 15732 Manor St | 0.50mi | 3/1.0 (+1) | 930 (-11%) | 3mo | $50,000 | $54 | 50 |
| 17365 Meyers Rd | 0.65mi | 2/1.0 | 942 (-10%) | 4mo | $49,000 | $52 | 50 |
| 16665 Tuller St | 0.75mi | 3/1.0 (+1) | 960 (-8%) | 1mo | $25,000 | $26 | 45 |
| 15428 Appoline St | 0.66mi | 3/1.0 (+1) | 1,175 (+12%) | 7mo | $114,000 | $97 | 38 |
Match score weights: distance 35% · size 25% · config 20% · recency 20%. Top-matched comps best support the ARV.
Projected returns pro-forma
-3.0% appreciation · 3.44% rent growth · sell at horizon
- IRR
- -6.3%
- Equity multiple
- 0.76×
- Total profit
- $-6,912
- Equity at exit
- $15,656
- IRR
- 4.0%
- Equity multiple
- 1.30×
- Total profit
- $8,673
- Equity at exit
- $9,078
Cash invested: $29,400 (down + closing). Projections, not guarantees.
Landlord ↔ Tenant lean methodology
- Overall (STATE)
- 62 Landlord-Friendly
- State Michigan
- 62 Landlord-Friendly · EVEN
- County
- — inherits STATE
- City
- — inherits STATE
ZIP-level market 48221
- Rents YoY
- 3.4%
- Active inventory
- 349
- Price-to-rent
- 7.3×
Monthly cashflow live
- Estimated rent
- $1,195 high interval (Pro) →
- Mortgage (P&I)
- −$551
- Tax from tax record
- −$201 /mo · $2,407/yr
- Insurance
- −$44
- HOA
- −$0
- Vacancy / Maint / Mgmt
- −$251
- Net cashflow
- $149
Break-even live
UW: 25.0% down · 7.5% · 30yr · 1.5% tax · 5.0% vac · 8.0% maint · 8.0% mgmt
Financing live
Cash to close
- Down payment
- $26,250
- Closing costs
- $3,150
- Reserves months
- —
- Total cash needed
- —
Loan-product check · same deal, 3 products live
Conventional
25% down · 7.5% · 30yr
- Down + closing
- —
- Monthly P&I
- —
- Monthly cashflow
- —
- DSCR
- —
- Eligible?
- —
Personal DTI + credit; lowest rate.
DSCR
20% down · 8.5% · 30yr
- Down + closing
- —
- Monthly P&I
- —
- Monthly cashflow
- —
- DSCR
- —
- Eligible?
- —
No personal income docs; deal must DSCR.
Hard money
10% down · 12.0% · 12mo
- Down + closing
- —
- Monthly P&I
- —
- Monthly cashflow
- —
- DSCR
- —
- Eligible?
- —
Short-term bridge; refi at stabilization.
Rent comps 40 comps
| Address | Beds | Baths | Sqft | Rent | $/sqft | DOM | Units | Dist |
|---|---|---|---|---|---|---|---|---|
| 16230 Indiana St Unit 2 Detroit, MI | 2.0 | 1.0 | 1050 | $1,200 | $1.14 | 17d | 1 | 0.22mi |
| 16889 Washburn St Detroit, MI | 3.0 | 1.5 | 1300 | $1,100 | $0.85 | 17d | 1 | 0.26mi |
| 16183 Wisconsin St Detroit, MI | 3.0 | 1.5 | 1370 | $1,400 | $1.02 | 43d | 1 | 0.26mi |
| 15878 Kentucky St Detroit, MI | 2.0 | 1.0 | 800 | $900 | $1.12 | 43d | 1 | 0.27mi |
| 15839 Kentucky St Detroit, MI | 2.0 | 1.0 | 800 | $1,200 | $1.50 | 17d | 1 | 0.28mi |
| 15765 Washburn St Detroit, MI | 2.0 | 1.0 | 1093 | $950 | $0.87 | 43d | 1 | 0.35mi |
| 15777 Wisconsin St Unit 77 Detroit, MI | 2.0 | 1.0 | 900 | $950 | $1.06 | 5d | 1 | 0.41mi |
| 15708 Birwood St Detroit, MI | 3.0 | 1.0 | 1255 | $1,100 | $0.88 | 5d | 1 | 0.42mi |
| 15760 Monte Vista St Detroit, MI | 2.0 | 1.0 | 1080 | $1,250 | $1.16 | 43d | 1 | 0.44mi |
| 15512 Mendota St Detroit, MI | 2.0 | 1.0 | 931 | $1,200 | $1.29 | 5d | 1 | 0.45mi |
| 15512 Mendota St Apt 2 Detroit, MI | 2.0 | 1.0 | 1000 | $1,200 | $1.20 | 43d | 1 | 0.45mi |
| 16204 Steel St Detroit, MI | 3.0 | 1.0 | 969 | $1,150 | $1.19 | 43d | 1 | 0.50mi |
| 17150 Meyers Rd Detroit, MI | 1.0–2.0 | 1.0 | 775 | $975 | $1.26 | 43d | 2 | 0.52mi |
| 17159 Northlawn St Unit 17161 Detroit, MI | 2.0 | 1.0 | 1122 | $975 | $0.87 | 5d | 1 | 0.58mi |
| 17195 Northlawn St #2 Detroit, MI | 2.0 | 1.0 | 1200 | $1,050 | $0.88 | 24d | 1 | 0.61mi |
| 17195 Northlawn St #1 Detroit, MI | 2.0 | 1.0 | 1200 | $1,100 | $0.92 | 20d | 1 | 0.61mi |
| 16503 Ward Ave Unit 2 Detroit, MI | 2.0 | 1.0 | 700 | $850 | $1.21 | 43d | 1 | 0.64mi |
| 15738 Sorrento Ave Detroit, MI | 3.0 | 1.0 | 762 | $1,175 | $1.54 | 43d | 1 | 0.66mi |
| 15457 Cloverlawn St Detroit, MI | 3.0 | 2.0 | 1500 | $1,275 | $0.85 | 24d | 1 | 0.66mi |
| 17540 Pinehurst St Detroit, MI | 3.0 | 1.0 | 1200 | $1,395 | $1.16 | 43d | 1 | 0.67mi |
| 15388 Appoline St #203 Detroit, MI | 2.0 | 1.0 | 900 | $850 | $0.94 | 43d | 1 | 0.70mi |
| 15771 Turner St Detroit, MI | 2.0 | 1.0 | 1000 | $1,049 | $1.05 | 43d | 1 | 0.75mi |
| 16255 Lilac St Detroit, MI | 3.0 | 1.0 | 1312 | $1,394 | $1.06 | 17d | 1 | 0.76mi |
| 16722 Tuller St Detroit, MI | 3.0 | 1.5 | 1100 | $1,500 | $1.36 | 16d | 1 | 0.76mi |
| 17368 Woodingham Dr Detroit, MI | 3.0 | 1.5 | 1200 | $1,800 | $1.50 | 43d | 1 | 0.83mi |
| 14881 Mendota St Detroit, MI | 3.0 | 1.0 | 1026 | $1,100 | $1.07 | 24d | 1 | 0.91mi |
| 17163 Prairie St Unit 1B Detroit, MI | 3.0 | 1.5 | 1317 | $1,350 | $1.03 | 43d | 1 | 0.94mi |
| 7350 Globe St Detroit, MI | 3.0 | 1.0 | 1000 | $1,550 | $1.55 | 3d | 1 | 0.95mi |
| 17147 Monica St Unit 2 1 Detroit, MI | 2.0 | 1.0 | 900 | $975 | $1.08 | 24d | 1 | 0.99mi |
| 16582 Santa Rosa Dr Detroit, MI | 3.0 | 1.0 | 1314 | $1,399 | $1.06 | 17d | 1 | 1.00mi |
| 15088 Littlefield St Detroit, MI | 2.0 | 1.0 | 1294 | $1,275 | $0.99 | 21d | 1 | 1.02mi |
| 15340 Hartwell St Detroit, MI | 2.0 | 1.0 | 900 | $1,300 | $1.44 | 16d | 1 | 1.03mi |
| 17145 Santa Rosa Dr Unit 1 Detroit, MI | 3.0 | 1.0 | 1050 | $1,400 | $1.33 | 17d | 1 | 1.04mi |
| 17150 Santa Rosa Dr Detroit, MI | 1.0 | 1.0 | 950 | $1,250 | $1.32 | 17d | 1 | 1.07mi |
| 16505 Stansbury St Detroit, MI | 3.0 | 1.0 | 1100 | $1,250 | $1.14 | 11d | 1 | 1.07mi |
| 15517 Lesure St Unit BDRM1A Detroit, MI | 2.0 | 1.0 | 1000 | $850 | $0.85 | 24d | 1 | 1.10mi |
| 14656 Roselawn St Detroit, MI | 3.0 | 1.0 | 1000 | $1,200 | $1.20 | 17d | 1 | 1.15mi |
| 14570 Cherrylawn St Detroit, MI | 3.0 | 1.0 | 840 | $1,250 | $1.49 | 12d | 1 | 1.15mi |
| 17551 Santa Rosa Dr Detroit, MI | 2.0 | 1.0 | 1036 | $1,095 | $1.06 | 43d | 1 | 1.15mi |
| 15387 Lesure St Detroit, MI | 3.0 | 1.0 | 1064 | $1,350 | $1.27 | 12d | 1 | 1.16mi |
Listing history 40 events
-
2026-05-01$105,000 Active 1033-char remark
Show marketing remark (1027 chars)
Welcome home!!! This beautiful and unique brick colonial, located on a corner lot, is move-in ready and ideal for first-time homebuyers or investors looking to expand their portfolio. Conveniently situated in the Fitzgerald/Marygrove neighborhood, the property offers easy access to Puritan Ave and Wyoming Ave, and is just minutes from the John C. Lodge Freeway. The entire home has been updated, featuring fresh paint, new carpet, and new flooring in the dining room and kitchen. The bathroom has been fully renovated with new ceramic tile walls, modern wallpaper, a matching mirror, a new toilet, and a new vanity. The home also includes new light fixtures throughout. The basement features freshly painted walls and durable epoxy flooring. Outside, you'll find a spacious backyard that can be fenced for added privacy, along with a 2-car garage. Schedule your showing today! All measurements are estimated. Property is under surveillance. Land contract terms available: $115,000 purchase price, 10% interest, 60-month term.
-
2026-05-01$105,000 Active 1027-char remark
Show marketing remark (1027 chars)
Welcome home!!! This beautiful and unique brick colonial, located on a corner lot, is move-in ready and ideal for first-time homebuyers or investors looking to expand their portfolio. Conveniently situated in the Fitzgerald/Marygrove neighborhood, the property offers easy access to Puritan Ave and Wyoming Ave, and is just minutes from the John C. Lodge Freeway. The entire home has been updated, featuring fresh paint, new carpet, and new flooring in the dining room and kitchen. The bathroom has been fully renovated with new ceramic tile walls, modern wallpaper, a matching mirror, a new toilet, and a new vanity. The home also includes new light fixtures throughout. The basement features freshly painted walls and durable epoxy flooring. Outside, you'll find a spacious backyard that can be fenced for added privacy, along with a 2-car garage. Schedule your showing today! All measurements are estimated. Property is under surveillance. Land contract terms available: $115,000 purchase price, 10% interest, 60-month term.
-
2025-12-01historical
-
2025-12-01historical
-
2025-10-30$100,000 Active
-
2025-10-30$100,000 Active
-
2025-10-29historical
-
2025-10-29historical
-
2025-08-12$105,000 Active
-
2025-08-12$105,000 Active
-
2025-06-03historical
-
2025-06-03historical
-
2025-05-13price $110,000
-
2025-05-13price $110,000
-
2025-03-10$115,000 Active
-
2025-03-10$115,000 Active
-
2017-10-24soldstatus $20,000 Sold
-
2017-10-24soldstatus $20,000 Closed
-
2017-09-08status Pending
-
2017-09-08status Pending
-
2017-09-06$20,000 Active
-
2017-09-06$20,000 Active
-
2016-09-06historical
-
2016-09-06historical
-
2016-09-01$30,000 Active
-
2016-09-01$30,000 Active
-
2012-01-20soldstatus $5,000
-
2012-01-20soldstatus $5,000
-
2012-01-05historical
-
2011-11-30$5,000
-
2011-11-30$5,000
-
2011-10-11$750
-
2004-12-15soldstatus $47,900
-
2004-09-14$47,900
-
2003-01-16soldstatus $37,500
-
2002-11-15historical
-
2002-11-05$39,900
-
2001-11-21soldstatus $70,757
-
2000-10-26soldstatus $80,000
-
2000-08-11soldstatus $35,000
ⓘ Source: listings_history table (triggers on properties + properties_extension) + one-shot
backfill from property_details.listing_events for pre-trigger history.
Tax reassessment forecast MI · Partial reset (capped growth)
- Current annual tax
- $2,407 · $201/mo
- Projected year-2 tax
- $2,407 · $201/mo
- Expected delta
- $0/yr ($0/mo · 0.0%)
ⓘ Screening estimate from a state-policy table — verify with the county assessor before closing.
Climate risk First Street
- Flood 1/10 Low FEMA zone X (unshaded) · 0% chance over 30 yrs
- Wildfire 1/10 Low
- Heat 3/10 Moderate 7 d/yr ≥97°F today · 15 d/yr by 30 yrs out
- Wind 2/10 Low
- Air quality 3/10 Moderate 2 unhealthy d/yr today · 5 by 30 yrs out
Nearby sold comps map
Loading sold comps map…
Walkable amenities ~0.75 mi
Loading nearby amenities…
Taxation est. · year 1
- Rental income
- $14,343
- − Mortgage interest
- −$5,882
- − Property taxes
- −$2,407
- − Insurance
- −$525
- − Repairs & maintenance
- −$1,147
- − Management
- −$1,147
- − Depreciation
- −$3,055
- Taxable income
- $180
- Est. tax owed @ 24.0%
- −$43
- After-tax cash flow
- $1,749/yr
For passive investors: Depreciation is non-cash, so a rental often shows a tax loss while cash-flowing — sheltering income. Rental losses are passive: they offset passive income freely, and up to $25,000/yr can offset ordinary (W-2) income if you actively participate and your MAGI is under $100k (phasing out to $0 by $150k); unused losses carry forward. On sale, claimed depreciation is recaptured at up to 25%, and gains may owe capital-gains tax (a 1031 exchange can defer both). Figures are a year-1 estimate at your 24.0% rate — not tax advice; consult a CPA.
Schools (NCES district)
- District
- Detroit Public Schools Community District
- NCES district ID
- 2601103
- Math proficiency
- 10% ▼ -2.00%
- Reading proficiency
- 24% ▲ 6.00%
- Median HH income
- $25,815
- Composite
- 13.06/100
- National rank
- #9564
- State rank
- #499 of 540 in MI
Livability — Detroit
- Score
- 73/100
- State rank
- #218
- US rank
- #5427
Category grades
Schools grade is shown separately in the Schools card above.
Census & demographics
- Census place
- Detroit, MI
- County
- Wayne County · 1,562,939 people
- City population
- 572,865
- Metro
- Detroit-Warren-Dearborn, MI
- Population (ZIP)
- 41,392
- Household income
- $57,878
- Rent vs Own
- Severe rent burden
- 1646.0
Population outlook (Wayne County) Hauer SSP2
- Today (2025)
- 1,675,273 people
- By 2030
- 1,620,300 · -3.3%
- By 2040
- 1,502,341 · -10.3%
- By 2050
- 1,384,039 · -17.4%
- By 2075
- 1,124,592 · -32.9%
- By 2100
- 881,193 · -47.4%
Race, ethnicity, and origin ACS 2023
- Neighborhood character
- Predominantly Black (85%)
- Race & ethnicity
- Black 85% White 8% Two or more races 4% Asian 1%
- Common ancestry
- Romanian 1% Lithuanian 1%
- Foreign-born
- 2% · Canada
- Languages at home
- 97% English-only · Spanish 1% Other Indo-European 1%
Political lean MEDSL · Wayne
- 2024 margin
- Strong D (+29.0) · D 62.7% · R 33.7% · Other 3.6%
- 2008→2024 swing
- -20.5pp toward R · 2008: 49.5pp · 2024: 29.0pp
- All cycles
- 2024: D+29.0 2020: D+38.1 2016: D+37.3 2012: D+46.9 2008: D+49.5
Not yet ingested
- Civics
- —
Market trends
- HPI YoY
- ▼ -433.14%
- Current HPI
- 280.5434
- Rent YoY
- ▲ 3.44%
- Metro
- Detroit-Warren-Dearborn, MI
- State GDP YoY
- ▲ 1.37%
- F500 in state
- 28
Industry mix (Fortune 500 HQ in MI)
| Industry | F500 HQs | Revenue |
|---|---|---|
| Automotive Parts | 3 | $48B |
|
||
| Automotive | 2 | $372B |
|
||
| Chemicals | 1 | $45B |
|
||
| Automotive Retail | 1 | $29B |
|
||
| Healthcare / Medical Devices | 1 | $23B |
|
||
| Automotive Technology | 1 | $20B |
|
||
Price history
+228.6% since first listed44 events — show timeline
- 2026-06-04 Sold (MLS) $115,000 REALCOMP
- 2026-06-04 Sold (MLS) $115,000 MiRealSource-MiMLS
- 2026-05-29 Pending — MiRealSource-MiMLS
- 2026-05-29 Pending — REALCOMP
- 2026-05-01 Listed $105,000 REALCOMP
- 2026-05-01 Listed $105,000 MiRealSource-MiMLS
- 2025-12-01 Listing Removed — MiRealSource-MiMLS
- 2025-12-01 Listing Removed — REALCOMP
- 2025-10-30 Listed $100,000 MiRealSource-MiMLS
- 2025-10-30 Listed $100,000 REALCOMP
- 2025-10-29 Listing Removed — MiRealSource-MiMLS
- 2025-10-29 Listing Removed — REALCOMP
- 2025-08-12 Listed $105,000 MiRealSource-MiMLS
- 2025-08-12 Listed $105,000 REALCOMP
- 2025-06-03 Listing Removed — REALCOMP
- 2025-06-03 Listing Removed — MiRealSource-MiMLS
- 2025-05-13 Price Changed $110,000 MiRealSource-MiMLS
- 2025-05-13 Price Changed $110,000 REALCOMP
- 2025-03-10 Listed $115,000 MiRealSource-MiMLS
- 2025-03-10 Listed $115,000 REALCOMP
- 2017-10-24 Sold (MLS) $20,000 MiRealSource-MiMLS
- 2017-10-24 Sold (MLS) $20,000 REALCOMP
- 2017-09-08 Pending — MiRealSource-MiMLS
- 2017-09-08 Pending — REALCOMP
- 2017-09-06 Listed $20,000 MiRealSource-MiMLS
- 2017-09-06 Listed $20,000 REALCOMP
- 2016-09-06 Listing Removed — REALCOMP
- 2016-09-06 Listing Removed — MiRealSource-MiMLS
- 2016-09-01 Listed $30,000 MiRealSource-MiMLS
- 2016-09-01 Listed $30,000 REALCOMP
- 2012-01-20 Sold (MLS) $5,000 REALCOMP
- 2012-01-20 Sold (MLS) $5,000 MiRealSource-MiMLS
- 2012-01-05 Listing Removed — MiRealSource-MiMLS
- 2011-11-30 Listed $5,000 REALCOMP
- 2011-11-30 Listed $5,000 MiRealSource-MiMLS
- 2011-10-11 Listed $750 MiRealSource-MiMLS
- 2004-12-15 Sold (MLS) $47,900 REALCOMP
- 2004-09-14 Listed $47,900 REALCOMP
- 2003-01-16 Sold (MLS) $37,500 MiRealSource-MiMLS
- 2002-11-15 Listing Removed — MiRealSource-MiMLS
- 2002-11-05 Listed $39,900 MiRealSource-MiMLS
- 2001-11-21 Sold (Public Records) $70,757 Public Records
- 2000-10-26 Sold (Public Records) $80,000 Public Records
- 2000-08-11 Sold (Public Records) $35,000 Public Records
Property tax history
+4.6%/yrLatest (2025): $2,407 · -0.2% YoY. Source: county tax records.
Cash-flow waterfall
monthlySold comps — $/sqft
last 12 mo · ≤1 miLoading sold comps…