 🌊 Lakefront
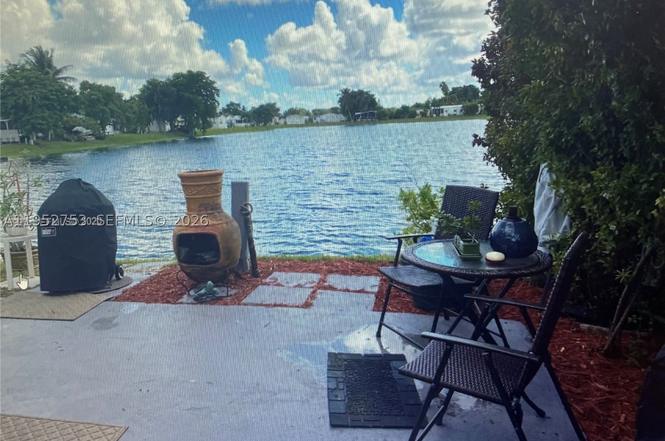
35250 SW 177 Ct. #26 · Florida City, FL
Flood risk 6/10 · Moderate
- FEMA flood zone
- AH
- Chance of flooding over 30 yrs
- 0.54%
- Est. flood insurance / yr
- $1,142 – $2,507
Fire risk 2/10 · Minimal
- Est. fire insurance / yr
- $947 – $1,759
Heat risk 10/10 · Severe
- Hot days now (above 108°F)
- 8 days/yr
- Hot days in 30 yrs
- 35 days/yr
Wind risk 10/10 · Severe
- Chance of severe wind over 30 yrs
- 99.0%
Air-quality risk 2/10 · Minimal
- Unhealthy air days now
- 1 days/yr
- Unhealthy air days in 30 yrs
- 1 days/yr
Risk factors via First Street. Map © Google.
Why this score? — see what drove the C+ grade
The composite is a weighted blend of 9 inputs, each scored 0–100. Each bar is that input's sub-score; the figure is the points it added to the 100-point composite (weight × sub-score).
- Cash flow +27.0/30.0
- DSCR +9.4/10.0
- ARV discount +7.5/15.0
- 1% rule +6.8/10.0
- Schools +4.2/10.0
- Livability +3.2/5.0
- Condition / age +2.5/5.0
- Rent growth +1.8/5.0
- Appreciation +0.0/10.0
$225,000
🖨 Deal sheet 📄 Offer letter ✓ Due diligence
Listing remarks
Back on the Market, Turn Key Gem, 30 minutes from the Florida Keys, 4,325 sq ft lot with waterfront! This 1993 double-wide mobile home in the sought-after Gateway Estates community is ready for a new owner. The house has been well-maintained by the current owners. It offers a 3/2 layout with comfortable rooms, bathrooms, and a great room, as well as a magnificent lakefront view and an enclosed sunroom, all within a gated community with easy access to the Florida Keys and Miami. low HOA fees, and you own the land. Sellers motivated.
Key facts
- Gated community
- Enclosed sunroom
- Lakefront view
Tags
Property features AI
Finance
- Other: Community pool
- HOA & community: Monthly association fee of $150; Community clubhouse; Gated community amenities
Exterior
- Parking: 2-car garage; Guest parking
- Security: Gated community
- Utilities: Public water; Public sewer
- Home design: Single-story home; Faces southwest; Has a view; Mobile home model: GATEWAY ESTA
- Construction: Aluminum siding; Year built: Unknown
- Exterior features: Fenced yard; Community pool
Interior
- Kitchen: Electric range; Microwave; Refrigerator
- Bedrooms: Includes a third bedroom
- Flooring: Hardwood; Wood
- Bathrooms: 2 full bathrooms
- Heating & cooling: Central air conditioning
- Interior features: First-floor entry; Main-level primary suite; Florida room
Neighborhood map
What this means for you Summary
Snapshot
- This is a 3-bed/2.0-bath condo listed at $225k.
Deal economics
- At list price, monthly cash flow is $480 ($6k/yr) — positive.
- The deal already cash-flows at list — no discount required.
- Meets the 1% rule at list price ($3k rent vs $225k).
- Recommended offer: $205k (9.0% below list) — sets the bar for market timing.
- Cap rate 9.7% vs local median 4.2% in Florida City — top-decile yield for the area; either an underpriced asset or a hidden risk that comps aren't pricing in. Stress-test before assuming the spread holds.
Location & tenants
- Location reads 65/100 on livability (#654 in FL) — a middle-class / working-renter tenant base. Strengths: commute A+, cost of living A+, housing A+; Watch: schools F, crime F, amenities F.
- Miami-Dade (suburban): math 45% / reading 54% proficiency, ranked #40 of 73 in FL (top 55%) — families likely to look elsewhere, expect single-tenant / working-renter base with shorter leases; 64% free/reduced lunch — lower-income household profile, screen leases tightly.
- Market conditions: Rents soft (-2.9%/yr); 612 active listings in the ZIP; 40 comparable units currently listed for rent nearby; rentals at typical pace (median 25d on market — plan ~3-4 weeks tenant-placement turnaround); 10,051 units permitted in Miami-Dade County in 2024 (7,758 in 5+ unit buildings).
- At $2,656/mo this rent would consume 68% of the median local household income ($47k/yr) (locally 1516% of renters already pay >50% of income on rent) — very limited rent-growth headroom before tenants either downsize or default.
Forward outlook
- Local home prices are declining (-3.0%/yr); year-one equity from $2k of loan paydown is wiped out by about $7k of value loss. Plan a longer hold.
- Miami-Dade County population projected at +28% by 2050 — long-run rental-demand tailwind backs the buy-and-hold thesis.
Negotiation context
- It's been on market 118 days — a 9% lower offer ($205k) is reasonable based on typical stale-listing flexibility.
- 3 sale attempts since 6y ago; this cycle's ask has dropped $44k (16%) from the opening price — seller is motivated, your offer sets the floor, not the list.
- Current owner paid $50k; list at $225k implies a 350% gain — meaningful room to come down on a strong offer.
Risks & watch-outs
- Watch-outs: flood insurance adds $152/mo.
- Climate carrying-cost: in FEMA flood zone AH (mandatory federal flood insurance); severe wind risk, 99% chance of damaging wind over 30y; extreme-heat days projected 8→35/yr by 2055 (HVAC capex compounding) — expect insurance premiums to compound above CPI over the hold.
Questions for the listing agent
- It's been on market 118 days. Have you received any prior offers? Is the seller open to a 9% concession, seller financing, or rate buy-down credit?
- What's the actual annual flood-insurance premium (NFIP or private), and is the property in a SFHA with mandatory coverage?
- What does the HOA fee cover, when was the last increase, and are there any pending special assessments or reserve-fund shortfalls?
- Any open or pending special assessments — roof, HVAC, plumbing, elevator, façade? What's the per-unit balance and payoff schedule, and is the seller paying it off at close or rolling it to the buyer?
- Why hasn't it sold? Are there any deal-killer items the seller is aware of (foundation, flood, title, zoning, code violations)?
- Is there a deadline driving the sale (1031 exchange, divorce, estate, relocation)? That informs how much negotiation room exists.
- Schools are F-rated, which usually means shorter tenancies and higher turnover. Who's the typical renter profile here, and what's been the actual vacancy rate?
- Crime grade is F in this area — have there been break-ins, vandalism, or insurance claims at this property in the last 3 years? What carrier currently insures it and at what premium?
- This sits on a lake — are riparian / water-frontage rights deeded with the parcel? Any dock permits, shoreline easements, or HOA water-use restrictions?
- What's the documented flood / surge / shoreline-erosion history here (FEMA AND non-FEMA — e.g., storm surge, creek backup, septic-field saturation)?
- Any water-quality or seasonal algae-bloom issues that affect tenant satisfaction or short-term-rental demand?
- What's the average days-on-market for RENTAL listings here right now (not sales)? A rising rental-DOM trend means longer vacancies and softer asking-rent achievability than the comps imply.
- What's the recent tenant-quality profile in this submarket — average credit score on applications, eviction rate, late-payment / NSF rate, and stable-employment percentage? A property-management company in the area should have these aggregated.
- How much new apartment / multifamily construction is in the pipeline within 1–3 miles? Heavy new supply (>2% of stock underway) typically softens rents 12–24 months out; light construction supports rent growth.
Investment metrics
- 1% rule
- 1.18% ✓
- Cap rate
- 9.66%
- Cash-on-cash
- 12.04%
- DSCR
- 1.54
- GRM
- 7.1
CMA / ARV
No comps found within radius.
Projected returns pro-forma
-3.0% appreciation · 0.0% rent growth · sell at horizon
- IRR
- -6.0%
- Equity multiple
- 0.78×
- Total profit
- $-13,602
- Equity at exit
- $33,548
- IRR
- -0.6%
- Equity multiple
- 0.96×
- Total profit
- $-2,252
- Equity at exit
- $19,454
Cash invested: $63,000 (down + closing). Projections, not guarantees.
Landlord ↔ Tenant lean methodology
- Overall (STATE)
- 87 Strongly Landlord-Friendly
- State Florida
- 87 Strongly Landlord-Friendly · R+3
- County
- — inherits STATE
- City
- — inherits STATE
ZIP-level market 33034
- Home prices YoY
- -5.9%
- Rents YoY
- -2.9%
- Active inventory
- 612
- Price-to-rent
- 7.1×
Monthly cashflow live
- Estimated rent
- $2,656 high interval (Pro) →
- Mortgage (P&I)
- −$1,180
- Tax from tax record
- −$43 /mo · $514/yr
- Insurance
- −$94
- Flood insurance flood zone
- −$152 /mo · $1,824/yr
- HOA
- −$150
- Vacancy / Maint / Mgmt
- −$558
- Net cashflow
- $480
Break-even live
UW: 25.0% down · 7.5% · 30yr · 1.5% tax · 5.0% vac · 8.0% maint · 8.0% mgmt
Financing live
Cash to close
- Down payment
- $56,250
- Closing costs
- $6,750
- Reserves months
- —
- Total cash needed
- —
Loan-product check · same deal, 3 products live
Conventional
25% down · 7.5% · 30yr
- Down + closing
- —
- Monthly P&I
- —
- Monthly cashflow
- —
- DSCR
- —
- Eligible?
- —
Personal DTI + credit; lowest rate.
DSCR
20% down · 8.5% · 30yr
- Down + closing
- —
- Monthly P&I
- —
- Monthly cashflow
- —
- DSCR
- —
- Eligible?
- —
No personal income docs; deal must DSCR.
Hard money
10% down · 12.0% · 12mo
- Down + closing
- —
- Monthly P&I
- —
- Monthly cashflow
- —
- DSCR
- —
- Eligible?
- —
Short-term bridge; refi at stabilization.
Rent comps 40 comps
| Address | Beds | Baths | Sqft | Rent | $/sqft | DOM | Units | Dist |
|---|---|---|---|---|---|---|---|---|
| 175 SW 7th St Florida City, FL | 2.0–3.0 | 2.0 | 945 | $2,225 | $2.35 | 22d | 1 | 0.11mi |
| 82 SW 3rd Ct Florida City, FL | 3.0 | 2.0 | 1275 | $2,950 | $2.31 | 8d | 1 | 0.12mi |
| 82 SW 3rd Ct Florida City, FL | 3.0 | 2.0 | 1275 | $2,950 | $2.31 | 14d | 1 | 0.12mi |
| 582 SW 2nd Pl Homestead, FL | 3.0 | 2.0 | 1276 | $2,500 | $1.96 | 24d | 1 | 0.19mi |
| 35303 SW 180th Ave #391 Homestead, FL | 2.0 | 2.0 | 1170 | $2,150 | $1.84 | 24d | 1 | 0.25mi |
| 17854 SW 358th St Homestead, FL | 3.0 | 2.5 | 1414 | $2,400 | $1.70 | 24d | 1 | 0.39mi |
| 17904 SW 358th St Homestead, FL | 3.0 | 2.5 | 1450 | $1,285 | $0.89 | 5d | 1 | 0.41mi |
| 17920 SW 358th St Unit 17920 Homestead, FL | 3.0 | 2.5 | 1504 | $2,350 | $1.56 | 20d | 1 | 0.42mi |
| 17920 SW 358th St Unit 17920 Homestead, FL | 3.0 | 2.5 | 1504 | $2,350 | $1.56 | 3d | 1 | 0.42mi |
| 17851 SW 359 Ter Unit 17851 Homestead, FL | 3.0 | 2.5 | 1326 | $2,700 | $2.04 | 24d | 1 | 0.45mi |
| 17854 SW 359th Ter Homestead, FL | 3.0 | 2.5 | 1827 | $2,700 | $1.48 | 24d | 1 | 0.47mi |
| 409 SW 1st St Unit 1 Florida City, FL | 4.0 | 3.0 | 1436 | $2,500 | $1.74 | 24d | 1 | 0.52mi |
| 400 SW 1st St Unit 1 Florida City, FL | 4.0 | 3.0 | 1436 | $2,657 | $1.85 | 24d | 1 | 0.53mi |
| 617 SW 11th St Homestead, FL | 3.0 | 2.5 | 1466 | $2,890 | $1.97 | 24d | 1 | 0.53mi |
| 617 SW 11th St Homestead, FL | 3.0 | 2.5 | 1466 | $3,000 | $2.05 | 2d | 1 | 0.53mi |
| 17982 SW 359th Ter Homestead, FL | 3.0 | 2.5 | 1410 | $2,890 | $2.05 | 14d | 1 | 0.53mi |
| 785 SW 6th Pl Unit 1 Homestead, FL | 3.0 | 2.5 | 1600 | $2,200 | $1.38 | 17d | 1 | 0.54mi |
| 825 SW 6th Pl Homestead, FL | 3.0 | 2.5 | 1527 | $2,000 | $1.31 | 24d | 1 | 0.54mi |
| 875 SW 6th Pl Unit TH Homestead, FL | 3.0 | 2.5 | 1527 | $2,250 | $1.47 | 24d | 1 | 0.55mi |
| 681 SW 7th St #681 Florida City, FL | 3.0 | 2.5 | 1600 | $2,300 | $1.44 | 22d | 1 | 0.56mi |
| 840 SW 6th Pl Homestead, FL | 4.0 | 2.5 | 1711 | $2,300 | $1.34 | 24d | 1 | 0.57mi |
| 1156 SW 6th Ct Unit 1156 Florida City, FL | 3.0 | 2.5 | 1466 | $2,450 | $1.67 | 24d | 1 | 0.59mi |
| 639 SW 3rd Ter Homestead, FL | 3.0 | 2.0 | 1175 | $2,850 | $2.43 | 22d | 1 | 0.59mi |
| 687 SW 10th St Homestead, FL | 4.0 | 2.5 | 1799 | $2,200 | $1.22 | 22d | 1 | 0.60mi |
| 721 SW 11th St Homestead, FL | 3.0 | 2.5 | 1466 | $2,400 | $1.64 | 11d | 1 | 0.66mi |
| 721 SW 11th St Homestead, FL | 3.0 | 2.5 | 1466 | $2,400 | $1.64 | 14d | 1 | 0.66mi |
| 768 SW 9th St Homestead, FL | 3.0 | 2.0 | 1099 | $2,250 | $2.05 | 24d | 1 | 0.67mi |
| 322 NE 1st Ave Unit 1 Florida City, FL | 3.0 | 3.0 | 1376 | $1,700 | $1.24 | 24d | 1 | 0.69mi |
| 1161 SW 7th Ct Homestead, FL | 4.0 | 2.5 | 1530 | $3,450 | $2.25 | 24d | 1 | 0.69mi |
| 326 NE 1st Ave Unit 326 Florida City, FL | 3.0 | 3.0 | 1376 | $2,500 | $1.82 | 24d | 1 | 0.69mi |
| 1116 SW 7th Ct Homestead, FL | 3.0 | 2.5 | 1466 | $2,600 | $1.77 | 24d | 1 | 0.70mi |
| 1116 SW 7th Ct Homestead, FL | 3.0 | 2.5 | 1466 | $2,400 | $1.64 | 2d | 1 | 0.70mi |
| 1181 SW 7th Ct Unit 1181 Florida City, FL | 3.0 | 2.5 | 1466 | $2,750 | $1.88 | 24d | 1 | 0.70mi |
| 1170 SW 7th Ct #1170 Florida City, FL | 3.0 | 2.5 | 1466 | $2,500 | $1.71 | 24d | 1 | 0.71mi |
| 408 NE 1st Dr Florida City, FL | 3.0 | 3.0 | 1376 | $2,700 | $1.96 | 17d | 1 | 0.73mi |
| 377 NE 1st Dr Florida City, FL | 3.0 | 2.5 | 1433 | $2,800 | $1.95 | 14d | 1 | 0.74mi |
| 334 NE 1st St Unit 334 Florida City, FL | 3.0 | 2.5 | 1433 | $2,800 | $1.95 | 24d | 1 | 0.75mi |
| 848 SW 10th St Homestead, FL | 3.0 | 2.0 | 1053 | $2,200 | $2.09 | 3d | 1 | 0.75mi |
| 937 SW 8th Pl Homestead, FL | 3.0 | 2.0 | 1065 | $2,100 | $1.97 | 24d | 1 | 0.76mi |
| 377 NE 1st Ave Florida City, FL | 3.0 | 2.5 | 1433 | $2,800 | $1.95 | 13d | 1 | 0.76mi |
HOA detail condo
- Monthly dues
- $150 · $1,800/yr
- Likely covers
- watersecurity
- Assessments
- None detected in remarks — confirm with the listing agent.
Listing history 18 events
-
2026-06-07statusdays on market $225,000 Pending 118 DOM
-
2026-06-04days on market $225,000 Active 117 DOM
-
2026-06-03days on market $225,000 Active 116 DOM
-
2026-06-02days on market $225,000 Active 115 DOM
-
2026-06-01days on market $225,000 Active 114 DOM
-
2026-05-31days on market $225,000 Active 113 DOM
-
2026-05-15status Pending
-
2026-05-06price $229,000
-
2026-04-21price $239,500
-
2026-01-26$269,000 Active
-
2025-11-14historical
-
2025-08-26price $264,000
-
2025-07-09$270,000 Active
-
2020-10-06historical
-
2020-09-25$179,000 Active
-
2008-12-10soldstatus $50,000
-
1993-06-16soldstatus $15,000
-
1976-01-01soldstatus $9,400
ⓘ Source: listings_history table (triggers on properties + properties_extension) + one-shot
backfill from property_details.listing_events for pre-trigger history.
Tax reassessment forecast FL · Resets to sale price
- Current annual tax
- $514 · $43/mo
- Projected year-2 tax
- $1,868 · $156/mo
- Expected delta
- +$1,353/yr (+$113/mo · 263.2%)
ⓘ Screening estimate from a state-policy table — verify with the county assessor before closing.
Climate risk First Street
- Flood 6/10 Major FEMA zone AH · 54% chance over 30 yrs
- Wildfire 2/10 Low
- Heat 10/10 Extreme 8 d/yr ≥108°F today · 35 d/yr by 30 yrs out
- Wind 10/10 Extreme 99% chance of damaging wind over 30 yrs
- Air quality 2/10 Low 1 unhealthy d/yr today · 1 by 30 yrs out
Nearby sold comps map
Loading sold comps map…
Walkable amenities ~0.75 mi
Loading nearby amenities…
Taxation est. · year 1
- Rental income
- $31,875
- − Mortgage interest
- −$12,603
- − Property taxes
- −$514
- − Insurance
- −$2,950
- − Repairs & maintenance
- −$2,550
- − Management
- −$2,550
- − HOA
- −$1,800
- − Depreciation
- −$6,545
- Taxable income
- $2,362
- Est. tax owed @ 24.0%
- −$567
- After-tax cash flow
- $5,191/yr
For passive investors: Depreciation is non-cash, so a rental often shows a tax loss while cash-flowing — sheltering income. Rental losses are passive: they offset passive income freely, and up to $25,000/yr can offset ordinary (W-2) income if you actively participate and your MAGI is under $100k (phasing out to $0 by $150k); unused losses carry forward. On sale, claimed depreciation is recaptured at up to 25%, and gains may owe capital-gains tax (a 1031 exchange can defer both). Figures are a year-1 estimate at your 24.0% rate — not tax advice; consult a CPA.
Schools (NCES district)
- District
- Miami-Dade
- NCES district ID
- 1200390
- Math proficiency
- 45% ▼ -16.00%
- Reading proficiency
- 54% ▼ -5.00%
- Median HH income
- $43,928
- Composite
- 41.76/100
- National rank
- #3397
- State rank
- #40 of 73 in FL
Livability — Florida City
- Score
- 65/100
- State rank
- #654
- US rank
- #13036
Category grades
Schools grade is shown separately in the Schools card above.
Census & demographics
- County
- Miami-Dade County · 2,697,751 people
- City population
- 23,823
- Metro
- Miami-Fort Lauderdale-Pompano Beach, FL
- Population (ZIP)
- 23,823
- Household income
- $47,170
- Rent vs Own
- Severe rent burden
- 1516.0
Population outlook (Miami-Dade County) Hauer SSP2
- Today (2025)
- 3,126,439 people
- By 2030
- 3,325,765 · +6.4%
- By 2040
- 3,697,561 · +18.3%
- By 2050
- 4,012,134 · +28.3%
- By 2075
- 4,605,612 · +47.3%
- By 2100
- 4,866,598 · +55.7%
Race, ethnicity, and origin ACS 2023
- Neighborhood character
- Majority Hispanic (62%)
- Race & ethnicity
- Hispanic / Latino 62% Black 28% Two or more races 24% White 8%
- Hispanic origin (detail)
- Mexican 20% Puerto Rican 5% Cuban 13% Dominican 2%
- Common ancestry
- Hispanic 4%
- Foreign-born
- 34% · Canada, Dominican Republic, Guatemala
- Languages at home
- 38% English-only · Spanish 56% French/Haitian/Cajun 5%
Political lean MEDSL · Miami-Dade
- 2024 margin
- R (+11.4) · D 43.9% · R 55.4%
- 2008→2024 swing
- -27.6pp toward R · 2008: 16.1pp · 2024: -11.4pp
- All cycles
- 2024: R+11.4 2020: D+7.3 2016: D+29.6 2012: D+23.7 2008: D+16.1
Not yet ingested
- Civics
- —
Market trends
- HPI YoY
- ▼ -32.64%
- Current HPI
- 521.6856
- Rent YoY
- ▼ -2.85%
- Metro
- Miami-Fort Lauderdale-Pompano Beach, FL
- State GDP YoY
- ▲ 3.28%
- F500 in state
- 36
Industry mix (Fortune 500 HQ in FL)
| Industry | F500 HQs | Revenue |
|---|---|---|
| Industrial Technology | 2 | $29B |
|
||
| Insurance | 2 | $17B |
|
||
| Retail | 1 | $60B |
|
||
| Technology Distribution | 1 | $58B |
|
||
| Homebuilding | 1 | $35B |
|
||
| Technology Manufacturing | 1 | $35B |
|
||
Price history
+2336.2% since first listed12 events — show timeline
- 2026-05-15 Pending — MARMLS
- 2026-05-06 Price Changed $229,000 MARMLS
- 2026-04-21 Price Changed $239,500 MARMLS
- 2026-01-26 Listed $269,000 MARMLS
- 2025-11-14 Listing Removed — MARMLS
- 2025-08-26 Price Changed $264,000 MARMLS
- 2025-07-09 Listed $270,000 MARMLS
- 2020-10-06 Listing Removed — MARMLS
- 2020-09-25 Listed $179,000 MARMLS
- 2008-12-10 Sold (Public Records) $50,000 Public Records
- 1993-06-16 Sold (Public Records) $15,000 Public Records
- 1976-01-01 Sold (Public Records) $9,400 Public Records
Property tax history
-5.1%/yrLatest (2025): $514 · +2.4% YoY. Source: county tax records.
Cash-flow waterfall
monthlySold comps — $/sqft
last 12 mo · ≤1 miLoading sold comps…