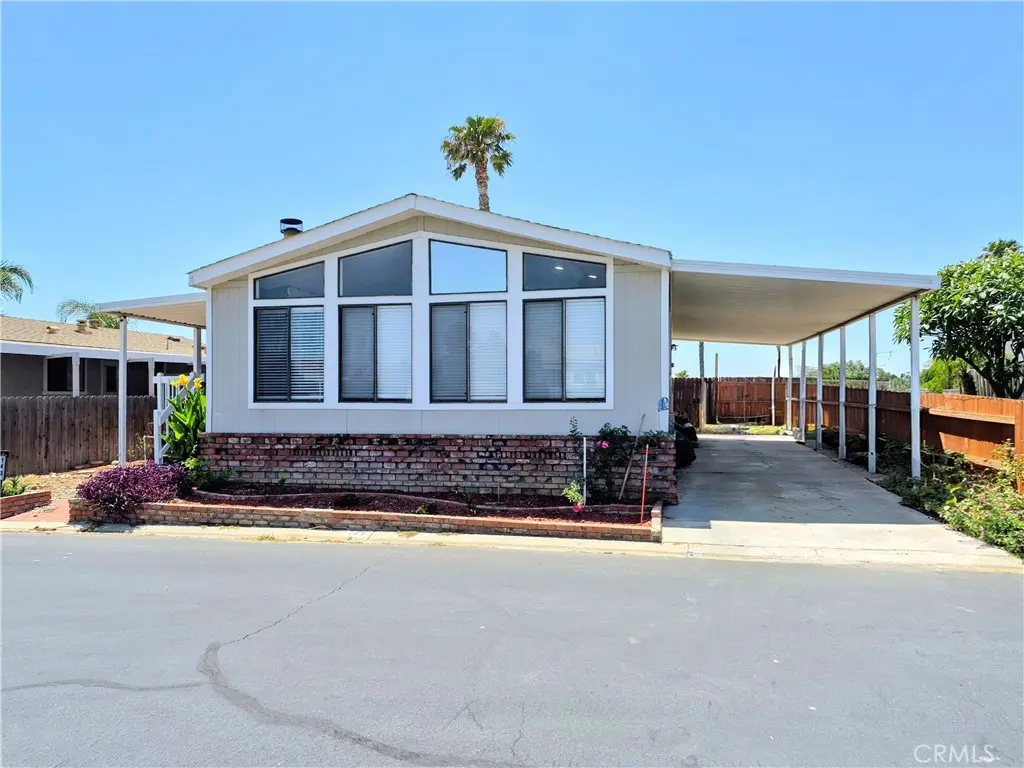
4080 Pedley · Jurupa Valley, CA
Flood risk 1/10 · Minimal
- FEMA flood zone
- X (unshaded)
- Chance of flooding over 30 yrs
- 0.0%
- Est. flood insurance / yr
- $507 – $1,088
Fire risk 8/10 · Major
- Est. fire insurance / yr
- $659 – $1,223
Heat risk 8/10 · Major
- Hot days now (above 103°F)
- 7 days/yr
- Hot days in 30 yrs
- 21 days/yr
Wind risk 1/10 · Minimal
- Chance of severe wind over 30 yrs
- —
Air-quality risk 10/10 · Severe
- Unhealthy air days now
- 28 days/yr
- Unhealthy air days in 30 yrs
- 34 days/yr
Risk factors via First Street. Map © Google.
Why this score? — see what drove the B- grade
The composite is a weighted blend of 9 inputs, each scored 0–100. Each bar is that input's sub-score; the figure is the points it added to the 100-point composite (weight × sub-score).
- Cash flow +30.0/30.0
- DSCR +10.0/10.0
- 1% rule +9.5/10.0
- ARV discount +7.1/15.0
- Schools +3.1/10.0
- Rent growth +2.8/5.0
- Livability +2.5/5.0
- Condition / age +2.5/5.0
- Appreciation +0.0/10.0
$190,000
🖨 Deal sheet 📄 Offer letter ✓ Due diligence
Listing remarks MLS
Priced to sell quickly. Seller needs to pay off balloon payment. Park only allows owner occupancy. Tenants are not permitted. Don't miss out on this opportunity. Excellent location, close to 60 freeway access.
Key facts
- Built in bar
- Open concept
- Bonus room
Tags
Property features AI
Finance
- Other: Living area source: Assessor's data; Located north of Mission Ave and south of the 60 Freeway
- HOA & community: Land lease: $1,800 per month (seller-provided amount)
Exterior
- Parking: Located in Bravo Estates park
- Utilities: Public sewer; District/Public water
- Home design: Single-story property; Mobile home remains on site; Mobile dimensions approximately 34 ft by 60 ft
- Construction: Year built reported by builder
- Exterior features: Community pool; Front yard and back yard; Curbs in the neighborhood
Interior
- Flooring: Laminated flooring
- Bathrooms: 2 full bathrooms
- Heating & cooling: Central heating (furnace); Central cooling
- Interior features: One-level home with front entry; Community spa access
- Laundry & utility: Laundry inside in a dedicated room
Neighborhood map
What this means for you Summary
Snapshot
- This is a 2-bed/2.0-bath manufactured listed at $190k.
Deal economics
- At list price, monthly cash flow is $1k ($12k/yr) — positive.
- The deal already cash-flows at list — no discount required.
- Meets the 1% rule at list price ($3k rent vs $190k).
- Cap rate 12.9% vs local median 2.9% in Jurupa Valley — top-decile yield for the area; either an underpriced asset or a hidden risk that comps aren't pricing in. Stress-test before assuming the spread holds.
Location & tenants
- Location reads 49/100 on livability (#1,170 in CA) — a working-class tenant base; expect higher turnover. Strengths: housing A+, employment A-; Watch: schools F, amenities F, commute F.
- Jurupa Unified (suburban): math 25% / reading 38% proficiency, ranked #953 of 1,400 in CA (top 68%) — families likely to look elsewhere, expect single-tenant / working-renter base with shorter leases; 64% free/reduced lunch — lower-income household profile, screen leases tightly.
- Market conditions: Rents rising (+1.3%/yr); 202 active listings in the ZIP; 2 comparable units currently listed for rent nearby; solid renter incomes; 9,195 units permitted in Riverside County in 2024 (1,512 in 5+ unit buildings).
- This rent runs 35% of the median local income ($95k/yr) — at the standard rent-burdened threshold; future hikes will face affordability resistance.
Forward outlook
- Local home prices are declining (-3.0%/yr); year-one equity from $1k of loan paydown is wiped out by about $6k of value loss. Plan a longer hold.
- Riverside County population projected at +22% by 2050 — long-run rental-demand tailwind backs the buy-and-hold thesis.
- At projected returns (-3.0% appreciation + 1.3% rent growth), your $53k cash investment doubles in ~6 years — after that, you're playing with house money.
Negotiation context
- Only 1 days on market — expect competitive offers; lowballing is unlikely to land.
- 5 sale attempts since 4y ago with the ask held roughly flat each time — persistent listings suggest the price (not the market) is what's stuck; bring a comps-based counter.
- Current owner paid $125k; list at $190k implies a 52% gain — meaningful room to come down on a strong offer.
Risks & watch-outs
- Climate carrying-cost: severe wildfire risk; extreme-heat days projected 7→21/yr by 2055 (HVAC capex compounding) — expect insurance premiums to compound above CPI over the hold.
Questions for the listing agent
- Is there a deadline driving the sale (1031 exchange, divorce, estate, relocation)? That informs how much negotiation room exists.
- Schools are F-rated, which usually means shorter tenancies and higher turnover. Who's the typical renter profile here, and what's been the actual vacancy rate?
- What's the average days-on-market for RENTAL listings here right now (not sales)? A rising rental-DOM trend means longer vacancies and softer asking-rent achievability than the comps imply.
- What's the recent tenant-quality profile in this submarket — average credit score on applications, eviction rate, late-payment / NSF rate, and stable-employment percentage? A property-management company in the area should have these aggregated.
- How much new for-sale + rental construction is in the pipeline within 1–3 miles? Heavy new supply typically softens prices + rents 12–24 months out; constrained supply supports both.
Investment metrics
- 1% rule
- 1.45% ✓
- Cap rate
- 12.86%
- Cash-on-cash
- 23.45%
- DSCR
- 2.04
- GRM
- 5.8
CMA / ARV
- ARV (on-the-fly)
- $188,370
- Comps found
- 12
Show comp detail 12 sales within ~0.75 mi
| Address | Dist | Beds/Ba | Sqft | Sold | Price | $/sf | Match |
|---|---|---|---|---|---|---|---|
| 4080 Pedley Rd Unit 28A | 0.00mi | 2/2.0 | 1,646 (+0%) | 14mo | $166,000 | $101 | 88 |
| 4080 Pedley Rd #182 | 0.00mi | 2/2.0 | 1,664 (+2%) | 14mo | $130,000 | $78 | 86 |
| 4080 Pedley Rd #145 | 0.00mi | 3/2.0 (+1) | 1,440 (-12%) | 7mo | $83,000 | $58 | 69 |
| 4041 Pedley Rd #74 | 0.23mi | 2/2.0 | 1,440 (-12%) | 3mo | $158,000 | $110 | 66 |
| 4080 Pedley Rd #198 | 0.07mi | 3/2.0 (+1) | 1,488 (-9%) | 14mo | $158,000 | $106 | 65 |
| 3700 Quartz Canyon Rd #82 | 0.59mi | 3/2.0 (+1) | 1,568 (-4%) | 6mo | $180,000 | $115 | 55 |
| 4080 Pedley Rd #42 | 0.20mi | 3/2.0 (+1) | 1,440 (-12%) | 15mo | $155,000 | $108 | 53 |
| 3700 Quartz Canyon Rd #123 | 0.59mi | 3/2.0 (+1) | 1,568 (-4%) | 12mo | $199,000 | $127 | 50 |
| 3700-3700 Quartz Cyn #41 | 0.59mi | 3/2.0 (+1) | 1,460 (-11%) | 6mo | $220,000 | $151 | 44 |
| 3700 Quartz Canyon Rd #54 | 0.59mi | 3/2.0 (+1) | 1,456 (-11%) | 14mo | $210,000 | $144 | 37 |
| 3700 Quartz Canyon Rd #24 | 0.59mi | 3/2.0 (+1) | 1,456 (-11%) | 14mo | $190,000 | $130 | 37 |
| 3700 Quartz Canyon Rd #107 | 0.59mi | 3/2.0 (+1) | 1,440 (-12%) | 16mo | $210,000 | $146 | 34 |
Match score weights: distance 35% · size 25% · config 20% · recency 20%. Top-matched comps best support the ARV.
Projected returns pro-forma
-3.0% appreciation · 1.31% rent growth · sell at horizon
- IRR
- 14.7%
- Equity multiple
- 1.58×
- Total profit
- $30,762
- Equity at exit
- $28,330
- IRR
- 22.2%
- Equity multiple
- 2.76×
- Total profit
- $93,524
- Equity at exit
- $16,428
Cash invested: $53,200 (down + closing). Projections, not guarantees.
Landlord ↔ Tenant lean methodology
- Overall (STATE)
- 18 Strongly Tenant-Friendly
- State California
- 18 Strongly Tenant-Friendly · D+13
- County
- — inherits STATE
- City
- — inherits STATE
ZIP-level market 92509
- Rents YoY
- 1.3%
- Active inventory
- 202
- Price-to-rent
- 5.8×
Monthly cashflow live
- Estimated rent
- $2,752 medium interval (Pro) →
- Mortgage (P&I)
- −$996
- Tax from tax record
- −$59 /mo · $707/yr
- Insurance
- −$79
- HOA
- −$0
- Vacancy / Maint / Mgmt
- −$578
- Net cashflow
- $1,040
Break-even live
UW: 25.0% down · 7.5% · 30yr · 1.5% tax · 5.0% vac · 8.0% maint · 8.0% mgmt
Financing live
Cash to close
- Down payment
- $47,500
- Closing costs
- $5,700
- Reserves months
- —
- Total cash needed
- —
Loan-product check · same deal, 3 products live
Conventional
25% down · 7.5% · 30yr
- Down + closing
- —
- Monthly P&I
- —
- Monthly cashflow
- —
- DSCR
- —
- Eligible?
- —
Personal DTI + credit; lowest rate.
DSCR
20% down · 8.5% · 30yr
- Down + closing
- —
- Monthly P&I
- —
- Monthly cashflow
- —
- DSCR
- —
- Eligible?
- —
No personal income docs; deal must DSCR.
Hard money
10% down · 12.0% · 12mo
- Down + closing
- —
- Monthly P&I
- —
- Monthly cashflow
- —
- DSCR
- —
- Eligible?
- —
Short-term bridge; refi at stabilization.
Rent comps 2 comps
| Address | Beds | Baths | Sqft | Rent | $/sqft | DOM | Units | Dist |
|---|---|---|---|---|---|---|---|---|
| 8554 Wild Pony Dr Riverside, CA | 3.0 | 2.0 | 1200 | $3,000 | $2.50 | 43d | 1 | 0.38mi |
| 3892 Kenneth St Jurupa Valley, CA | 3.0 | 2.0 | 1700 | $3,000 | $1.76 | 44d | 1 | 0.67mi |
Listing history 2 events
-
2026-06-09remarks 631-char remark
-
2026-06-09$190,000 Active 1 DOM
ⓘ Source: listings_history table (triggers on properties + properties_extension) + one-shot
backfill from property_details.listing_events for pre-trigger history.
Tax reassessment forecast CA · Resets to sale price
- Current annual tax
- $707 · $59/mo
- Projected year-2 tax
- $1,444 · $120/mo
- Expected delta
- +$737/yr (+$61/mo · 104.3%)
ⓘ Screening estimate from a state-policy table — verify with the county assessor before closing.
Climate risk First Street
- Flood 1/10 Low FEMA zone X (unshaded) · 0% chance over 30 yrs
- Wildfire 8/10 Severe
- Heat 8/10 Severe 7 d/yr ≥103°F today · 21 d/yr by 30 yrs out
- Wind 1/10 Low
- Air quality 10/10 Extreme 28 unhealthy d/yr today · 34 by 30 yrs out
Nearby sold comps map
Loading sold comps map…
Walkable amenities ~0.75 mi
Loading nearby amenities…
Taxation est. · year 1
- Rental income
- $33,026
- − Mortgage interest
- −$10,643
- − Property taxes
- −$707
- − Insurance
- −$950
- − Repairs & maintenance
- −$2,642
- − Management
- −$2,642
- − Depreciation
- −$5,527
- Taxable income
- $9,914
- Est. tax owed @ 24.0%
- −$2,379
- After-tax cash flow
- $10,097/yr
For passive investors: Depreciation is non-cash, so a rental often shows a tax loss while cash-flowing — sheltering income. Rental losses are passive: they offset passive income freely, and up to $25,000/yr can offset ordinary (W-2) income if you actively participate and your MAGI is under $100k (phasing out to $0 by $150k); unused losses carry forward. On sale, claimed depreciation is recaptured at up to 25%, and gains may owe capital-gains tax (a 1031 exchange can defer both). Figures are a year-1 estimate at your 24.0% rate — not tax advice; consult a CPA.
Schools (NCES district)
- District
- Jurupa Unified
- NCES district ID
- 0619260
- Math proficiency
- 25% ▲ 2.00%
- Reading proficiency
- 38% ▲ 2.00%
- Median HH income
- $58,100
- Composite
- 30.97/100
- National rank
- #11327
- State rank
- #953 of 1400 in CA
Livability — Jurupa Valley
- Score
- 49/100
- State rank
- #1170
- US rank
- #25915
Category grades
Schools grade is shown separately in the Schools card above.
Census & demographics
- Census place
- Jurupa Valley, CA
- County
- Riverside County · 2,287,001 people
- City population
- 119,165
- Metro
- Riverside-San Bernardino-Ontario, CA
- Population (ZIP)
- 81,182
- Household income
- $95,355
- Rent vs Own
- Severe rent burden
- 1694.0
Population outlook (Riverside County) Hauer SSP2
- Today (2025)
- 2,664,475 people
- By 2030
- 2,802,692 · +5.2%
- By 2040
- 3,050,904 · +14.5%
- By 2050
- 3,256,783 · +22.2%
- By 2075
- 3,655,058 · +37.2%
- By 2100
- 3,766,594 · +41.4%
Race, ethnicity, and origin ACS 2023
- Neighborhood character
- Predominantly Hispanic (74%)
- Race & ethnicity
- Hispanic / Latino 74% White 17% Two or more races 16% Black 4% Asian 4% Native American 1%
- Hispanic origin (detail)
- Mexican 67%
- Common ancestry
- Lithuanian 1%
- Foreign-born
- 28% · Canada, China, Vietnam
- Languages at home
- 42% English-only · Spanish 54% Other Indo-European 1% Tagalog/Filipino 1%
Political lean MEDSL · Riverside
- 2024 margin
- Toss-up / Even · D 48.0% · R 49.3% · Other 2.6%
- 2008→2024 swing
- -3.6pp toward R · 2008: 2.3pp · 2024: -1.3pp
- All cycles
- 2024: R+1.3 2020: D+8.0 2016: D+4.3 2012: R+0.4 2008: D+2.3
Not yet ingested
- Civics
- —
Market trends
- HPI YoY
- ▼ -374.91%
- Current HPI
- 464.8939
- Rent YoY
- ▲ 1.31%
- Metro
- Riverside-San Bernardino-Ontario, CA
- State GDP YoY
- ▲ 3.21%
- F500 in state
- 116
Industry mix (Fortune 500 HQ in CA)
| Industry | F500 HQs | Revenue |
|---|---|---|
| Technology | 27 | $1,492B |
|
||
| Financial Services | 3 | $174B |
|
||
| Retail | 3 | $44B |
|
||
| Insurance | 3 | $26B |
|
||
| Media / Entertainment | 2 | $115B |
|
||
| Pharmaceuticals / Biotech | 2 | $62B |
|
||
Price history
+58.3% since first listed13 events — show timeline
- 2026-06-08 Listed $190,000 CRMLS
- 2024-11-22 Pending — CRMLS
- 2024-11-22 Relisted — CRMLS
- 2024-11-22 Sold (MLS) $125,000 CRMLS
- 2024-09-18 Listed $120,000 CRMLS
- 2024-09-16 Sold (MLS) $125,000 CRMLS
- 2024-08-31 Listing Removed — CRMLS
- 2024-08-27 Pending — CRMLS
- 2024-08-16 Listed $120,000 CRMLS
- 2022-06-30 Sold (MLS) $130,000 CRMLS
- 2022-05-11 Pending — CRMLS
- 2022-05-10 Price Changed $130,000 CRMLS
- 2022-05-05 Listed $120,000 CRMLS
Property tax history
-4.8%/yrLatest (2025): $707 · +5.4% YoY. Source: county tax records.
Cash-flow waterfall
monthlySold comps — $/sqft
last 12 mo · ≤1 miLoading sold comps…