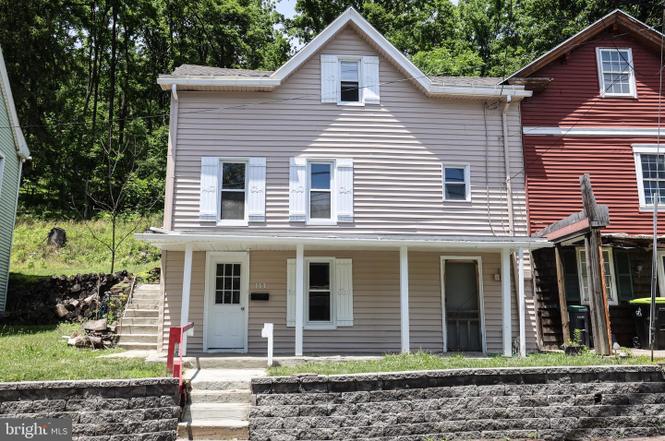
144 Pottsville St · Cressona, PA
Flood risk 1/10 · Minimal
- FEMA flood zone
- X (unshaded)
- Chance of flooding over 30 yrs
- 0.0%
- Est. flood insurance / yr
- $473 – $860
Fire risk 3/10 · Minor
- Est. fire insurance / yr
- $511 – $949
Heat risk 4/10 · Minor
- Hot days now (above 97°F)
- 7 days/yr
- Hot days in 30 yrs
- 16 days/yr
Wind risk 4/10 · Minor
- Chance of severe wind over 30 yrs
- 8.0%
Air-quality risk 2/10 · Minimal
- Unhealthy air days now
- 1 days/yr
- Unhealthy air days in 30 yrs
- 2 days/yr
Risk factors via First Street. Map © Google.
Why this score? — see what drove the B grade
The composite is a weighted blend of 9 inputs, each scored 0–100. Each bar is that input's sub-score; the figure is the points it added to the 100-point composite (weight × sub-score).
- Cash flow +24.5/30.0
- ARV discount +11.8/15.0
- Appreciation +10.0/10.0
- DSCR +7.9/10.0
- 1% rule +6.3/10.0
- Schools +4.6/10.0
- Livability +3.9/5.0
- Rent growth +2.5/5.0
- Condition / age +2.5/5.0
$109,900
🖨 Deal sheet 📄 Offer letter ✓ Due diligence
Listing remarks MLS
* * * PRICE REDUCTION * * * Motivated Seller!! NO SHOWINGS FRIDAY 8/15.
Key facts
- Recently remodeled
- New roof
- Built 1900
Tags
Property features AI
Exterior
- Utilities: Public water; Public sewer; Electric heating fuel
- Home design: Semi-detached property; Estimated year built
- Construction: Vinyl siding; Other foundation
- Exterior features: Lot dimensions approximately 32 x 200; Not in a federal flood zone; Other above- and below-grade structures
Interior
- Bedrooms: Two bedrooms on the upper level; One bedroom on the lower level
- Bathrooms: One full bathroom on the main level; One full bathroom total
- Heating & cooling: Baseboard electric heating; Bottled gas hot water
- Interior features: Estimated living area; Daylight, partial basement
Neighborhood map
What this means for you Summary
Snapshot
- This is a 3-bed/1.0-bath townhouse listed at $110k.
Deal economics
- At list price, monthly cash flow is $226 ($3k/yr) — positive.
- The deal already cash-flows at list — no discount required.
- Meets the 1% rule at list price ($1k rent vs $110k).
Location & tenants
- Location reads 77/100 on livability (#343 in PA, #3,022 nationally) — a middle-class / working-renter tenant base. Strengths: crime A+, cost of living A+, housing A+; Watch: amenities F, commute F.
- Blue Mountain SD (town): math 42% / reading 65% proficiency, ranked #126 of 539 in PA (top 23%) — acceptable for families but not a draw, mixed tenant base, ~2y average lease.
- Market conditions: 13 active listings in the ZIP; 2 comparable units currently listed for rent nearby; 169 units permitted in Schuylkill County in 2024 (0 in 5+ unit buildings).
Forward outlook
- In year one you build about $12k of equity ($760 loan paydown + $11k appreciation (10.0% local appreciation)).
- Schuylkill County population projected at -16% by 2050 — secular population decline; favor cash flow + early exit over multi-decade hold.
- At projected returns (10.0% appreciation + 3.0% rent growth), your $31k cash investment doubles in ~3 years — after that, you're playing with house money.
- By year 4, paydown + projected appreciation supports a ~$42k cash-out refi (75% LTV) — recoverable capital for the next deal without selling this one.
Negotiation context
- Only 2 days on market — expect competitive offers; lowballing is unlikely to land.
- 2 sale attempts with the ask held roughly flat each time — persistent listings suggest the price (not the market) is what's stuck; bring a comps-based counter.
- Current owner paid $35k; list at $110k implies a 214% gain — meaningful room to come down on a strong offer.
Risks & watch-outs
- Watch-outs: built in 1900 — expect roof / HVAC / electrical / plumbing capex.
Questions for the listing agent
- Built in 1900 — when were the roof, HVAC, electrical panel, plumbing, and water heater last replaced?
- Is there a deadline driving the sale (1031 exchange, divorce, estate, relocation)? That informs how much negotiation room exists.
- Schools are B-rated — typically a magnet for longer-tenancy family renters. What's the average tenant stay here, and is there a school-zone premium baked into asking?
- What's the average days-on-market for RENTAL listings here right now (not sales)? A rising rental-DOM trend means longer vacancies and softer asking-rent achievability than the comps imply.
- What's the recent tenant-quality profile in this submarket — average credit score on applications, eviction rate, late-payment / NSF rate, and stable-employment percentage? A property-management company in the area should have these aggregated.
- How much new for-sale + rental construction is in the pipeline within 1–3 miles? Heavy new supply typically softens prices + rents 12–24 months out; constrained supply supports both.
Investment metrics
- 1% rule
- 1.13% ✓
- Cap rate
- 8.76%
- Cash-on-cash
- 8.81%
- DSCR
- 1.39
- GRM
- 7.3
CMA / ARV
- ARV (on-the-fly)
- $121,500
- Comps found
- 6
Show comp detail 6 sales within ~0.75 mi
| Address | Dist | Beds/Ba | Sqft | Sold | Price | $/sf | Match |
|---|---|---|---|---|---|---|---|
| 144 Pottsville St | 0.00mi | 2/1.0 (-1) | 1,292 (+6%) | 10mo | $35,000 | $27 | 76 |
| 311 Centre Ave | 0.59mi | 3/1.0 | 1,224 (+1%) | 13mo | $115,000 | $94 | 60 |
| 134 Pennsylvania Ave | 0.74mi | 2/1.0 (-1) | 1,132 (-7%) | 3mo | $102,500 | $91 | 46 |
| 52 N 4th St | 0.69mi | 3/1.0 | 1,352 (+11%) | 14mo | $135,000 | $100 | 37 |
| 115 Center Ave | 0.71mi | 4/1.0 (+1) | 1,361 (+12%) | 13mo | $160,000 | $118 | 31 |
| 130 Pennsylvania Ave | 0.75mi | 2/2.0 (-1) | 1,076 (-11%) | 18mo | $150,000 | $139 | 22 |
Match score weights: distance 35% · size 25% · config 20% · recency 20%. Top-matched comps best support the ARV.
Projected returns pro-forma
10.0% appreciation · 3.0% rent growth · sell at horizon
- IRR
- 30.7%
- Equity multiple
- 3.41×
- Total profit
- $74,255
- Equity at exit
- $99,007
- IRR
- 26.6%
- Equity multiple
- 7.74×
- Total profit
- $207,396
- Equity at exit
- $213,512
Cash invested: $30,772 (down + closing). Projections, not guarantees.
Landlord ↔ Tenant lean methodology
- Overall (STATE)
- 62 Landlord-Friendly
- State Pennsylvania
- 62 Landlord-Friendly · EVEN
- County
- — inherits STATE
- City
- — inherits STATE
ZIP-level market 17929
- Home prices YoY
- 7.0%
- Active inventory
- 13
- Price-to-rent
- 7.3×
Monthly cashflow live
- Estimated rent
- $1,247 medium interval (Pro) →
- Mortgage (P&I)
- −$576
- Tax est. 1.5%
- −$137 /mo · $1,648/yr
- Insurance
- −$46
- HOA
- −$0
- Vacancy / Maint / Mgmt
- −$262
- Net cashflow
- $226
Break-even live
UW: 25.0% down · 7.5% · 30yr · 1.5% tax · 5.0% vac · 8.0% maint · 8.0% mgmt
Financing live
Cash to close
- Down payment
- $27,475
- Closing costs
- $3,297
- Reserves months
- —
- Total cash needed
- —
Loan-product check · same deal, 3 products live
Conventional
25% down · 7.5% · 30yr
- Down + closing
- —
- Monthly P&I
- —
- Monthly cashflow
- —
- DSCR
- —
- Eligible?
- —
Personal DTI + credit; lowest rate.
DSCR
20% down · 8.5% · 30yr
- Down + closing
- —
- Monthly P&I
- —
- Monthly cashflow
- —
- DSCR
- —
- Eligible?
- —
No personal income docs; deal must DSCR.
Hard money
10% down · 12.0% · 12mo
- Down + closing
- —
- Monthly P&I
- —
- Monthly cashflow
- —
- DSCR
- —
- Eligible?
- —
Short-term bridge; refi at stabilization.
Rent comps 2 comps
| Address | Beds | Baths | Sqft | Rent | $/sqft | DOM | Units | Dist |
|---|---|---|---|---|---|---|---|---|
| 503 Dock St Apt B Schuylkill Haven, PA | 2.0 | 1.0 | 850 | $1,050 | $1.24 | 43d | 1 | 0.64mi |
| 136 W Main St Schuylkill Haven, PA | 3.0 | 2.0 | 1400 | $1,500 | $1.07 | 43d | 1 | 1.02mi |
Listing history 3 events
-
2026-06-19days on market $109,900 Active 2 DOM
-
2026-06-17remarks 205-char remark
-
2026-06-17$109,900 Active 1 DOM
ⓘ Source: listings_history table (triggers on properties + properties_extension) + one-shot
backfill from property_details.listing_events for pre-trigger history.
Climate risk First Street
- Flood 1/10 Low FEMA zone X (unshaded) · 0% chance over 30 yrs
- Wildfire 3/10 Moderate
- Heat 4/10 Moderate 7 d/yr ≥97°F today · 16 d/yr by 30 yrs out
- Wind 4/10 Moderate 8% chance of damaging wind over 30 yrs
- Air quality 2/10 Low 1 unhealthy d/yr today · 2 by 30 yrs out
Nearby sold comps map
Loading sold comps map…
Walkable amenities ~0.75 mi
Loading nearby amenities…
Taxation est. · year 1
- Rental income
- $14,967
- − Mortgage interest
- −$6,156
- − Property taxes
- −$1,648
- − Insurance
- −$550
- − Repairs & maintenance
- −$1,197
- − Management
- −$1,197
- − Depreciation
- −$3,197
- Taxable income
- $1,021
- Est. tax owed @ 24.0%
- −$245
- After-tax cash flow
- $2,465/yr
For passive investors: Depreciation is non-cash, so a rental often shows a tax loss while cash-flowing — sheltering income. Rental losses are passive: they offset passive income freely, and up to $25,000/yr can offset ordinary (W-2) income if you actively participate and your MAGI is under $100k (phasing out to $0 by $150k); unused losses carry forward. On sale, claimed depreciation is recaptured at up to 25%, and gains may owe capital-gains tax (a 1031 exchange can defer both). Figures are a year-1 estimate at your 24.0% rate — not tax advice; consult a CPA.
Schools (NCES district)
- District
- Blue Mountain SD
- NCES district ID
- 4203870
- Math proficiency
- 42% ▼ -9.00%
- Reading proficiency
- 65% ▼ -7.00%
- Median HH income
- $58,661
- Composite
- 46.42/100
- National rank
- #2454
- State rank
- #126 of 539 in PA
Livability — Cressona
- Score
- 77/100
- State rank
- #343
- US rank
- #3022
Category grades
Schools grade is shown separately in the Schools card above.
Census & demographics
- Census place
- Cressona, PA
- City population
- 1,369
- Population (ZIP)
- 1,369
Population outlook (Schuylkill County) Hauer SSP2
- Today (2025)
- 137,447 people
- By 2030
- 133,121 · -3.1%
- By 2040
- 124,172 · -9.7%
- By 2050
- 115,611 · -15.9%
- By 2075
- 100,796 · -26.7%
- By 2100
- 86,667 · -36.9%
Race, ethnicity, and origin ACS 2023
- Neighborhood character
- Predominantly White (92%)
- Race & ethnicity
- White 92% Two or more races 5% Hispanic / Latino 4%
- Common ancestry
- Romanian 7% Polish 5% Iranian 4%
- Foreign-born
- 1%
- Languages at home
- 98% English-only · German/W. Germanic 1% Spanish 1%
Political lean MEDSL · Schuylkill
- 2024 margin
- Solid R (+42.1) · D 28.5% · R 70.6%
- 2008→2024 swing
- -33.4pp toward R · 2008: -8.7pp · 2024: -42.1pp
- All cycles
- 2024: R+42.1 2020: R+39.9 2016: R+43.4 2012: R+13.4 2008: R+8.7
Not yet ingested
- Civics
- —
Market trends
- HPI YoY
- ▲ 13.90%
- Current HPI
- 211.4846
- Rent YoY
- —
- Metro
- —
- State GDP YoY
- ▲ 1.68%
- F500 in state
- 34
Industry mix (Fortune 500 HQ in PA)
| Industry | F500 HQs | Revenue |
|---|---|---|
| Healthcare | 2 | $309B |
|
||
| Insurance | 2 | $27B |
|
||
| Telecommunications / Media | 1 | $124B |
|
||
| Industrial Distribution | 1 | $22B |
|
||
| Financial Services | 1 | $20B |
|
||
| Chemicals / Materials | 1 | $18B |
|
||
Price history
+99.8% since first listed5 events — show timeline
- 2026-06-17 Listed $109,900 BRIGHT MLS
- 2025-09-04 Sold (MLS) $35,000 BRIGHT MLS
- 2025-08-14 Pending — BRIGHT MLS
- 2025-08-10 Price Changed $45,000 BRIGHT MLS
- 2025-07-15 Listed $55,000 BRIGHT MLS
Property tax history
+16.6%/yrLatest (2026): $5,843 · +341.0% YoY. Source: county tax records.
Cash-flow waterfall
monthlySold comps — $/sqft
last 12 mo · ≤1 miLoading sold comps…