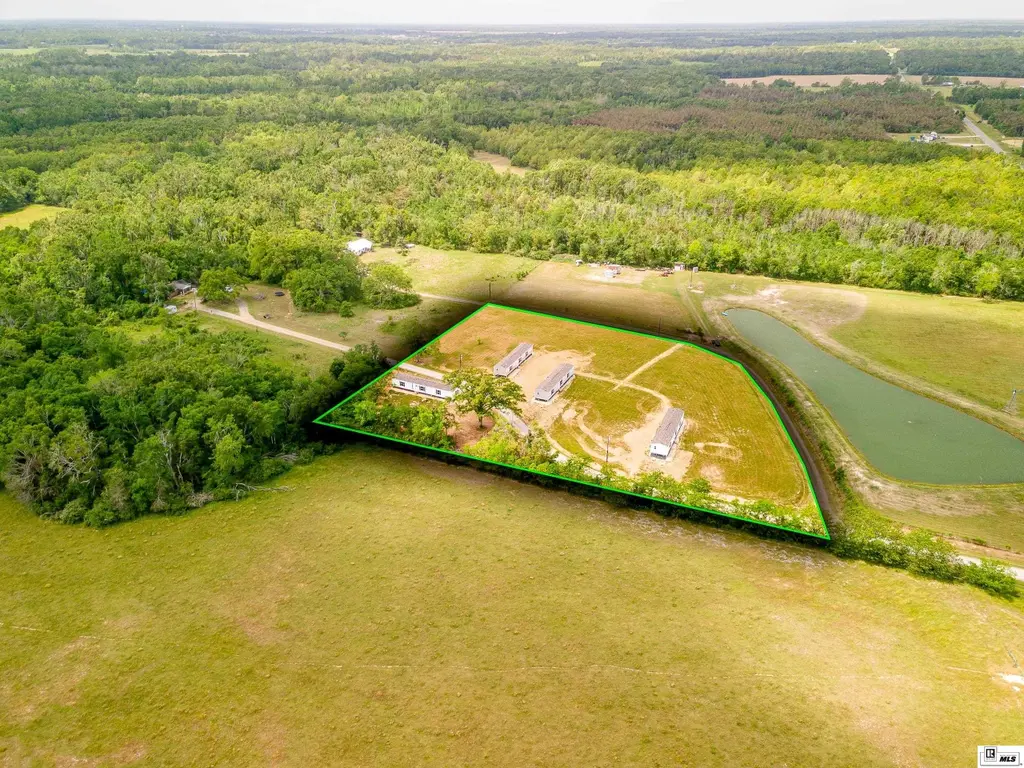
509 Highway 856 · Mangham, LA
Flood risk 5/10 · Moderate
- FEMA flood zone
- X
- Chance of flooding over 30 yrs
- 0.65%
- Est. flood insurance / yr
- $507 – $1,088
Fire risk 3/10 · Minor
- Est. fire insurance / yr
- $1,269 – $2,357
Heat risk 7/10 · Major
- Hot days now (above 110°F)
- 7 days/yr
- Hot days in 30 yrs
- 20 days/yr
Wind risk 8/10 · Major
- Chance of severe wind over 30 yrs
- 80.0%
Air-quality risk 1/10 · Minimal
- Unhealthy air days now
- 0 days/yr
- Unhealthy air days in 30 yrs
- 0 days/yr
Risk factors via First Street. Map © Google.
Why this score? — see what drove the D+ grade
The composite is a weighted blend of 9 inputs, each scored 0–100. Each bar is that input's sub-score; the figure is the points it added to the 100-point composite (weight × sub-score).
- Cash flow +15.0/30.0
- ARV discount +7.5/15.0
- 1% rule +5.0/10.0
- DSCR +5.0/10.0
- Appreciation +5.0/10.0
- Livability +2.9/5.0
- Rent growth +2.5/5.0
- Condition / age +2.5/5.0
- Schools +1.4/10.0
$21,000
🖨 Deal sheet 📄 Offer letter ✓ Due diligence
Listing remarks
4 Unit Mobile Home park for Lease only 20+- minutes from META site. The property is 3.5+- acres located in a rural setting just East of Archibald Louisiana. The Homes are all NEW 3-bedrooms, two bath units that are 1,200+- heated sq. ft. All utilities, maintenance, furniture, appliances, TV and cooking utensils are included in the lease. Cleaning services can be negotiated with the owner. Owner would prefer at least a one-year lease with one individual or company, but any offer will be considered. This is a very nice quiet area with several access routes to the construction site. Very Nice!
Key facts
- 3.5 acre lot
- Built 2026
- Listed 51 days
Property features AI
Exterior
- Parking: Gravel parking
- Utilities: Public water; Natural gas not available
- Home design: Residential mobile home
- Construction: Vinyl siding; Fiberglass roof; Crawl space foundation; Year built not provided
- Exterior features: No patio or porch listed; 3.5-acre lot
Interior
- Kitchen: Dishwasher; Refrigerator; Electric Range; Microwave; Electric Water Heater
- Heating & cooling: Central heating (electric); Central air conditioning (electric)
- Interior features: Other interior features
- Laundry & utility: In-unit laundry (washer and dryer included)
Neighborhood map
What this means for you Summary
Snapshot
- This is a 12-bed/?-bath manufactured listed at $21k.
Deal economics
- At list price, monthly cash flow is $946 ($11k/yr) — positive.
- The deal already cash-flows at list — no discount required.
- Meets the 1% rule at list price ($1k rent vs $21k).
- Recommended offer: $20k (3.0% below list) — sets the bar for market timing.
Location & tenants
- Location reads 58/100 on livability (#296 in LA) — a working-class tenant base; expect higher turnover. Strengths: cost of living A+, housing A+; Watch: health & safety D, crime F, amenities F.
- Richland Parish (rural): math 12% / reading 22% proficiency, ranked #73 of 98 in LA (top 74%) — low school quality limits family demand, transient renter base, plan for 1-2y turnover; 76% free/reduced lunch — lower-income household profile, screen leases tightly.
- Market conditions: 1 active listings in the ZIP; 27 units permitted in Richland Parish in 2024 (0 in 5+ unit buildings).
Forward outlook
- In year one you build about $775 of equity ($145 loan paydown + $630 appreciation (3.0% local appreciation)).
- Richland County population projected to shrink 9% by 2050 — rents likely to lag national; underwrite the cash flow, not the appreciation.
- At projected returns (3.0% appreciation + 3.0% rent growth), your $6k cash investment doubles in ~1 year — after that, you're playing with house money.
Negotiation context
- It's been on market 52 days — a 3% lower offer ($20k) is reasonable based on typical stale-listing flexibility.
Risks & watch-outs
- Climate carrying-cost: moderate flood risk; severe wind risk, 80% chance of damaging wind over 30y; extreme-heat days projected 7→20/yr by 2055 (HVAC capex compounding) — expect insurance premiums to compound above CPI over the hold.
Questions for the listing agent
- It's been on market 52 days. Have you received any prior offers? Is the seller open to a 3% concession, seller financing, or rate buy-down credit?
- Is there a deadline driving the sale (1031 exchange, divorce, estate, relocation)? That informs how much negotiation room exists.
- Schools are B-rated — typically a magnet for longer-tenancy family renters. What's the average tenant stay here, and is there a school-zone premium baked into asking?
- Crime grade is F in this area — have there been break-ins, vandalism, or insurance claims at this property in the last 3 years? What carrier currently insures it and at what premium?
- The area grade is low — what's the realistic commute time and amenity access for the typical tenant pool here? Any planned neighborhood developments (good or bad) we should know about?
- What's the average days-on-market for RENTAL listings here right now (not sales)? A rising rental-DOM trend means longer vacancies and softer asking-rent achievability than the comps imply.
- What's the recent tenant-quality profile in this submarket — average credit score on applications, eviction rate, late-payment / NSF rate, and stable-employment percentage? A property-management company in the area should have these aggregated.
- How much new for-sale + rental construction is in the pipeline within 1–3 miles? Heavy new supply typically softens prices + rents 12–24 months out; constrained supply supports both.
Investment metrics
- 1% rule
- 6.58% ✓
- Cap rate
- 60.35%
- Cash-on-cash
- 193.08%
- DSCR
- 9.59
- GRM
- 1.3
CMA / ARV
No comps found within radius.
Projected returns pro-forma
3.0% appreciation · 3.0% rent growth · sell at horizon
- IRR
- —
- Equity multiple
- 11.68×
- Total profit
- $62,807
- Equity at exit
- $9,443
- IRR
- —
- Equity multiple
- 24.67×
- Total profit
- $139,172
- Equity at exit
- $14,552
Cash invested: $5,880 (down + closing). Projections, not guarantees.
Landlord ↔ Tenant lean methodology
- Overall (STATE)
- 90 Strongly Landlord-Friendly
- State Louisiana
- 90 Strongly Landlord-Friendly · R+12
- County
- — inherits STATE
- City
- — inherits STATE
ZIP-level market 71218
- Active inventory
- 1
- Price-to-rent
- 1.3×
Monthly cashflow live
- Estimated rent
- $1,381 medium interval (Pro) →
- Mortgage (P&I)
- −$110
- Tax est. 1.5%
- −$26 /mo · $315/yr
- Insurance
- −$9
- HOA
- −$0
- Vacancy / Maint / Mgmt
- −$290
- Net cashflow
- $946
Break-even live
UW: 25.0% down · 7.5% · 30yr · 1.5% tax · 5.0% vac · 8.0% maint · 8.0% mgmt
Financing live
Cash to close
- Down payment
- $5,250
- Closing costs
- $630
- Reserves months
- —
- Total cash needed
- —
Loan-product check · same deal, 3 products live
Conventional
25% down · 7.5% · 30yr
- Down + closing
- —
- Monthly P&I
- —
- Monthly cashflow
- —
- DSCR
- —
- Eligible?
- —
Personal DTI + credit; lowest rate.
DSCR
20% down · 8.5% · 30yr
- Down + closing
- —
- Monthly P&I
- —
- Monthly cashflow
- —
- DSCR
- —
- Eligible?
- —
No personal income docs; deal must DSCR.
Hard money
10% down · 12.0% · 12mo
- Down + closing
- —
- Monthly P&I
- —
- Monthly cashflow
- —
- DSCR
- —
- Eligible?
- —
Short-term bridge; refi at stabilization.
Listing history 16 events
-
2026-06-19days on market $21,000 Active 52 DOM
-
2026-06-18days on market $21,000 Active 51 DOM
-
2026-06-17days on market $21,000 Active 50 DOM
-
2026-06-16days on market $21,000 Active 49 DOM
-
2026-06-15days on market $21,000 Active 48 DOM
-
2026-06-14days on market $21,000 Active 46 DOM
-
2026-06-13days on market $21,000 Active 45 DOM
-
2026-06-10days on market $21,000 Active 43 DOM
-
2026-06-09days on market $21,000 Active 42 DOM
-
2026-06-08days on market $21,000 Active 41 DOM
-
2026-06-07days on market $21,000 Active 40 DOM
-
2026-06-02days on market $21,000 Active 35 DOM
-
2026-06-01days on market $21,000 Active 34 DOM
-
2026-05-31days on market $21,000 Active 33 DOM
-
2026-05-30days on market $21,000 Active 32 DOM
-
2026-04-27$21,000 Active 597-char remark
ⓘ Source: listings_history table (triggers on properties + properties_extension) + one-shot
backfill from property_details.listing_events for pre-trigger history.
Climate risk First Street
- Flood 5/10 Major FEMA zone X · 65% chance over 30 yrs
- Wildfire 3/10 Moderate
- Heat 7/10 Severe 7 d/yr ≥110°F today · 20 d/yr by 30 yrs out
- Wind 8/10 Severe 80% chance of damaging wind over 30 yrs
- Air quality 1/10 Low 0 unhealthy d/yr today · 0 by 30 yrs out
Nearby sold comps map
Loading sold comps map…
Walkable amenities ~0.75 mi
Loading nearby amenities…
Taxation est. · year 1
- Rental income
- $16,575
- − Mortgage interest
- −$1,176
- − Property taxes
- −$315
- − Insurance
- −$105
- − Repairs & maintenance
- −$1,326
- − Management
- −$1,326
- − Depreciation
- −$611
- Taxable income
- $11,716
- Est. tax owed @ 24.0%
- −$2,812
- After-tax cash flow
- $8,541/yr
For passive investors: Depreciation is non-cash, so a rental often shows a tax loss while cash-flowing — sheltering income. Rental losses are passive: they offset passive income freely, and up to $25,000/yr can offset ordinary (W-2) income if you actively participate and your MAGI is under $100k (phasing out to $0 by $150k); unused losses carry forward. On sale, claimed depreciation is recaptured at up to 25%, and gains may owe capital-gains tax (a 1031 exchange can defer both). Figures are a year-1 estimate at your 24.0% rate — not tax advice; consult a CPA.
Schools (NCES district)
- District
- Richland Parish
- NCES district ID
- 2201350
- Math proficiency
- 12% ▼ -36.00%
- Reading proficiency
- 22% ▼ -31.00%
- Median HH income
- $36,097
- Composite
- 14.06/100
- National rank
- #9464
- State rank
- #73 of 98 in LA
Livability — Mangham
- Score
- 58/100
- State rank
- #296
- US rank
- #20964
Category grades
Schools grade is shown separately in the Schools card above.
Census & demographics
No demographic data for this ZIP.
Market trends
- HPI YoY
- —
- Current HPI
- —
- Rent YoY
- —
- Metro
- —
- State GDP YoY
- ▲ 3.29%
- F500 in state
- 10
Industry mix (Fortune 500 HQ in LA)
| Industry | F500 HQs | Revenue |
|---|---|---|
| Telecommunications | 2 | $23B |
|
||
| Utilities | 1 | $12B |
|
||
| Wholesale / Distribution | 1 | $5B |
|
||
| Advertising | 1 | $2B |
|
||
Price history
1 event — show timeline
- 2026-04-27 Listed $21,000 NELABOR
Cash-flow waterfall
monthlySold comps — $/sqft
last 12 mo · ≤1 miLoading sold comps…