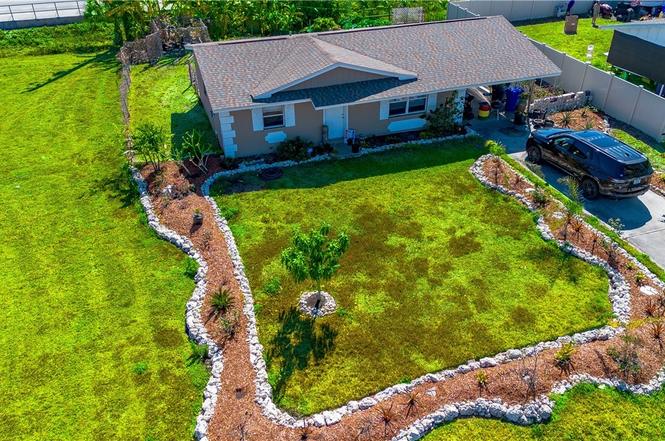
3807 Highland Ave · Fort Myers, FL
Flood risk 1/10 · Minimal
- FEMA flood zone
- X (unshaded)
- Chance of flooding over 30 yrs
- 0.0%
- Est. flood insurance / yr
- $507 – $1,088
Fire risk 3/10 · Minor
- Est. fire insurance / yr
- $947 – $1,759
Heat risk 10/10 · Severe
- Hot days now (above 107°F)
- 7 days/yr
- Hot days in 30 yrs
- 30 days/yr
Wind risk 10/10 · Severe
- Chance of severe wind over 30 yrs
- 99.0%
Air-quality risk 2/10 · Minimal
- Unhealthy air days now
- 1 days/yr
- Unhealthy air days in 30 yrs
- 1 days/yr
Risk factors via First Street. Map © Google.
Why this score? — see what drove the C- grade
The composite is a weighted blend of 9 inputs, each scored 0–100. Each bar is that input's sub-score; the figure is the points it added to the 100-point composite (weight × sub-score).
- Cash flow +21.3/30.0
- ARV discount +7.5/15.0
- DSCR +6.8/10.0
- 1% rule +5.4/10.0
- Livability +4.3/5.0
- Schools +4.1/10.0
- Condition / age +2.5/5.0
- Rent growth +1.4/5.0
- Appreciation +0.0/10.0
$174,995
🖨 Deal sheet 📄 Offer letter ✓ Due diligence
Listing remarks MLS
MULTIPLE OFFER SITUATION. Newly renovated, clean, and affordable single-family home nestled in the quiet Sunnycrest subdivision, conveniently located near all Fort Myers restaurants, beaches, shopping, ball parks, and RSW airport! Major updates include luxury vinyl flooring, 2022 HVAC system, 6 panel colonial doors, closet mirrors, refurbished tiling, new kitchen cabinets, and extensive interior and exterior paint throughout. That's not all! New vanity in the bathroom, light fixtures in living area, and all electrical outlets have been updated. Wonderful opportunity! Schedule you're showing today before you miss out on this slice of paradise!
Key facts
- Generous lot
- Future expansion
- Extra storage
Tags
Property features AI
Finance
- Financial info: Pets allowed
- HOA & community: No association fee
Exterior
- Parking: Attached carport; 1 covered parking space; 1-car carport
- Security: Fire sprinkler system
- Utilities: Cable available; Sewer assessment paid; Water assessment paid; Irrigation included in assessment
- Home design: Single-story; Entry level is 1; North-facing
- Construction: Block, concrete and stucco construction; Shingle roof; Resale property
- Exterior features: Fenced yard; South exposure; Irregular lot
Interior
- Kitchen: Electric cooktop; Microwave; Dishwasher; Freezer; Refrigerator
- Bedrooms: Primary bedroom on main level
- Flooring: Tile
- Bathrooms: 1 full bathroom
- Heating & cooling: Central heating (electric); Central air conditioning (electric); Ceiling fans
- Interior features: Double-hung windows; Bedroom on main level; Living/dining room; Main level primary; Sitting area in primary; Unfurnished
- Laundry & utility: Washer and dryer included; Laundry located inside
Neighborhood map
What this means for you Summary
Snapshot
- This is a 3-bed/1.0-bath single-family listed at $175k.
Deal economics
- At list price, monthly cash flow is $256 ($3k/yr) — positive.
- The deal already cash-flows at list — no discount required.
- Meets the 1% rule at list price ($2k rent vs $175k).
- Recommended offer: $159k (9.0% below list) — sets the bar for market timing.
- Cap rate 8.1% vs local median 3.0% in Fort Myers — top-decile yield for the area; either an underpriced asset or a hidden risk that comps aren't pricing in. Stress-test before assuming the spread holds.
Location & tenants
- Location reads 86/100 on livability (#14 in FL, #383 nationally) — a professional / high-income tenant draw. Strengths: amenities A+, commute A+, housing A+.
- Lee (suburban): math 47% / reading 50% proficiency, ranked #42 of 73 in FL (top 58%) — families likely to look elsewhere, expect single-tenant / working-renter base with shorter leases.
- Market conditions: Rents falling (-4.3%/yr); 267 active listings in the ZIP; 40 comparable units currently listed for rent nearby; rentals leasing fast (median 11d on market — plan ~1-2 weeks tenant-placement turnaround); 15,411 units permitted in Lee County in 2024 (4,686 in 5+ unit buildings).
- This rent runs 41% of the median local income ($53k/yr) — at the standard rent-burdened threshold; future hikes will face affordability resistance.
Forward outlook
- Local home prices are declining (-3.0%/yr); year-one equity from $1k of loan paydown is wiped out by about $5k of value loss. Plan a longer hold.
- Lee County population projected at +44% by 2050 — long-run rental-demand tailwind backs the buy-and-hold thesis.
Negotiation context
- It's been on market 113 days — a 9% lower offer ($159k) is reasonable based on typical stale-listing flexibility.
- 3 sale attempts since 21y ago; this cycle's ask has dropped $44k (20%) from the opening price — seller is motivated, your offer sets the floor, not the list.
Risks & watch-outs
- Climate carrying-cost: severe wind risk, 99% chance of damaging wind over 30y; extreme-heat days projected 7→30/yr by 2055 (HVAC capex compounding) — expect insurance premiums to compound above CPI over the hold.
Questions for the listing agent
- It's been on market 113 days. Have you received any prior offers? Is the seller open to a 9% concession, seller financing, or rate buy-down credit?
- Built in 1970 — when were the roof, HVAC, electrical panel, plumbing, and water heater last replaced?
- Why hasn't it sold? Are there any deal-killer items the seller is aware of (foundation, flood, title, zoning, code violations)?
- Is there a deadline driving the sale (1031 exchange, divorce, estate, relocation)? That informs how much negotiation room exists.
- What's the average days-on-market for RENTAL listings here right now (not sales)? A rising rental-DOM trend means longer vacancies and softer asking-rent achievability than the comps imply.
- What's the recent tenant-quality profile in this submarket — average credit score on applications, eviction rate, late-payment / NSF rate, and stable-employment percentage? A property-management company in the area should have these aggregated.
- How much new for-sale + rental construction is in the pipeline within 1–3 miles? Heavy new supply typically softens prices + rents 12–24 months out; constrained supply supports both.
Investment metrics
- 1% rule
- 1.04% ✓
- Cap rate
- 8.05%
- Cash-on-cash
- 6.28%
- DSCR
- 1.28
- GRM
- 8.0
CMA / ARV
- ARV (on-the-fly)
- $110,448
- Comps found
- 1
Show comp detail 1 sale within ~0.75 mi
| Address | Dist | Beds/Ba | Sqft | Sold | Price | $/sf | Match |
|---|---|---|---|---|---|---|---|
| 3524 Dora St | 0.53mi | 4/2.0 (+1) | 1,020 (+9%) | 11mo | $120,000 | $118 | 42 |
Match score weights: distance 35% · size 25% · config 20% · recency 20%. Top-matched comps best support the ARV.
Projected returns pro-forma
-3.0% appreciation · 0.0% rent growth · sell at horizon
- IRR
- -10.0%
- Equity multiple
- 0.65×
- Total profit
- $-17,330
- Equity at exit
- $26,092
- IRR
- -5.3%
- Equity multiple
- 0.70×
- Total profit
- $-14,572
- Equity at exit
- $15,130
Cash invested: $48,999 (down + closing). Projections, not guarantees.
Landlord ↔ Tenant lean methodology
- Overall (STATE)
- 87 Strongly Landlord-Friendly
- State Florida
- 87 Strongly Landlord-Friendly · R+3
- County
- — inherits STATE
- City
- — inherits STATE
ZIP-level market 33916
- Home prices YoY
- -28.2%
- Rents YoY
- -4.3%
- Active inventory
- 267
- Price-to-rent
- 8.0×
Monthly cashflow live
- Estimated rent
- $1,814 high interval (Pro) →
- Mortgage (P&I)
- −$918
- Tax from tax record
- −$186 /mo · $2,232/yr
- Insurance
- −$73
- HOA
- −$0
- Vacancy / Maint / Mgmt
- −$381
- Net cashflow
- $256
Break-even live
UW: 25.0% down · 7.5% · 30yr · 1.5% tax · 5.0% vac · 8.0% maint · 8.0% mgmt
Financing live
Cash to close
- Down payment
- $43,749
- Closing costs
- $5,250
- Reserves months
- —
- Total cash needed
- —
Loan-product check · same deal, 3 products live
Conventional
25% down · 7.5% · 30yr
- Down + closing
- —
- Monthly P&I
- —
- Monthly cashflow
- —
- DSCR
- —
- Eligible?
- —
Personal DTI + credit; lowest rate.
DSCR
20% down · 8.5% · 30yr
- Down + closing
- —
- Monthly P&I
- —
- Monthly cashflow
- —
- DSCR
- —
- Eligible?
- —
No personal income docs; deal must DSCR.
Hard money
10% down · 12.0% · 12mo
- Down + closing
- —
- Monthly P&I
- —
- Monthly cashflow
- —
- DSCR
- —
- Eligible?
- —
Short-term bridge; refi at stabilization.
Rent comps 40 comps
| Address | Beds | Baths | Sqft | Rent | $/sqft | DOM | Units | Dist |
|---|---|---|---|---|---|---|---|---|
| 3700 Wolf Liam DR Fort Myers, FL | 1.0–3.0 | 1.0–2.0 | 1067 | $2,052 | $1.92 | 3d | 225 | 0.49mi |
| 4220 Coasterra DR Fort Myers, FL | 1.0–3.0 | 1.0–2.5 | 1072 | $2,569 | $2.40 | 3d | 10 | 0.49mi |
| 3920 Mina Cir Fort Myers, FL | 1.0–3.0 | 1.0–2.0 | 992 | $2,570 | $2.59 | 3d | 39 | 0.49mi |
| 3417 South St Fort Myers, FL | 3.0 | 2.0 | 1008 | $1,695 | $1.68 | 23d | 1 | 0.54mi |
| 3217 Jeffcott St Unit 1 Fort Myers, FL | 2.0 | 1.0 | 825 | $1,550 | $1.88 | 3d | 1 | 0.61mi |
| 3608 Sammy Watkins Ave #2 Fort Myers, FL | 2.0 | 1.0 | 650 | $1,200 | $1.85 | 19d | 1 | 1.01mi |
| 3608 Sammy Watkins Ave Fort Myers, FL | 2.0 | 1.0 | 650 | $1,200 | $1.85 | 23d | 1 | 1.01mi |
| 3500 Star Ln Fort Myers, FL | 1.0–3.0 | 1.0–2.0 | 881 | $2,194 | $2.49 | 3d | 23 | 1.10mi |
| 4051 Regata Way Fort Myers, FL | 1.0–3.0 | 1.0–2.0 | 987 | $2,021 | $2.05 | 2d | 34 | 1.11mi |
| 3701 Winkler Ave Fort Myers, FL | 1.0–2.0 | 1.0–2.0 | 863 | $1,662 | $1.92 | 2d | 46 | 1.13mi |
| 3419 Winkler Ave Fort Myers, FL | 1.0–3.0 | 1.0–2.0 | 1047 | $1,850 | $1.77 | 3d | 2 | 1.18mi |
| 3419 Winkler Ave Fort Myers, FL | 1.0–3.0 | 1.0–2.0 | 1047 | $1,850 | $1.77 | 11d | 2 | 1.18mi |
| 2147 Pauldo St Fort Myers, FL | 3.0 | 2.0 | 1088 | $1,395 | $1.28 | 23d | 1 | 1.18mi |
| 4051 Winkler Ave Fort Myers, FL | 3.0 | 1.0–2.0 | 860 | $2,260 | $2.63 | 2d | 189 | 1.21mi |
| 2103 French St Fort Myers, FL | 3.0 | 2.0 | 1100 | $1,800 | $1.64 | 1d | 1 | 1.22mi |
| 2103 French St Fort Myers, FL | 3.0 | 2.0 | 1100 | $1,900 | $1.73 | 23d | 1 | 1.22mi |
| 2103 French St Unit 2 Fort Myers, FL | 3.0 | 2.0 | 1100 | $1,800 | $1.64 | 23d | 1 | 1.22mi |
| 2103 French St Fort Myers, FL | 3.0 | 2.0 | 1100 | $1,800 | $1.64 | 2d | 1 | 1.22mi |
| 3615 Schoolhouse Rd W Fort Myers, FL | 2.0–3.0 | 2.0 | 1204 | $1,985 | $1.65 | 3d | 26 | 1.24mi |
| 2930 Thomas St Fort Myers, FL | 2.0 | 1.0 | 550 | $1,600 | $2.91 | 16d | 1 | 1.24mi |
| 2955 Dunbar St Unit A Fort Myers, FL | 3.0 | 2.0 | 1111 | $2,300 | $2.07 | 3d | 1 | 1.28mi |
| 3042 Douglas Ave Fort Myers, FL | 2.0 | 1.0 | 640 | $1,150 | $1.80 | 14d | 1 | 1.30mi |
| 3042 Douglas Ave Fort Myers, FL | 2.0 | 1.0 | 640 | $1,150 | $1.80 | 3d | 1 | 1.30mi |
| 3040 Douglas Ave Unit 3042 Fort Myers, FL | 2.0 | 1.0 | 800 | $1,150 | $1.44 | 3d | 1 | 1.31mi |
| 4116 Sunny Aspen Cir Fort Myers, FL | 1.0–3.0 | 1.0–2.0 | 1007 | $2,079 | $2.06 | 1d | 60 | 1.33mi |
| 4128 Bellasol Cir Fort Myers, FL | 3.0 | 2.0 | 1045 | $1,450 | $1.39 | 16d | 1 | 1.37mi |
| 4128 Bellasol Cir #1424 Fort Myers, FL | 3.0 | 2.0 | 1045 | $1,450 | $1.39 | 3d | 1 | 1.37mi |
| 4109 Bellasol Cir #1124 Fort Myers, FL | 3.0 | 2.0 | 1045 | $1,400 | $1.34 | 23d | 1 | 1.37mi |
| 2657 Lafayette St Fort Myers, FL | 2.0 | 1.0 | 696 | $1,650 | $2.37 | 23d | 1 | 1.38mi |
| 2950 Royal Palm Ave Fort Myers, FL | 2.0 | 1.0 | 732 | $1,522 | $2.08 | 23d | 1 | 1.39mi |
| 2643-2651 Lafayette St Unit 2649 Fort Myers, FL | 2.0 | 1.0 | 800 | $1,400 | $1.75 | 23d | 1 | 1.39mi |
| 4219 Bellasol Cir #1714 Fort Myers, FL | 3.0 | 2.0 | 1045 | $1,995 | $1.91 | 23d | 1 | 1.39mi |
| 4219 Bellasol Cir #1714 Fort Myers, FL | 3.0 | 2.0 | 1045 | $1,995 | $1.91 | 3d | 1 | 1.39mi |
| 2651 Lafayette St Unit 2651 Fort Myers, FL | 2.0 | 1.0 | 650 | $1,300 | $2.00 | 23d | 1 | 1.39mi |
| 2452 Stella St Unit 105 Fort Myers, FL | 2.0 | 1.0 | 676 | $1,000 | $1.48 | 11d | 1 | 1.39mi |
| 2452 Stella St Unit 204 Fort Myers, FL | 2.0 | 1.0 | 675 | $1,250 | $1.85 | 23d | 1 | 1.39mi |
| 2700 Park Windsor Dr #713 Fort Myers, FL | 2.0 | 2.0 | 752 | $1,500 | $1.99 | 16d | 1 | 1.40mi |
| 2680 Park Windsor Dr #503 Fort Myers, FL | 2.0 | 2.0 | 752 | $1,300 | $1.73 | 2d | 1 | 1.42mi |
| 2408 Linhart Ave Fl , USA Fort Myers, FL | 2.0 | 1.0 | 792 | $1,175 | $1.48 | 23d | 1 | 1.42mi |
| 2405 Hanson St Fort Myers, FL | 2.0 | 1.0 | 882 | $1,125 | $1.28 | 1d | 2 | 1.42mi |
Listing history 29 events
-
2026-06-13status $174,995 Pending 113 DOM
-
2026-06-10days on market $174,995 Active 113 DOM
-
2026-06-09days on market $174,995 Active 112 DOM
-
2026-06-07days on market $174,995 Active 110 DOM
-
2026-06-02days on market $174,995 Active 105 DOM
-
2026-06-01days on market $174,995 Active 104 DOM
-
2026-06-01days on market $174,995 Active 103 DOM
-
2026-04-20price $174,995
-
2026-04-15price $179,000
-
2026-04-09price $191,500
-
2026-03-16price $179,995
-
2026-03-06price $189,999
-
2026-03-01price $196,495
-
2026-02-26price $199,995
-
2026-02-19price $204,999
-
2026-02-17$219,000 Active
-
2022-08-12soldstatus $202,500 Closed 651-char remark
Show marketing remark (651 chars)
MULTIPLE OFFER SITUATION. Newly renovated, clean, and affordable single-family home nestled in the quiet Sunnycrest subdivision, conveniently located near all Fort Myers restaurants, beaches, shopping, ball parks, and RSW airport! Major updates include luxury vinyl flooring, 2022 HVAC system, 6 panel colonial doors, closet mirrors, refurbished tiling, new kitchen cabinets, and extensive interior and exterior paint throughout. That's not all! New vanity in the bathroom, light fixtures in living area, and all electrical outlets have been updated. Wonderful opportunity! Schedule you're showing today before you miss out on this slice of paradise!
-
2022-07-08status Pending 651-char remark
Show marketing remark (651 chars)
MULTIPLE OFFER SITUATION. Newly renovated, clean, and affordable single-family home nestled in the quiet Sunnycrest subdivision, conveniently located near all Fort Myers restaurants, beaches, shopping, ball parks, and RSW airport! Major updates include luxury vinyl flooring, 2022 HVAC system, 6 panel colonial doors, closet mirrors, refurbished tiling, new kitchen cabinets, and extensive interior and exterior paint throughout. That's not all! New vanity in the bathroom, light fixtures in living area, and all electrical outlets have been updated. Wonderful opportunity! Schedule you're showing today before you miss out on this slice of paradise!
-
2022-06-30$199,500 Active 651-char remark
Show marketing remark (651 chars)
MULTIPLE OFFER SITUATION. Newly renovated, clean, and affordable single-family home nestled in the quiet Sunnycrest subdivision, conveniently located near all Fort Myers restaurants, beaches, shopping, ball parks, and RSW airport! Major updates include luxury vinyl flooring, 2022 HVAC system, 6 panel colonial doors, closet mirrors, refurbished tiling, new kitchen cabinets, and extensive interior and exterior paint throughout. That's not all! New vanity in the bathroom, light fixtures in living area, and all electrical outlets have been updated. Wonderful opportunity! Schedule you're showing today before you miss out on this slice of paradise!
-
2015-03-02price $69,000
-
2013-04-17soldstatus $37,500
-
2013-04-17price $39,900
-
2006-08-04soldstatus $91,000
-
2005-06-04historical
-
2005-05-31soldstatus $86,200
-
2005-05-26soldstatus $86,105
-
2005-03-04$69,000
-
2005-01-21soldstatus $37,500
-
2004-12-13price $43,900
ⓘ Source: listings_history table (triggers on properties + properties_extension) + one-shot
backfill from property_details.listing_events for pre-trigger history.
Tax reassessment forecast FL · Resets to sale price
- Current annual tax
- $2,232 · $186/mo
- Projected year-2 tax
- $2,232 · $186/mo
- Expected delta
- $0/yr ($0/mo · 0.0%)
ⓘ Screening estimate from a state-policy table — verify with the county assessor before closing.
Climate risk First Street
- Flood 1/10 Low FEMA zone X (unshaded) · 0% chance over 30 yrs
- Wildfire 3/10 Moderate
- Heat 10/10 Extreme 7 d/yr ≥107°F today · 30 d/yr by 30 yrs out
- Wind 10/10 Extreme 99% chance of damaging wind over 30 yrs
- Air quality 2/10 Low 1 unhealthy d/yr today · 1 by 30 yrs out
Nearby sold comps map
Loading sold comps map…
Walkable amenities ~0.75 mi
Loading nearby amenities…
Taxation est. · year 1
- Rental income
- $21,769
- − Mortgage interest
- −$9,802
- − Property taxes
- −$2,232
- − Insurance
- −$875
- − Repairs & maintenance
- −$1,741
- − Management
- −$1,741
- − Depreciation
- −$5,091
- Taxable income
- $285
- Est. tax owed @ 24.0%
- −$68
- After-tax cash flow
- $3,009/yr
For passive investors: Depreciation is non-cash, so a rental often shows a tax loss while cash-flowing — sheltering income. Rental losses are passive: they offset passive income freely, and up to $25,000/yr can offset ordinary (W-2) income if you actively participate and your MAGI is under $100k (phasing out to $0 by $150k); unused losses carry forward. On sale, claimed depreciation is recaptured at up to 25%, and gains may owe capital-gains tax (a 1031 exchange can defer both). Figures are a year-1 estimate at your 24.0% rate — not tax advice; consult a CPA.
Schools (NCES district)
- District
- Lee
- NCES district ID
- 1201080
- Math proficiency
- 47% ▼ -11.00%
- Reading proficiency
- 50% ▼ -4.00%
- Median HH income
- $49,518
- Composite
- 41.49/100
- National rank
- #3458
- State rank
- #42 of 73 in FL
Livability — Fort Myers
- Score
- 86/100
- State rank
- #14
- US rank
- #383
Category grades
Schools grade is shown separately in the Schools card above.
Census & demographics
- Census place
- Fort Myers, FL
- County
- Lee County · 788,662 people
- City population
- 278,598
- Metro
- Cape Coral-Fort Myers, FL
- Population (ZIP)
- 27,943
- Household income
- $52,586
- Rent vs Own
- Severe rent burden
- 2324.0
Population outlook (Lee County) Hauer SSP2
- Today (2025)
- 871,946 people
- By 2030
- 955,468 · +9.6%
- By 2040
- 1,113,587 · +27.7%
- By 2050
- 1,256,891 · +44.1%
- By 2075
- 1,560,270 · +78.9%
- By 2100
- 1,726,848 · +98.0%
Race, ethnicity, and origin ACS 2023
- Neighborhood character
- Highly diverse neighborhood (Simpson 0.71)
- Race & ethnicity
- Black 34% Hispanic / Latino 30% White 28% Two or more races 21% Asian 2%
- Hispanic origin (detail)
- Mexican 5% Puerto Rican 6% Cuban 7% Dominican 1%
- Common ancestry
- Estonian 3% Hispanic 1% Romanian 1%
- Foreign-born
- 22% · Canada, Vietnam, China
- Languages at home
- 69% English-only · Spanish 24% Other Indo-European 4% French/Haitian/Cajun 1%
Political lean MEDSL · Lee
- 2024 margin
- Strong R (+28.4) · D 35.5% · R 63.9%
- 2008→2024 swing
- -18.0pp toward R · 2008: -10.4pp · 2024: -28.4pp
- All cycles
- 2024: R+28.4 2020: R+19.2 2016: R+20.4 2012: R+16.6 2008: R+10.4
Not yet ingested
- Civics
- —
Market trends
- HPI YoY
- ▼ -95.73%
- Current HPI
- 243.2657
- Rent YoY
- ▼ -4.30%
- Metro
- Cape Coral-Fort Myers, FL
- State GDP YoY
- ▲ 3.28%
- F500 in state
- 36
Industry mix (Fortune 500 HQ in FL)
| Industry | F500 HQs | Revenue |
|---|---|---|
| Industrial Technology | 2 | $29B |
|
||
| Insurance | 2 | $17B |
|
||
| Retail | 1 | $60B |
|
||
| Technology Distribution | 1 | $58B |
|
||
| Homebuilding | 1 | $35B |
|
||
| Technology Manufacturing | 1 | $35B |
|
||
Price history
+298.6% since first listed22 events — show timeline
- 2026-04-20 Price Changed $174,995 FORTMLS
- 2026-04-15 Price Changed $179,000 FORTMLS
- 2026-04-09 Price Changed $191,500 FORTMLS
- 2026-03-16 Price Changed $179,995 FORTMLS
- 2026-03-06 Price Changed $189,999 FORTMLS
- 2026-03-01 Price Changed $196,495 FORTMLS
- 2026-02-26 Price Changed $199,995 FORTMLS
- 2026-02-19 Price Changed $204,999 FORTMLS
- 2026-02-17 Listed $219,000 FORTMLS
- 2022-08-12 Sold (MLS) $202,500 FORTMLS
- 2022-07-08 Pending — FORTMLS
- 2022-06-30 Listed $199,500 FORTMLS
- 2015-03-02 Price Changed $69,000 FORTMLS
- 2013-04-17 Price Changed $39,900 FORTMLS
- 2013-04-17 Sold (MLS) $37,500 FORTMLS
- 2006-08-04 Sold (Public Records) $91,000 Public Records
- 2005-06-04 Listing Removed — FORTMLS
- 2005-05-31 Sold (Public Records) $86,200 Public Records
- 2005-05-26 Sold (MLS) $86,105 FORTMLS
- 2005-03-04 Listed $69,000 FORTMLS
- 2005-01-21 Sold (MLS) $37,500 FORTMLS
- 2004-12-13 Price Changed $43,900 FORTMLS
Property tax history
+8.9%/yrLatest (2025): $2,232 · -2.3% YoY. Source: county tax records.
Cash-flow waterfall
monthlySold comps — $/sqft
last 12 mo · ≤1 miLoading sold comps…