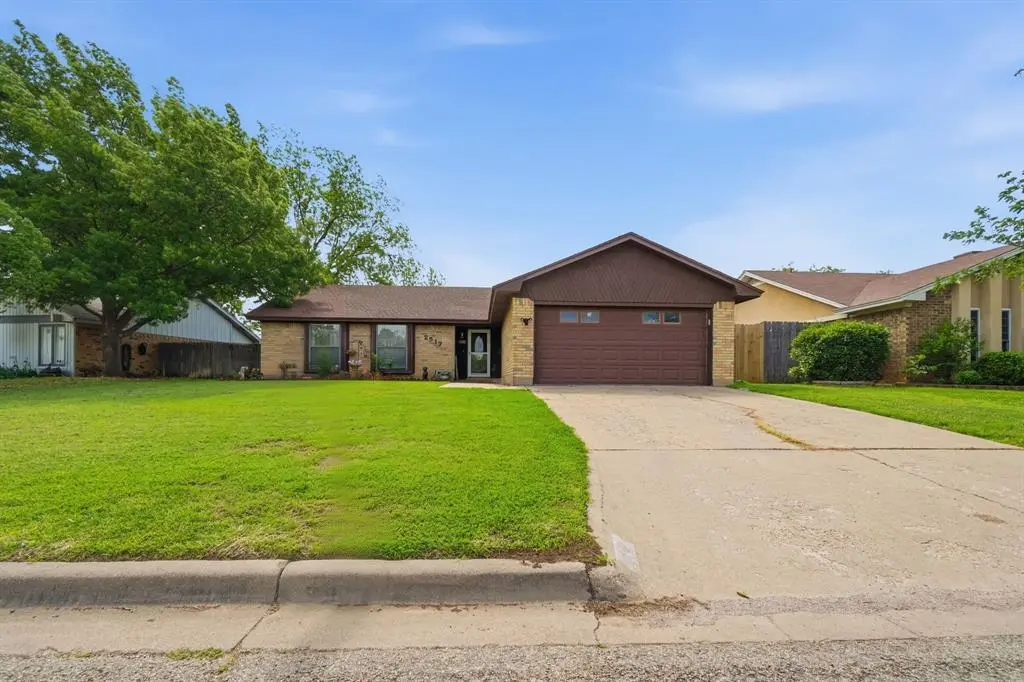
2517 Button Willow Pkwy · Abilene, TX
Flood risk 3/10 · Minor
- FEMA flood zone
- X (unshaded)
- Chance of flooding over 30 yrs
- 0.1%
- Est. flood insurance / yr
- $507 – $1,088
Fire risk 5/10 · Moderate
- Est. fire insurance / yr
- $1,222 – $2,270
Heat risk 6/10 · Moderate
- Hot days now (above 103°F)
- 7 days/yr
- Hot days in 30 yrs
- 23 days/yr
Wind risk 4/10 · Minor
- Chance of severe wind over 30 yrs
- 13.0%
Air-quality risk 1/10 · Minimal
- Unhealthy air days now
- 0 days/yr
- Unhealthy air days in 30 yrs
- 0 days/yr
Risk factors via First Street. Map © Google.
Why this score? — see what drove the B+ grade
The composite is a weighted blend of 9 inputs, each scored 0–100. Each bar is that input's sub-score; the figure is the points it added to the 100-point composite (weight × sub-score).
- Cash flow +28.6/30.0
- ARV discount +14.6/15.0
- DSCR +10.0/10.0
- 1% rule +8.6/10.0
- Rent growth +5.0/5.0
- Livability +3.8/5.0
- Schools +2.8/10.0
- Condition / age +2.5/5.0
- Appreciation +0.0/10.0
$239,900
🖨 Deal sheet 📄 Offer letter ✓ Due diligence
Listing remarks MLS
Light, Bright and Move In Ready! Anticipate the Texas summer with this super clean, conveniently located, 1700ft+ family home with a POOL! Extras include built in living room shelving, crown molding, newer appliances and great storage solutions in the master closet. The roof will also be replaced. Sellers have been transferred and are highly motivated!
Key facts
- New tile flooring
- Formal dining space
- New dishwasher
Tags
Neighborhood map
What this means for you Summary
Snapshot
- This is a 3-bed/2.0-bath single-family listed at $240k.
Deal economics
- At list price, monthly cash flow is $792 ($10k/yr) — positive.
- The deal already cash-flows at list — no discount required.
- Meets the 1% rule at list price ($3k rent vs $240k).
- Cap rate 10.3% vs local median 6.7% in Abilene — top-decile yield for the area; either an underpriced asset or a hidden risk that comps aren't pricing in. Stress-test before assuming the spread holds.
Location & tenants
- Location reads 75/100 on livability (#142 in TX, #4,037 nationally) — a middle-class / working-renter tenant base. Strengths: cost of living A+, housing A+, health & safety A+; Watch: crime D, commute F.
- Abilene ISD (urban): math 32% / reading 34% proficiency, ranked #575 of 826 in TX (top 70%) — families likely to look elsewhere, expect single-tenant / working-renter base with shorter leases.
- Zoned schools: Ward El (math 38% / reading 40%, grade F, #1,651 of 4,322 statewide, top 39%, 494 students, 52% FRL).
- Market conditions: Rents rising fast (+40.7%/yr); 288 active listings in the ZIP; 7 comparable units currently listed for rent nearby; rentals leasing fast (median 13d on market — plan ~1-2 weeks tenant-placement turnaround); solid renter incomes; 508 units permitted in Taylor County in 2024 (0 in 5+ unit buildings).
- At $3,269/mo this rent would consume 50% of the median local household income ($79k/yr) (locally 1181% of renters already pay >50% of income on rent) — very limited rent-growth headroom before tenants either downsize or default.
Forward outlook
- Local home prices are declining (-3.0%/yr); year-one equity from $2k of loan paydown is wiped out by about $7k of value loss. Plan a longer hold.
- Taylor County population projected at +16% by 2050 — long-run rental-demand tailwind backs the buy-and-hold thesis.
- At projected returns (-3.0% appreciation + 8.0% rent growth), your $67k cash investment doubles in ~6 years — after that, you're playing with house money.
Negotiation context
- Only 8 days on market — expect competitive offers; lowballing is unlikely to land.
- 5 sale attempts since 19y ago with the ask held roughly flat each time — persistent listings suggest the price (not the market) is what's stuck; bring a comps-based counter.
Risks & watch-outs
- Climate carrying-cost: moderate wildfire risk; extreme-heat days projected 7→23/yr by 2055 (HVAC capex compounding) — expect insurance premiums to compound above CPI over the hold.
Questions for the listing agent
- Built in 1979 — when were the roof, HVAC, electrical panel, plumbing, and water heater last replaced?
- Is there a deadline driving the sale (1031 exchange, divorce, estate, relocation)? That informs how much negotiation room exists.
- Schools are D-rated, which usually means shorter tenancies and higher turnover. Who's the typical renter profile here, and what's been the actual vacancy rate?
- Crime grade is D in this area — have there been break-ins, vandalism, or insurance claims at this property in the last 3 years? What carrier currently insures it and at what premium?
- What's the average days-on-market for RENTAL listings here right now (not sales)? A rising rental-DOM trend means longer vacancies and softer asking-rent achievability than the comps imply.
- What's the recent tenant-quality profile in this submarket — average credit score on applications, eviction rate, late-payment / NSF rate, and stable-employment percentage? A property-management company in the area should have these aggregated.
- How much new for-sale + rental construction is in the pipeline within 1–3 miles? Heavy new supply typically softens prices + rents 12–24 months out; constrained supply supports both.
Investment metrics
- 1% rule
- 1.36% ✓
- Cap rate
- 10.25%
- Cash-on-cash
- 14.14%
- DSCR
- 1.63
- GRM
- 6.1
CMA / ARV
- ARV (on-the-fly)
- $284,648
- Comps found
- 12
Show comp detail 12 sales within ~0.75 mi
| Address | Dist | Beds/Ba | Sqft | Sold | Price | $/sf | Match |
|---|---|---|---|---|---|---|---|
| 2517 Button Willow Pkwy | 0.00mi | 3/2.0 | 1,768 (0%) | 0mo | $239,900 | $136 | 100 |
| 5201 Sherbrooke Ln | 0.22mi | 3/2.0 | 1,728 (-2%) | 1mo | $299,000 | $173 | 85 |
| 2941 Red Oak Cir | 0.35mi | 3/2.0 | 1,811 (+2%) | 2mo | $289,000 | $160 | 78 |
| 2618 Button Willow Ave | 0.05mi | 3/2.0 | 1,551 (-12%) | 1mo | $190,000 | $123 | 76 |
| 2317 Gilmer Ave | 0.30mi | 3/2.5 | 1,887 (+7%) | 1mo | $279,900 | $148 | 72 |
| 4701 Circle Nineteen | 0.56mi | 3/2.0 | 1,739 (-2%) | 2mo | $330,000 | $190 | 70 |
| 3034 Broken Bough Trl | 0.29mi | 3/2.0 | 1,595 (-10%) | 2mo | $299,900 | $188 | 68 |
| 4326 Caprock Rd | 0.61mi | 3/2.0 | 1,832 (+4%) | 1mo | $280,000 | $153 | 64 |
| 3142 Winter Hawk Dr | 0.72mi | 3/2.0 | 1,832 (+4%) | 2mo | $309,900 | $169 | 59 |
| 2634 Robertson Dr | 0.62mi | 3/2.0 | 1,644 (-7%) | 2mo | $235,000 | $143 | 57 |
| 2549 Woodlake Dr | 0.48mi | 3/2.5 | 1,969 (+11%) | 2mo | $374,900 | $190 | 55 |
| 3124 Primrose Dr | 0.70mi | 3/2.0 | 1,924 (+9%) | 1mo | $309,900 | $161 | 51 |
Match score weights: distance 35% · size 25% · config 20% · recency 20%. Top-matched comps best support the ARV.
Projected returns pro-forma
-3.0% appreciation · 8.0% rent growth · sell at horizon
- IRR
- 10.3%
- Equity multiple
- 1.43×
- Total profit
- $28,959
- Equity at exit
- $35,770
- IRR
- 23.3%
- Equity multiple
- 3.52×
- Total profit
- $169,317
- Equity at exit
- $20,742
Cash invested: $67,172 (down + closing). Projections, not guarantees.
Landlord ↔ Tenant lean methodology
- Overall (STATE)
- 87 Strongly Landlord-Friendly
- State Texas
- 87 Strongly Landlord-Friendly · R+5
- County
- — inherits STATE
- City
- — inherits STATE
ZIP-level market 79606
- Rents YoY
- 40.7%
- Active inventory
- 288
- Price-to-rent
- 6.1×
Monthly cashflow live
- Estimated rent
- $3,269 high interval (Pro) →
- Mortgage (P&I)
- −$1,258
- Tax from tax record
- −$433 /mo · $5,197/yr
- Insurance
- −$100
- HOA
- −$0
- Vacancy / Maint / Mgmt
- −$687
- Net cashflow
- $792
Break-even live
UW: 25.0% down · 7.5% · 30yr · 1.5% tax · 5.0% vac · 8.0% maint · 8.0% mgmt
Financing live
Cash to close
- Down payment
- $59,975
- Closing costs
- $7,197
- Reserves months
- —
- Total cash needed
- —
Loan-product check · same deal, 3 products live
Conventional
25% down · 7.5% · 30yr
- Down + closing
- —
- Monthly P&I
- —
- Monthly cashflow
- —
- DSCR
- —
- Eligible?
- —
Personal DTI + credit; lowest rate.
DSCR
20% down · 8.5% · 30yr
- Down + closing
- —
- Monthly P&I
- —
- Monthly cashflow
- —
- DSCR
- —
- Eligible?
- —
No personal income docs; deal must DSCR.
Hard money
10% down · 12.0% · 12mo
- Down + closing
- —
- Monthly P&I
- —
- Monthly cashflow
- —
- DSCR
- —
- Eligible?
- —
Short-term bridge; refi at stabilization.
Rent comps 7 comps
| Address | Beds | Baths | Sqft | Rent | $/sqft | DOM | Units | Dist |
|---|---|---|---|---|---|---|---|---|
| 2418 Helena Cir Abilene, TX | 4.0 | 2.5 | 2478 | $3,700 | $1.49 | 10d | 1 | 0.26mi |
| 2510 Gilmer Ave Abilene, TX | 3.0 | 2.0 | 1974 | $2,995 | $1.52 | 43d | 1 | 0.33mi |
| 3134 Winterhawk Dr Abilene, TX | 3.0 | 2.0 | 1800 | $2,795 | $1.55 | 7d | 1 | 0.71mi |
| 5733 Legacy Dr Abilene, TX | 3.0 | 2.0 | 1843 | $5,000 | $2.71 | 4d | 1 | 0.77mi |
| 5400 Ridgeline Dr Abilene, TX | 3.0 | 2.0 | 2571 | $6,000 | $2.33 | 24d | 1 | 0.95mi |
| 3826 Crest Way Abilene, TX | 3.0 | 2.0 | 1721 | $2,695 | $1.57 | 43d | 1 | 1.08mi |
| 4617 Catclaw Dr Abilene, TX | 4.0 | 2.0 | 2263 | $2,500 | $1.10 | 13d | 1 | 1.21mi |
Listing history 19 events
-
2026-04-28status Pending
-
2026-04-23historical Active Option Contract
-
2026-04-20$239,900 Active
-
2025-08-25historical
-
2025-07-25price $231,900
-
2025-06-16price $234,900
-
2025-01-22$239,900 Active
-
2012-06-05soldstatus
-
2012-06-04soldstatus 354-char remark
Show marketing remark (354 chars)
Light, Bright and Move In Ready! Anticipate the Texas summer with this super clean, conveniently located, 1700ft+ family home with a POOL! Extras include built in living room shelving, crown molding, newer appliances and great storage solutions in the master closet. The roof will also be replaced. Sellers have been transferred and are highly motivated!
-
2012-05-01historical 354-char remark
Show marketing remark (354 chars)
Light, Bright and Move In Ready! Anticipate the Texas summer with this super clean, conveniently located, 1700ft+ family home with a POOL! Extras include built in living room shelving, crown molding, newer appliances and great storage solutions in the master closet. The roof will also be replaced. Sellers have been transferred and are highly motivated!
-
2012-01-02$129,000 354-char remark
Show marketing remark (354 chars)
Light, Bright and Move In Ready! Anticipate the Texas summer with this super clean, conveniently located, 1700ft+ family home with a POOL! Extras include built in living room shelving, crown molding, newer appliances and great storage solutions in the master closet. The roof will also be replaced. Sellers have been transferred and are highly motivated!
-
2010-09-25historical
-
2010-06-14$129,500
-
2007-04-17soldstatus
-
2007-04-13soldstatus
-
2007-03-30historical
-
2007-01-04$135,000
-
2005-07-19soldstatus
-
1997-09-23soldstatus
ⓘ Source: listings_history table (triggers on properties + properties_extension) + one-shot
backfill from property_details.listing_events for pre-trigger history.
Tax reassessment forecast TX · Resets to sale price
- Current annual tax
- $5,197 · $433/mo
- Projected year-2 tax
- $5,197 · $433/mo
- Expected delta
- $0/yr ($0/mo · 0.0%)
ⓘ Screening estimate from a state-policy table — verify with the county assessor before closing.
Climate risk First Street
- Flood 3/10 Moderate FEMA zone X (unshaded) · 10% chance over 30 yrs
- Wildfire 5/10 Major
- Heat 6/10 Major 7 d/yr ≥103°F today · 23 d/yr by 30 yrs out
- Wind 4/10 Moderate 13% chance of damaging wind over 30 yrs
- Air quality 1/10 Low 0 unhealthy d/yr today · 0 by 30 yrs out
Nearby sold comps map
Loading sold comps map…
Walkable amenities ~0.75 mi
Loading nearby amenities…
Taxation est. · year 1
- Rental income
- $39,232
- − Mortgage interest
- −$13,438
- − Property taxes
- −$5,197
- − Insurance
- −$1,200
- − Repairs & maintenance
- −$3,139
- − Management
- −$3,139
- − Depreciation
- −$6,979
- Taxable income
- $6,142
- Est. tax owed @ 24.0%
- −$1,474
- After-tax cash flow
- $8,026/yr
For passive investors: Depreciation is non-cash, so a rental often shows a tax loss while cash-flowing — sheltering income. Rental losses are passive: they offset passive income freely, and up to $25,000/yr can offset ordinary (W-2) income if you actively participate and your MAGI is under $100k (phasing out to $0 by $150k); unused losses carry forward. On sale, claimed depreciation is recaptured at up to 25%, and gains may owe capital-gains tax (a 1031 exchange can defer both). Figures are a year-1 estimate at your 24.0% rate — not tax advice; consult a CPA.
Schools (NCES district)
- District
- Abilene ISD
- NCES district ID
- 4807440
- Math proficiency
- 32% ▼ -11.00%
- Reading proficiency
- 34% ▼ -5.00%
- Median HH income
- $39,782
- Composite
- 27.71/100
- National rank
- #6909
- State rank
- #575 of 826 in TX
Livability — Abilene
- Score
- 75/100
- State rank
- #142
- US rank
- #4037
Category grades
Schools grade is shown separately in the Schools card above.
Census & demographics
- Census place
- Abilene, TX
- County
- Taylor County · 136,672 people
- City population
- 136,672
- Metro
- Abilene, TX
- Population (ZIP)
- 29,182
- Household income
- $79,196
- Rent vs Own
- Severe rent burden
- 1181.0
Population outlook (Taylor County) Hauer SSP2
- Today (2025)
- 145,270 people
- By 2030
- 150,050 · +3.3%
- By 2040
- 159,417 · +9.7%
- By 2050
- 168,883 · +16.3%
- By 2075
- 194,436 · +33.8%
- By 2100
- 203,163 · +39.9%
Race, ethnicity, and origin ACS 2023
- Neighborhood character
- Predominantly White (69%)
- Race & ethnicity
- White 69% Hispanic / Latino 19% Two or more races 11% Black 6% Asian 4%
- Hispanic origin (detail)
- Mexican 14%
- Common ancestry
- Italian 4% Slovak 2% Serbian 1%
- Foreign-born
- 7% · Canada, Vietnam
- Languages at home
- 86% English-only · Spanish 10% Tagalog/Filipino 1% Other Indo-European 1%
Political lean MEDSL · Taylor
- 2024 margin
- Solid R (+49.8) · D 24.6% · R 74.4% · Other 1.0%
- 2008→2024 swing
- -4.2pp toward R · 2008: -45.6pp · 2024: -49.8pp
- All cycles
- 2024: R+49.8 2020: R+45.3 2016: R+51.1 2012: R+53.6 2008: R+45.6
Not yet ingested
- Civics
- —
Market trends
- HPI YoY
- ▼ -167.33%
- Current HPI
- 179.2555
- Rent YoY
- ▲ 40.73%
- Metro
- Abilene, TX
- State GDP YoY
- ▲ 3.95%
- F500 in state
- 110
Industry mix (Fortune 500 HQ in TX)
| Industry | F500 HQs | Revenue |
|---|---|---|
| Energy | 16 | $1,198B |
|
||
| Technology | 5 | $198B |
|
||
| Engineering / Construction | 4 | $72B |
|
||
| Energy Services | 3 | $60B |
|
||
| Utilities | 3 | $41B |
|
||
| Healthcare | 2 | $330B |
|
||
Price history
+77.7% since first listed19 events — show timeline
- 2026-04-28 Pending — NTREIS
- 2026-04-23 Contingent — NTREIS
- 2026-04-20 Listed $239,900 NTREIS
- 2025-08-25 Listing Removed — NTREIS
- 2025-07-25 Price Changed $231,900 NTREIS
- 2025-06-16 Price Changed $234,900 NTREIS
- 2025-01-22 Listed $239,900 NTREIS
- 2012-06-05 Sold (Public Records) — Public Records
- 2012-06-04 Sold (MLS) — NTREIS
- 2012-05-01 Listing Removed — NTREIS
- 2012-01-02 Listed $129,000 NTREIS
- 2010-09-25 Listing Removed — NTREIS
- 2010-06-14 Listed $129,500 NTREIS
- 2007-04-17 Sold (Public Records) — Public Records
- 2007-04-13 Sold (MLS) — NTREIS
- 2007-03-30 Listing Removed — NTREIS
- 2007-01-04 Listed $135,000 NTREIS
- 2005-07-19 Sold (Public Records) — Public Records
- 1997-09-23 Sold (Public Records) — Public Records
Property tax history
+4.4%/yrLatest (2025): $5,197 · +7.1% YoY. Source: county tax records.
Cash-flow waterfall
monthlySold comps — $/sqft
last 12 mo · ≤1 miLoading sold comps…