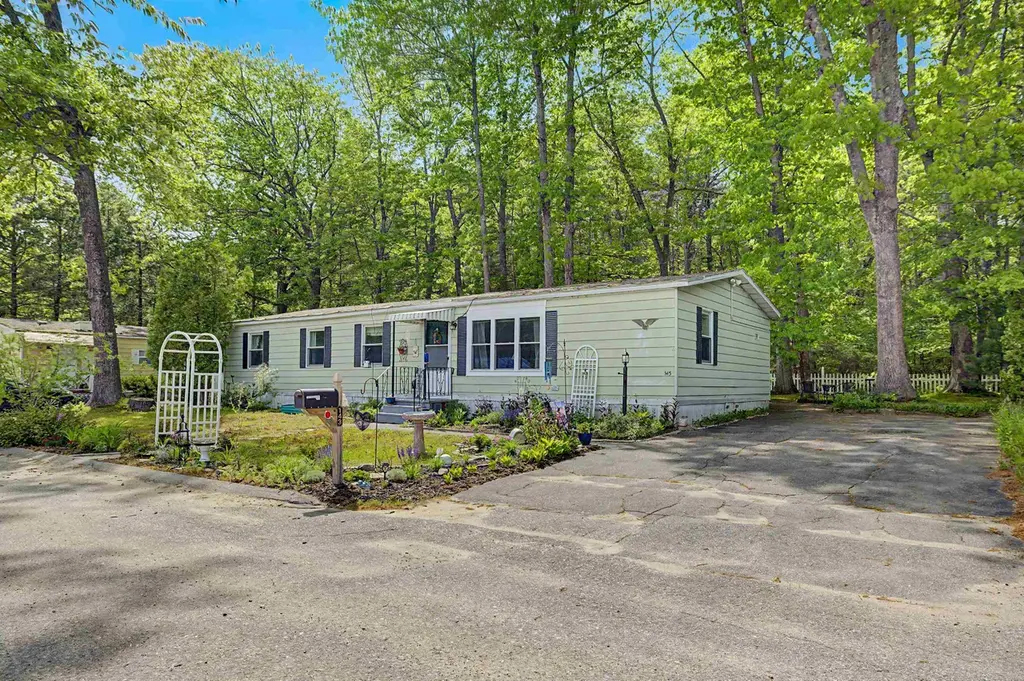
143 Robin Hood Dr · Exeter, NH
Flood risk No data
- FEMA flood zone
- —
- Chance of flooding over 30 yrs
- —
- Est. flood insurance / yr
- —
Fire risk No data
- Est. fire insurance / yr
- —
Heat risk No data
- Hot days now (above threshold)
- —
- Hot days in 30 yrs
- —
Wind risk No data
- Chance of severe wind over 30 yrs
- —
Air-quality risk No data
- Unhealthy air days now
- —
- Unhealthy air days in 30 yrs
- —
Risk factors via First Street. Map © Google.
Why this score? — see what drove the B+ grade
The composite is a weighted blend of 9 inputs, each scored 0–100. Each bar is that input's sub-score; the figure is the points it added to the 100-point composite (weight × sub-score).
- Cash flow +27.5/30.0
- ARV discount +15.0/15.0
- 1% rule +10.0/10.0
- DSCR +9.6/10.0
- Schools +4.6/10.0
- Livability +4.5/5.0
- Rent growth +2.5/5.0
- Condition / age +2.5/5.0
- Appreciation +0.0/10.0
$169,000
🖨 Deal sheet 📄 Offer letter ✓ Due diligence
Listing remarks MLS
BACK ON MARKET due to buyer not approved by Park! Large and spacious Double Wide 8 room/3 bedroom/ 2 Full bath Home, 1344 sq. ft. plus a Large Sun Room that overlooks private back yard with views of woods and nature! The Home is full of natural light, gets sun most of the day. Master bedroom suite with walk in closet, large bathroom with soaking tub, and separate, private "throne room"! 2 bedrooms each with large closets. There are 2 separate rooms off Kitchen, one can be your dining room, the other could be an office, den, craft room or whatever you desire. Large Shed for outdoor storage included. Painting the paneling & Kitchen cabinets would update and transform this home! Parking for 4 cars! Sale is to settle an Estate, property sold as seen, as is. AGE RESTRICTED: One person must be 55 or over and no one under 45 can live in the park. Cats and dogs allowed, breed and weight restrictions on dogs. SHOWINGS: call or text agent for instructions
Key facts
- All season porch
- Updated flooring
- Private full bath
Tags
Property features AI
Finance
- Other: Property is in the River Run Community (privately maintained, paved roads)
- HOA & community: Monthly community/park fee of $900 covering landscaping, plowing, sewer, trash and park rent; One-time buy-in fee of $350; Community amenities include clubhouse, landscaping, snow removal and trash removal
Exterior
- Parking: Paved driveway
- Utilities: Public sewer; Community water; 200 Amp electric service (Unitil); Cable available; High-speed internet available (including cable); Oil fuel service (Midway Oil)
- Home design: Manufactured home (Manuf/Mobile style); Located in River Run Community; Mobile park approved
- Construction: Built in 1977; Aluminum siding; Asphalt shingle roof; Manufactured home structure
- Exterior features: Neighborhood lot setting; Driveway is paved
Interior
- Kitchen: Dishwasher; Electric range / stove; Refrigerator
- Bedrooms: Three bedrooms (all on main level); One bedroom includes a private bath
- Flooring: Carpet; Hardwood; Laminate; Tile; Vinyl plank
- Bathrooms: 2 full bathrooms (both on main level)
- Heating & cooling: Forced air heating (oil); Central air conditioning
- Interior features: 7 total rooms; Living room; Dining room; Kitchen/Dining area; Laundry room
- Laundry & utility: Laundry room on main level; Water heater (domestic)
Neighborhood map
What this means for you Summary
Snapshot
- This is a 3-bed/2.0-bath manufactured listed at $169k.
Deal economics
- At list price, monthly cash flow is $499 ($6k/yr) — positive.
- The deal already cash-flows at list — no discount required.
- Meets the 1% rule at list price ($3k rent vs $169k).
- Recommended offer: $166k (1.5% below list) — sets the bar for market timing.
- Cap rate 9.8% vs local median 2.8% in Exeter — top-decile yield for the area; either an underpriced asset or a hidden risk that comps aren't pricing in. Stress-test before assuming the spread holds.
Location & tenants
- Location reads 91/100 on livability (#1 in NH, #59 nationally) — a professional / high-income tenant draw. Strengths: crime A+, amenities A+, commute A+.
- Exeter School District (suburban): math 46% / reading 57% proficiency, ranked #32 of 98 in NH (top 33%) — acceptable for families but not a draw, mixed tenant base, ~2y average lease; only 13% free/reduced lunch — higher-income household profile.
- Market conditions: 142 active listings in the ZIP; 2 comparable units currently listed for rent nearby; high-income renter base; 1,276 units permitted in Rockingham County in 2024 (593 in 5+ unit buildings).
- This rent runs 33% of the median local income ($119k/yr) — at the standard rent-burdened threshold; future hikes will face affordability resistance.
Forward outlook
- Local home prices are declining (-3.0%/yr); year-one equity from $1k of loan paydown is wiped out by about $5k of value loss. Plan a longer hold.
- At projected returns (-3.0% appreciation + 3.0% rent growth), your $47k cash investment doubles in ~9 years — after that, you're playing with house money.
Negotiation context
- It's been on market 20 days — a 2% lower offer ($166k) is reasonable based on typical stale-listing flexibility.
- 4 sale attempts since 28y ago with the ask held roughly flat each time — persistent listings suggest the price (not the market) is what's stuck; bring a comps-based counter.
- Current owner paid $80k; list at $169k implies a 111% gain — meaningful room to come down on a strong offer.
Risks & watch-outs
- Watch-outs: HOA is 27% of rent.
Questions for the listing agent
- Built in 1977 — when were the roof, HVAC, electrical panel, plumbing, and water heater last replaced?
- What does the HOA fee cover, when was the last increase, and are there any pending special assessments or reserve-fund shortfalls?
- Is there a deadline driving the sale (1031 exchange, divorce, estate, relocation)? That informs how much negotiation room exists.
- Schools are A-rated — typically a magnet for longer-tenancy family renters. What's the average tenant stay here, and is there a school-zone premium baked into asking?
- What's the average days-on-market for RENTAL listings here right now (not sales)? A rising rental-DOM trend means longer vacancies and softer asking-rent achievability than the comps imply.
- What's the recent tenant-quality profile in this submarket — average credit score on applications, eviction rate, late-payment / NSF rate, and stable-employment percentage? A property-management company in the area should have these aggregated.
- How much new for-sale + rental construction is in the pipeline within 1–3 miles? Heavy new supply typically softens prices + rents 12–24 months out; constrained supply supports both.
Investment metrics
- 1% rule
- 1.96% ✓
- Cap rate
- 9.84%
- Cash-on-cash
- 12.66%
- DSCR
- 1.56
- GRM
- 4.2
CMA / ARV
- ARV (on-the-fly)
- $216,384
- Comps found
- 12
Show comp detail 12 sales within ~0.75 mi
| Address | Dist | Beds/Ba | Sqft | Sold | Price | $/sf | Match |
|---|---|---|---|---|---|---|---|
| 23 Juniper St | 0.07mi | 3/2.0 | 1,344 (0%) | 6mo | $260,000 | $193 | 92 |
| 220 Robin Hood Dr #220 | 0.20mi | 3/2.0 | 1,352 (+1%) | 0mo | $187,500 | $139 | 89 |
| 605 Canterbury Dr | 0.12mi | 3/2.0 | 1,372 (+2%) | 5mo | $125,000 | $91 | 86 |
| 609 Canterbury Dr | 0.05mi | 2/2.0 (-1) | 1,464 (+9%) | 1mo | $250,000 | $171 | 77 |
| 104 Robin Hood Dr | 0.38mi | 3/2.0 | 1,296 (-4%) | 1mo | $239,900 | $185 | 76 |
| 426 Friar Tuck Dr | 0.06mi | 2/2.0 (-1) | 1,464 (+9%) | 2mo | $150,000 | $102 | 75 |
| 75 Hilton Ave | 0.15mi | 3/2.0 | 1,188 (-12%) | 0mo | $272,000 | $229 | 73 |
| 28 Wayland Cir | 0.46mi | 3/2.0 | 1,342 (-0%) | 7mo | $168,000 | $125 | 73 |
| 807 Nottingham Dr | 0.12mi | 2/1.5 (-1) | 1,230 (-8%) | 2mo | $85,000 | $69 | 72 |
| 6 Dow St | 0.29mi | 3/1.0 | 1,170 (-13%) | 1mo | $190,000 | $162 | 60 |
| 97 Linden St #4 | 0.37mi | 3/2.0 | 1,152 (-14%) | 4mo | $185,500 | $161 | 56 |
| 49 Lindenshire Ave | 0.55mi | 2/1.0 (-1) | 1,204 (-10%) | 6mo | $152,000 | $126 | 43 |
Match score weights: distance 35% · size 25% · config 20% · recency 20%. Top-matched comps best support the ARV.
Projected returns pro-forma
-3.0% appreciation · 3.0% rent growth · sell at horizon
- IRR
- 2.8%
- Equity multiple
- 1.11×
- Total profit
- $5,044
- Equity at exit
- $25,198
- IRR
- 12.6%
- Equity multiple
- 2.01×
- Total profit
- $47,917
- Equity at exit
- $14,612
Cash invested: $47,320 (down + closing). Projections, not guarantees.
Landlord ↔ Tenant lean methodology
- Overall (STATE)
- 56 Moderately Landlord-Leaning
- State New Hampshire
- 56 Moderately Landlord-Leaning · D+1
- County
- — inherits STATE
- City
- — inherits STATE
ZIP-level market 03833
- Active inventory
- 142
- Price-to-rent
- 4.2×
Monthly cashflow live
- Estimated rent
- $3,318 medium interval (Pro) →
- Mortgage (P&I)
- −$886
- Tax from tax record
- −$266 /mo · $3,187/yr
- Insurance
- −$70
- HOA
- −$900
- Vacancy / Maint / Mgmt
- −$697
- Net cashflow
- $499
Break-even live
UW: 25.0% down · 7.5% · 30yr · 1.5% tax · 5.0% vac · 8.0% maint · 8.0% mgmt
Financing live
Cash to close
- Down payment
- $42,250
- Closing costs
- $5,070
- Reserves months
- —
- Total cash needed
- —
Loan-product check · same deal, 3 products live
Conventional
25% down · 7.5% · 30yr
- Down + closing
- —
- Monthly P&I
- —
- Monthly cashflow
- —
- DSCR
- —
- Eligible?
- —
Personal DTI + credit; lowest rate.
DSCR
20% down · 8.5% · 30yr
- Down + closing
- —
- Monthly P&I
- —
- Monthly cashflow
- —
- DSCR
- —
- Eligible?
- —
No personal income docs; deal must DSCR.
Hard money
10% down · 12.0% · 12mo
- Down + closing
- —
- Monthly P&I
- —
- Monthly cashflow
- —
- DSCR
- —
- Eligible?
- —
Short-term bridge; refi at stabilization.
Rent comps 2 comps
| Address | Beds | Baths | Sqft | Rent | $/sqft | DOM | Units | Dist |
|---|---|---|---|---|---|---|---|---|
| 216B Front St Exeter, NH | 4.0 | 2.0 | 1700 | $3,495 | $2.06 | 2d | 1 | 1.08mi |
| 23 Garfield St Exeter, NH | 3.0 | 2.0 | 1853 | $3,800 | $2.05 | 2d | 1 | 1.26mi |
HOA detail
- Monthly dues
- $900 · $10,800/yr
Listing history 14 events
-
2026-06-18days on market $169,000 Active 20 DOM
-
2026-06-17days on market $169,000 Active 19 DOM
-
2026-06-16days on market $169,000 Active 18 DOM
-
2026-06-15days on market $169,000 Active 17 DOM
-
2026-06-13days on market $169,000 Active 15 DOM
-
2026-06-13days on market $169,000 Active 14 DOM
-
2026-06-09days on market $169,000 Active 11 DOM
-
2026-06-08days on market $169,000 Active 10 DOM
-
2026-06-07days on market $169,000 Active 9 DOM
-
2026-06-04days on market $169,000 Active 6 DOM
-
2026-06-03days on market $169,000 Active 5 DOM
-
2026-06-02days on market $169,000 Active 4 DOM
-
2026-06-01days on market $169,000 Active 3 DOM
-
2026-05-31days on market $169,000 Active 2 DOM
ⓘ Source: listings_history table (triggers on properties + properties_extension) + one-shot
backfill from property_details.listing_events for pre-trigger history.
Tax reassessment forecast NH · Partial reset (capped growth)
- Current annual tax
- $3,187 · $266/mo
- Projected year-2 tax
- $3,436 · $286/mo
- Expected delta
- +$249/yr (+$21/mo · 7.8%)
ⓘ Screening estimate from a state-policy table — verify with the county assessor before closing.
Nearby sold comps map
Loading sold comps map…
Walkable amenities ~0.75 mi
Loading nearby amenities…
Taxation est. · year 1
- Rental income
- $39,819
- − Mortgage interest
- −$9,467
- − Property taxes
- −$3,187
- − Insurance
- −$845
- − Repairs & maintenance
- −$3,186
- − Management
- −$3,186
- − HOA
- −$10,800
- − Depreciation
- −$4,916
- Taxable income
- $4,233
- Est. tax owed @ 24.0%
- −$1,016
- After-tax cash flow
- $4,974/yr
For passive investors: Depreciation is non-cash, so a rental often shows a tax loss while cash-flowing — sheltering income. Rental losses are passive: they offset passive income freely, and up to $25,000/yr can offset ordinary (W-2) income if you actively participate and your MAGI is under $100k (phasing out to $0 by $150k); unused losses carry forward. On sale, claimed depreciation is recaptured at up to 25%, and gains may owe capital-gains tax (a 1031 exchange can defer both). Figures are a year-1 estimate at your 24.0% rate — not tax advice; consult a CPA.
Schools (NCES district)
- District
- Exeter School District
- NCES district ID
- 3302970
- Math proficiency
- 46% ▼ -21.00%
- Reading proficiency
- 57% ▼ -14.00%
- Median HH income
- $69,970
- Composite
- 45.9/100
- National rank
- #2549
- State rank
- #32 of 98 in NH
Livability — Exeter
- Score
- 91/100
- State rank
- #1
- US rank
- #59
Category grades
Schools grade is shown separately in the Schools card above.
Census & demographics
- Census place
- Exeter, NH
- County
- Rockingham County · 137,526 people
- City population
- 22,817
- Metro
- Boston-Cambridge-Newton, MA-NH
- Population (ZIP)
- 22,817
- Household income
- $119,393
- Rent vs Own
- Severe rent burden
- 485.0
Population outlook (Rockingham County) Hauer SSP2
- Today (2025)
- 316,118 people
- By 2030
- 320,929 · +1.5%
- By 2040
- 323,358 · +2.3%
- By 2050
- 314,977 · -0.4%
- By 2075
- 297,686 · -5.8%
- By 2100
- 256,363 · -18.9%
Race, ethnicity, and origin ACS 2023
- Neighborhood character
- Predominantly White (91%)
- Race & ethnicity
- White 91% Two or more races 4% Asian 3% Hispanic / Latino 2%
- Common ancestry
- Lithuanian 8% Slovak 5% Romanian 5%
- Foreign-born
- 6% · Canada, China, South Korea
- Languages at home
- 93% English-only · Spanish 2% Other Indo-European 1% German/W. Germanic 1%
Political lean MEDSL · Rockingham
- 2024 margin
- Toss-up / Even · D 48.3% · R 50.8%
- 2008→2024 swing
- -3.5pp toward R · 2008: 1.1pp · 2024: -2.4pp
- All cycles
- 2024: R+2.4 2020: D+2.1 2016: R+5.8 2012: R+4.5 2008: D+1.1
Not yet ingested
- Civics
- —
Market trends
- HPI YoY
- ▼ -202.07%
- Current HPI
- 288.0139
- Rent YoY
- —
- Metro
- Boston-Cambridge-Newton, MA-NH
- State GDP YoY
- —
- F500 in state
- 0
Price history
+204.5% since first listed10 events — show timeline
- 2026-05-29 Listed $169,000 PrimeMLS
- 2021-05-20 Sold (MLS) $80,000 PrimeMLS
- 2021-05-13 Pending — PrimeMLS
- 2021-05-11 Relisted — PrimeMLS
- 2021-05-01 Pending — PrimeMLS
- 2021-04-20 Listed $69,900 PrimeMLS
- 1999-11-30 Sold (MLS) $55,000 PrimeMLS
- 1999-11-10 Sold (Public Records) $55,000 Public Records
- 1999-11-05 Delisted — PrimeMLS
- 1998-09-28 Listed $55,500 PrimeMLS
Property tax history
+14.5%/yrLatest (2025): $3,187 · +5.4% YoY. Source: county tax records.
Cash-flow waterfall
monthlySold comps — $/sqft
last 12 mo · ≤1 miLoading sold comps…