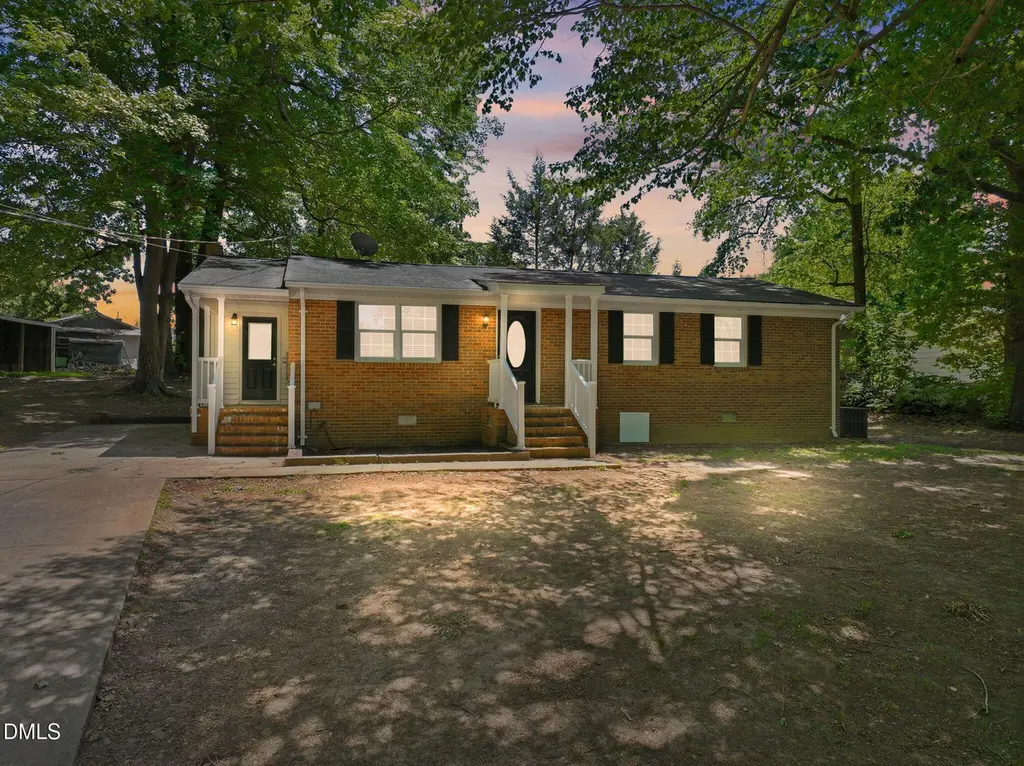
265 Shady Hill Cir · Roxboro, NC
Flood risk 1/10 · Minimal
- FEMA flood zone
- X (unshaded)
- Chance of flooding over 30 yrs
- 0.0%
- Est. flood insurance / yr
- $473 – $860
Fire risk 4/10 · Minor
- Est. fire insurance / yr
- $906 – $1,684
Heat risk 6/10 · Moderate
- Hot days now (above 103°F)
- 7 days/yr
- Hot days in 30 yrs
- 17 days/yr
Wind risk 5/10 · Moderate
- Chance of severe wind over 30 yrs
- 22.0%
Air-quality risk 2/10 · Minimal
- Unhealthy air days now
- 1 days/yr
- Unhealthy air days in 30 yrs
- 2 days/yr
Risk factors via First Street. Map © Google.
Why this score? — see what drove the C- grade
The composite is a weighted blend of 9 inputs, each scored 0–100. Each bar is that input's sub-score; the figure is the points it added to the 100-point composite (weight × sub-score).
- Cash flow +16.0/30.0
- ARV discount +8.9/15.0
- Appreciation +8.5/10.0
- DSCR +5.0/10.0
- Schools +3.4/10.0
- 1% rule +3.3/10.0
- Livability +2.8/5.0
- Rent growth +2.5/5.0
- Condition / age +2.5/5.0
$209,900
🖨 Deal sheet 📄 Offer letter ✓ Due diligence
Listing remarks
This charming brick ranch offers the perfect blend of comfort and style in a quiet, established neighborhood. Featuring 3 bedrooms, 1.5 baths, and a versatile bonus room, this home provides plenty of space for everyday living, a home office, playroom, or guest area. Fresh paint throughout gives the home a bright, updated feel, while the beautiful kitchen showcases crisp white cabinetry, stainless steel appliances, and timeless appeal. Step outside to enjoy the shaded backyard complete with a cozy fire pit -- the perfect spot for relaxing evenings or entertaining family and friends. This move-in ready home is one you won't want to miss!
Key facts
- Shaded backyard
- Cozy fire pit
- Versatile bonus room
Tags
Property features AI
Finance
- Other: Living area reported as 1,150; Property listed by Keller Williams Central
- HOA & community: No homeowners association; Not a senior community
Exterior
- Utilities: Public water; Septic tank sewer
- Home design: Site-built single-story home
- Construction: Brick veneer exterior; Built on a foundation consistent with site-built construction
- Exterior features: Shingle roof; Lot approximately 0.27 acres; Publicly maintained road access
Interior
- Bedrooms: Four bedrooms total, three of them on the main level
- Flooring: Carpet; Hardwood; Tile
- Bathrooms: One full bathroom; One half bathroom
- Heating & cooling: Forced air heating; Heat pump; Central air conditioning; Electric cooling
- Interior features: Carpet, hardwood and tile flooring
Neighborhood map
What this means for you Summary
Snapshot
- This is a 4-bed/1.5-bath single-family listed at $210k.
Deal economics
- At list price, monthly cash flow is $105 ($1k/yr) — positive.
- The deal already cash-flows at list — no discount required.
- To meet the 1% rule (rent ≥ 1% of price), the offer needs to be $174k (17.1% below list).
- Recommended offer: $174k (17.1% below list) — sets the bar for 1% rule.
- Cap rate 6.9% vs local median 4.5% in Roxboro — top-decile yield for the area; either an underpriced asset or a hidden risk that comps aren't pricing in. Stress-test before assuming the spread holds.
Location & tenants
- Location reads 55/100 on livability (#649 in NC) — a working-class tenant base; expect higher turnover. Strengths: cost of living A+; Watch: crime F, amenities F, commute F.
- Person County Schools (rural): math 39% / reading 42% proficiency, ranked #110 of 178 in NC (top 62%) — families likely to look elsewhere, expect single-tenant / working-renter base with shorter leases.
- Zoned schools: Person High (math 45% / reading 44%, grade F, #352 of 535 statewide, top 68%, 1,079 students, 60% FRL).
- Market conditions: 99 active listings in the ZIP; 113 units permitted in Person County in 2024 (0 in 5+ unit buildings).
Forward outlook
- In year one you build about $16k of equity ($1k loan paydown + $15k appreciation (7.0% local appreciation)).
- Person County population projected at -15% by 2050 — secular population decline; favor cash flow + early exit over multi-decade hold.
- At projected returns (7.0% appreciation + 3.0% rent growth), your $59k cash investment doubles in ~4 years — after that, you're playing with house money.
- By year 3, paydown + projected appreciation supports a ~$40k cash-out refi (75% LTV) — recoverable capital for the next deal without selling this one.
Negotiation context
- It's been on market 24 days — a 2% lower offer ($207k) is reasonable based on typical stale-listing flexibility.
Risks & watch-outs
- Climate carrying-cost: moderate wind risk, 22% chance of damaging wind over 30y; extreme-heat days projected 7→17/yr by 2055 (HVAC capex compounding) — expect insurance premiums to compound above CPI over the hold.
Questions for the listing agent
- Built in 1972 — when were the roof, HVAC, electrical panel, plumbing, and water heater last replaced?
- Is there a deadline driving the sale (1031 exchange, divorce, estate, relocation)? That informs how much negotiation room exists.
- Schools are D-rated, which usually means shorter tenancies and higher turnover. Who's the typical renter profile here, and what's been the actual vacancy rate?
- Crime grade is F in this area — have there been break-ins, vandalism, or insurance claims at this property in the last 3 years? What carrier currently insures it and at what premium?
- What's the average days-on-market for RENTAL listings here right now (not sales)? A rising rental-DOM trend means longer vacancies and softer asking-rent achievability than the comps imply.
- What's the recent tenant-quality profile in this submarket — average credit score on applications, eviction rate, late-payment / NSF rate, and stable-employment percentage? A property-management company in the area should have these aggregated.
- How much new for-sale + rental construction is in the pipeline within 1–3 miles? Heavy new supply typically softens prices + rents 12–24 months out; constrained supply supports both.
Investment metrics
- 1% rule
- 0.83% ✗
- Cap rate
- 6.90%
- Cash-on-cash
- 2.15%
- DSCR
- 1.10
- GRM
- 10.1
CMA / ARV
- ARV (on-the-fly)
- $216,733
- Comps found
- 11
Show comp detail 11 sales within ~0.75 mi
| Address | Dist | Beds/Ba | Sqft | Sold | Price | $/sf | Match |
|---|---|---|---|---|---|---|---|
| 121 Clayton St | 0.22mi | 3/2.0 (-1) | 1,206 (+4%) | 18mo | $228,000 | $189 | 61 |
| 132 Lillian Ct | 0.49mi | 3/2.0 (-1) | 1,202 (+4%) | 6mo | $224,488 | $187 | 59 |
| 86 Maggie Ln | 0.37mi | 3/2.0 (-1) | 1,265 (+9%) | 3mo | $219,000 | $173 | 58 |
| 123 Landon Pl | 0.51mi | 3/2.0 (-1) | 1,202 (+4%) | 8mo | $226,990 | $189 | 56 |
| 49 Eli Ct | 0.48mi | 3/2.0 (-1) | 1,185 (+2%) | 15mo | $249,900 | $211 | 54 |
| 252 Maggie Ln | 0.49mi | 3/2.0 (-1) | 1,202 (+4%) | 14mo | $225,990 | $188 | 52 |
| 224 Landon Pl | 0.61mi | 3/2.0 (-1) | 1,202 (+4%) | 7mo | $219,997 | $183 | 52 |
| 1701 Sunset St | 0.66mi | 3/2.0 (-1) | 1,152 (-1%) | 11mo | $60,000 | $52 | 52 |
| 119 Kerr Dr | 0.56mi | 3/1.0 (-1) | 1,165 (+0%) | 24mo | $165,000 | $142 | 46 |
| 348 Maggie Ln | 0.62mi | 3/2.0 (-1) | 1,202 (+4%) | 18mo | $223,100 | $186 | 43 |
| 1712 Wall St | 0.64mi | 3/2.0 (-1) | 1,120 (-3%) | 24mo | $223,000 | $199 | 38 |
Match score weights: distance 35% · size 25% · config 20% · recency 20%. Top-matched comps best support the ARV.
Projected returns pro-forma
7.01% appreciation · 3.0% rent growth · sell at horizon
- IRR
- 19.4%
- Equity multiple
- 2.36×
- Total profit
- $80,008
- Equity at exit
- $145,547
- IRR
- 18.4%
- Equity multiple
- 4.87×
- Total profit
- $227,351
- Equity at exit
- $276,558
Cash invested: $58,772 (down + closing). Projections, not guarantees.
Landlord ↔ Tenant lean methodology
- Overall (STATE)
- 85 Strongly Landlord-Friendly
- State North Carolina
- 85 Strongly Landlord-Friendly · R+3
- County
- — inherits STATE
- City
- — inherits STATE
ZIP-level market 27573
- Home prices YoY
- 2.5%
- Active inventory
- 99
- Price-to-rent
- 10.1×
Monthly cashflow live
- Estimated rent
- $1,739 medium interval (Pro) →
- Mortgage (P&I)
- −$1,101
- Tax from tax record
- −$81 /mo · $967/yr
- Insurance
- −$87
- HOA
- −$0
- Vacancy / Maint / Mgmt
- −$365
- Net cashflow
- $105
Break-even live
UW: 25.0% down · 7.5% · 30yr · 1.5% tax · 5.0% vac · 8.0% maint · 8.0% mgmt
Financing live
Cash to close
- Down payment
- $52,475
- Closing costs
- $6,297
- Reserves months
- —
- Total cash needed
- —
Loan-product check · same deal, 3 products live
Conventional
25% down · 7.5% · 30yr
- Down + closing
- —
- Monthly P&I
- —
- Monthly cashflow
- —
- DSCR
- —
- Eligible?
- —
Personal DTI + credit; lowest rate.
DSCR
20% down · 8.5% · 30yr
- Down + closing
- —
- Monthly P&I
- —
- Monthly cashflow
- —
- DSCR
- —
- Eligible?
- —
No personal income docs; deal must DSCR.
Hard money
10% down · 12.0% · 12mo
- Down + closing
- —
- Monthly P&I
- —
- Monthly cashflow
- —
- DSCR
- —
- Eligible?
- —
Short-term bridge; refi at stabilization.
Listing history 9 events
-
2026-06-09status $209,900 Pending 24 DOM
-
2026-06-08days on market $209,900 Active 24 DOM
-
2026-06-07days on market $209,900 Active 23 DOM
-
2026-06-05days on market $209,900 Active 21 DOM
-
2026-06-04days on market $209,900 Active 19 DOM
-
2026-06-02days on market $209,900 Active 18 DOM
-
2026-06-01days on market $209,900 Active 17 DOM
-
2026-05-31days on market $209,900 Active 16 DOM
-
2026-05-15$209,900 Active
ⓘ Source: listings_history table (triggers on properties + properties_extension) + one-shot
backfill from property_details.listing_events for pre-trigger history.
Tax reassessment forecast NC · Resets to sale price
- Current annual tax
- $967 · $81/mo
- Projected year-2 tax
- $1,721 · $143/mo
- Expected delta
- +$754/yr (+$63/mo · 78.0%)
ⓘ Screening estimate from a state-policy table — verify with the county assessor before closing.
Climate risk First Street
- Flood 1/10 Low FEMA zone X (unshaded) · 0% chance over 30 yrs
- Wildfire 4/10 Moderate
- Heat 6/10 Major 7 d/yr ≥103°F today · 17 d/yr by 30 yrs out
- Wind 5/10 Major 22% chance of damaging wind over 30 yrs
- Air quality 2/10 Low 1 unhealthy d/yr today · 2 by 30 yrs out
Nearby sold comps map
Loading sold comps map…
Walkable amenities ~0.75 mi
Loading nearby amenities…
Taxation est. · year 1
- Rental income
- $20,873
- − Mortgage interest
- −$11,758
- − Property taxes
- −$967
- − Insurance
- −$1,050
- − Repairs & maintenance
- −$1,670
- − Management
- −$1,670
- − Depreciation
- −$6,106
- Taxable loss
- −$2,347
- Est. tax savings @ 24.0%
- +$563
- After-tax cash flow
- $1,828/yr
For passive investors: Depreciation is non-cash, so a rental often shows a tax loss while cash-flowing — sheltering income. Rental losses are passive: they offset passive income freely, and up to $25,000/yr can offset ordinary (W-2) income if you actively participate and your MAGI is under $100k (phasing out to $0 by $150k); unused losses carry forward. On sale, claimed depreciation is recaptured at up to 25%, and gains may owe capital-gains tax (a 1031 exchange can defer both). Figures are a year-1 estimate at your 24.0% rate — not tax advice; consult a CPA.
Schools (NCES district)
- District
- Person County Schools
- NCES district ID
- 3703630
- Math proficiency
- 39% ▬ 0.00%
- Reading proficiency
- 42% ▲ 2.00%
- Median HH income
- $43,729
- Composite
- 34.3/100
- National rank
- #5242
- State rank
- #110 of 178 in NC
Livability — Roxboro
- Score
- 55/100
- State rank
- #649
- US rank
- #23536
Category grades
Schools grade is shown separately in the Schools card above.
Census & demographics
- City population
- 11,954
- Population (ZIP)
- 11,954
Population outlook (Person County) Hauer SSP2
- Today (2025)
- 38,577 people
- By 2030
- 37,847 · -1.9%
- By 2040
- 35,740 · -7.4%
- By 2050
- 32,683 · -15.3%
- By 2075
- 24,979 · -35.2%
- By 2100
- 15,779 · -59.1%
Race, ethnicity, and origin ACS 2023
- Neighborhood character
- Diverse neighborhood (Simpson 0.65)
- Race & ethnicity
- White 45% Black 36% Hispanic / Latino 11% Two or more races 11% Native American 2%
- Hispanic origin (detail)
- Mexican 9%
- Common ancestry
- Slovak 3% Romanian 2% Italian 1%
- Foreign-born
- 5% · Canada
- Languages at home
- 90% English-only · Spanish 8% Other Asian/Pacific 1% Other Indo-European 1%
Political lean MEDSL · Person
- 2024 margin
- Strong R (+23.7) · D 37.7% · R 61.4%
- 2008→2024 swing
- -15.2pp toward R · 2008: -8.5pp · 2024: -23.7pp
- All cycles
- 2024: R+23.7 2020: R+21.6 2016: R+17.3 2012: R+11.0 2008: R+8.5
Not yet ingested
- Civics
- —
Market trends
- HPI YoY
- ▲ 7.01%
- Current HPI
- 286.1496
- Rent YoY
- —
- Metro
- —
- State GDP YoY
- ▲ 3.28%
- F500 in state
- 26
Industry mix (Fortune 500 HQ in NC)
| Industry | F500 HQs | Revenue |
|---|---|---|
| Financial Services | 2 | $213B |
|
||
| Retail | 2 | $95B |
|
||
| Industrial Conglomerate | 1 | $38B |
|
||
| Metals / Steel | 1 | $35B |
|
||
| Utilities | 1 | $30B |
|
||
| Industrial Machinery | 1 | $19B |
|
||
Price history
1 event — show timeline
- 2026-05-15 Listed $209,900 TMLS
Property tax history
+10.4%/yrLatest (2025): $967 · +36.5% YoY. Source: county tax records.
Cash-flow waterfall
monthlySold comps — $/sqft
last 12 mo · ≤1 miLoading sold comps…