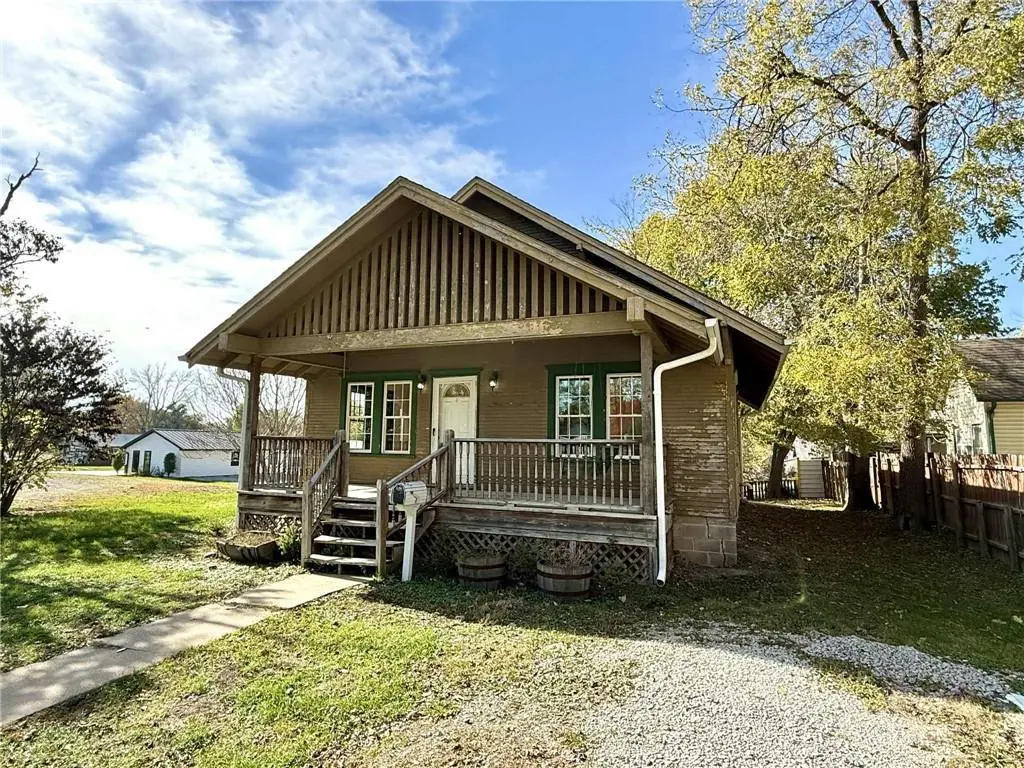
513 N Park St · Stanberry, MO
Flood risk 1/10 · Minimal
- FEMA flood zone
- X (unshaded)
- Chance of flooding over 30 yrs
- 0.0%
- Est. flood insurance / yr
- $473 – $860
Fire risk 1/10 · Minimal
- Est. fire insurance / yr
- $1,054 – $1,958
Heat risk 4/10 · Minor
- Hot days now (above 105°F)
- 7 days/yr
- Hot days in 30 yrs
- 15 days/yr
Wind risk 2/10 · Minimal
- Chance of severe wind over 30 yrs
- —
Air-quality risk 2/10 · Minimal
- Unhealthy air days now
- 0 days/yr
- Unhealthy air days in 30 yrs
- 1 days/yr
Risk factors via First Street. Map © Google.
Why this score? — see what drove the B grade
The composite is a weighted blend of 9 inputs, each scored 0–100. Each bar is that input's sub-score; the figure is the points it added to the 100-point composite (weight × sub-score).
- Cash flow +29.2/30.0
- DSCR +10.0/10.0
- 1% rule +8.0/10.0
- ARV discount +7.5/15.0
- Appreciation +5.0/10.0
- Schools +4.4/10.0
- Livability +3.5/5.0
- Rent growth +2.5/5.0
- Condition / age +2.5/5.0
$75,000
🖨 Deal sheet 📄 Offer letter ✓ Due diligence
Listing remarks MLS
Check out this 2-bedroom, 1-bath home featuring hardwood floors and a spacious kitchen with custom cabinetry. Enjoy small-town living with this conveniently located home—just steps from Stanberry R-2 School, churches, downtown amenities and restaurants. Ideal as a primary residence or an excellent investment property with strong rental potential. Schedule your showing today!
Key facts
- Custom cabinetry
- Spacious kitchen
- Hardwood floors
Tags
Neighborhood map
What this means for you Summary
Snapshot
- This is a 2-bed/3.0-bath other listed at $75k.
Deal economics
- At list price, monthly cash flow is $262 ($3k/yr) — positive.
- The deal already cash-flows at list — no discount required.
- Meets the 1% rule at list price ($977 rent vs $75k).
- Recommended offer: $66k (12.0% below list) — sets the bar for market timing.
Location & tenants
- Location reads 69/100 on livability (#152 in MO) — a middle-class / working-renter tenant base. Strengths: cost of living A+, housing A+, crime A-; Watch: amenities F, commute F, health & safety F.
- Stanberry R-II (rural): math 50% / reading 50% proficiency, ranked #119 of 535 in MO (top 22%) — acceptable for families but not a draw, mixed tenant base, ~2y average lease.
- Market conditions: 12 active listings in the ZIP; 3 units permitted in Gentry County in 2024 (0 in 5+ unit buildings).
Forward outlook
- In year one you build about $3k of equity ($519 loan paydown + $2k appreciation (3.0% local appreciation)).
- At projected returns (3.0% appreciation + 3.0% rent growth), your $21k cash investment doubles in ~4 years — after that, you're playing with house money.
Negotiation context
- It's been on market 164 days — a 12% lower offer ($66k) is reasonable based on typical stale-listing flexibility.
- 3 sale attempts since 5y ago with the ask held roughly flat each time — persistent listings suggest the price (not the market) is what's stuck; bring a comps-based counter.
Risks & watch-outs
- Watch-outs: built in 1930 — expect roof / HVAC / electrical / plumbing capex.
Questions for the listing agent
- It's been on market 164 days. Have you received any prior offers? Is the seller open to a 12% concession, seller financing, or rate buy-down credit?
- Built in 1930 — when were the roof, HVAC, electrical panel, plumbing, and water heater last replaced?
- Why hasn't it sold? Are there any deal-killer items the seller is aware of (foundation, flood, title, zoning, code violations)?
- Is there a deadline driving the sale (1031 exchange, divorce, estate, relocation)? That informs how much negotiation room exists.
- What's the average days-on-market for RENTAL listings here right now (not sales)? A rising rental-DOM trend means longer vacancies and softer asking-rent achievability than the comps imply.
- What's the recent tenant-quality profile in this submarket — average credit score on applications, eviction rate, late-payment / NSF rate, and stable-employment percentage? A property-management company in the area should have these aggregated.
- How much new for-sale + rental construction is in the pipeline within 1–3 miles? Heavy new supply typically softens prices + rents 12–24 months out; constrained supply supports both.
Investment metrics
- 1% rule
- 1.30% ✓
- Cap rate
- 10.48%
- Cash-on-cash
- 14.96%
- DSCR
- 1.67
- GRM
- 6.4
CMA / ARV
No comps found within radius.
Projected returns pro-forma
3.0% appreciation · 3.0% rent growth · sell at horizon
- IRR
- 21.5%
- Equity multiple
- 2.22×
- Total profit
- $25,722
- Equity at exit
- $33,723
- IRR
- 22.6%
- Equity multiple
- 4.25×
- Total profit
- $68,220
- Equity at exit
- $51,972
Cash invested: $21,000 (down + closing). Projections, not guarantees.
Landlord ↔ Tenant lean methodology
- Overall (STATE)
- 81 Strongly Landlord-Friendly
- State Missouri
- 81 Strongly Landlord-Friendly · R+10
- County
- — inherits STATE
- City
- — inherits STATE
ZIP-level market 64489
- Active inventory
- 12
- Price-to-rent
- 6.4×
Monthly cashflow live
- Estimated rent
- $977 medium interval (Pro) →
- Mortgage (P&I)
- −$393
- Tax from tax record
- −$86 /mo · $1,027/yr
- Insurance
- −$31
- HOA
- −$0
- Vacancy / Maint / Mgmt
- −$205
- Net cashflow
- $262
Break-even live
UW: 25.0% down · 7.5% · 30yr · 1.5% tax · 5.0% vac · 8.0% maint · 8.0% mgmt
Financing live
Cash to close
- Down payment
- $18,750
- Closing costs
- $2,250
- Reserves months
- —
- Total cash needed
- —
Loan-product check · same deal, 3 products live
Conventional
25% down · 7.5% · 30yr
- Down + closing
- —
- Monthly P&I
- —
- Monthly cashflow
- —
- DSCR
- —
- Eligible?
- —
Personal DTI + credit; lowest rate.
DSCR
20% down · 8.5% · 30yr
- Down + closing
- —
- Monthly P&I
- —
- Monthly cashflow
- —
- DSCR
- —
- Eligible?
- —
No personal income docs; deal must DSCR.
Hard money
10% down · 12.0% · 12mo
- Down + closing
- —
- Monthly P&I
- —
- Monthly cashflow
- —
- DSCR
- —
- Eligible?
- —
Short-term bridge; refi at stabilization.
Listing history 8 events
-
2026-06-02days on market $75,000 Active 164 DOM
-
2026-06-01days on market $75,000 Active 163 DOM
-
2026-05-31days on market $75,000 Active 162 DOM
-
2026-05-08status Active 383-char remark
Show marketing remark (383 chars)
Check out this 2-bedroom, 1-bath home featuring hardwood floors and a spacious kitchen with custom cabinetry. Enjoy small-town living with this conveniently located home—just steps from Stanberry R-2 School, churches, downtown amenities and restaurants. Ideal as a primary residence or an excellent investment property with strong rental potential. Schedule your showing today!
-
2026-03-23status Pending 383-char remark
Show marketing remark (383 chars)
Check out this 2-bedroom, 1-bath home featuring hardwood floors and a spacious kitchen with custom cabinetry. Enjoy small-town living with this conveniently located home—just steps from Stanberry R-2 School, churches, downtown amenities and restaurants. Ideal as a primary residence or an excellent investment property with strong rental potential. Schedule your showing today!
-
2025-11-04$75,000 Active 383-char remark
Show marketing remark (383 chars)
Check out this 2-bedroom, 1-bath home featuring hardwood floors and a spacious kitchen with custom cabinetry. Enjoy small-town living with this conveniently located home—just steps from Stanberry R-2 School, churches, downtown amenities and restaurants. Ideal as a primary residence or an excellent investment property with strong rental potential. Schedule your showing today!
-
2021-04-28soldstatus 233-char remark
Show marketing remark (233 chars)
Check out this starter home, close to School and downtown. Nice hard wood floors and nice big bedroom all at an affordable price. Wood stove in basement stays. This property would make a great income property or a nice 1st time home.
-
2021-02-26$50,000 233-char remark
Show marketing remark (233 chars)
Check out this starter home, close to School and downtown. Nice hard wood floors and nice big bedroom all at an affordable price. Wood stove in basement stays. This property would make a great income property or a nice 1st time home.
ⓘ Source: listings_history table (triggers on properties + properties_extension) + one-shot
backfill from property_details.listing_events for pre-trigger history.
Tax reassessment forecast MO · Resets to sale price
- Current annual tax
- $1,027 · $86/mo
- Projected year-2 tax
- $1,027 · $86/mo
- Expected delta
- $0/yr ($0/mo · 0.0%)
ⓘ Screening estimate from a state-policy table — verify with the county assessor before closing.
Climate risk First Street
- Flood 1/10 Low FEMA zone X (unshaded) · 0% chance over 30 yrs
- Wildfire 1/10 Low
- Heat 4/10 Moderate 7 d/yr ≥105°F today · 15 d/yr by 30 yrs out
- Wind 2/10 Low
- Air quality 2/10 Low 0 unhealthy d/yr today · 1 by 30 yrs out
Nearby sold comps map
Loading sold comps map…
Walkable amenities ~0.75 mi
Loading nearby amenities…
Taxation est. · year 1
- Rental income
- $11,726
- − Mortgage interest
- −$4,201
- − Property taxes
- −$1,027
- − Insurance
- −$375
- − Repairs & maintenance
- −$938
- − Management
- −$938
- − Depreciation
- −$2,182
- Taxable income
- $2,065
- Est. tax owed @ 24.0%
- −$496
- After-tax cash flow
- $2,647/yr
For passive investors: Depreciation is non-cash, so a rental often shows a tax loss while cash-flowing — sheltering income. Rental losses are passive: they offset passive income freely, and up to $25,000/yr can offset ordinary (W-2) income if you actively participate and your MAGI is under $100k (phasing out to $0 by $150k); unused losses carry forward. On sale, claimed depreciation is recaptured at up to 25%, and gains may owe capital-gains tax (a 1031 exchange can defer both). Figures are a year-1 estimate at your 24.0% rate — not tax advice; consult a CPA.
Schools (NCES district)
- District
- Stanberry R-II
- NCES district ID
- 2929340
- Math proficiency
- 50% ▲ 5.00%
- Reading proficiency
- 50% ▬ 0.00%
- Median HH income
- $44,567
- Composite
- 44.29/100
- National rank
- #6164
- State rank
- #119 of 535 in MO
Livability — Stanberry
- Score
- 69/100
- State rank
- #152
- US rank
- #8604
Category grades
Schools grade is shown separately in the Schools card above.
Census & demographics
- Census place
- Stanberry, MO
- Population (ZIP)
- 2,211
Population outlook (Gentry County) Hauer SSP2
- Today (2025)
- 6,612 people
- By 2030
- 6,572 · -0.6%
- By 2040
- 6,521 · -1.4%
- By 2050
- 6,457 · -2.3%
- By 2075
- 6,346 · -4.0%
- By 2100
- 6,036 · -8.7%
Race, ethnicity, and origin ACS 2023
- Neighborhood character
- Predominantly White (95%)
- Race & ethnicity
- White 95% Two or more races 3% Hispanic / Latino 1%
- Common ancestry
- Iranian 3% Italian 2% Slovak 1%
- Foreign-born
- 1% · South Korea
- Languages at home
- 89% English-only · German/W. Germanic 10% Tagalog/Filipino 1%
Political lean MEDSL · Gentry
- 2024 margin
- Solid R (+61.8) · D 18.7% · R 80.5%
- 2008→2024 swing
- -39.7pp toward R · 2008: -22.1pp · 2024: -61.8pp
- All cycles
- 2024: R+61.8 2020: R+60.8 2016: R+56.0 2012: R+35.0 2008: R+22.1
Not yet ingested
- Civics
- —
Market trends
- HPI YoY
- —
- Current HPI
- —
- Rent YoY
- —
- Metro
- —
- State GDP YoY
- ▲ 1.84%
- F500 in state
- 20
Industry mix (Fortune 500 HQ in MO)
| Industry | F500 HQs | Revenue |
|---|---|---|
| Healthcare | 1 | $163B |
|
||
| Insurance | 1 | $21B |
|
||
| Industrial Technology | 1 | $17B |
|
||
| Retail | 1 | $16B |
|
||
| Industrial Distribution | 1 | $10B |
|
||
| Utilities | 1 | $9B |
|
||
Price history
+50.0% since first listed5 events — show timeline
- 2026-05-08 Relisted — Heartland MLS as Distributed by MLS Grid
- 2026-03-23 Pending — Heartland MLS as Distributed by MLS Grid
- 2025-11-04 Listed $75,000 Heartland MLS as Distributed by MLS Grid
- 2021-04-28 Sold (MLS) — Heartland MLS as Distributed by MLS Grid
- 2021-02-26 Listed $50,000 Heartland MLS as Distributed by MLS Grid
Property tax history
+1.7%/yrLatest (2025): $1,027 · +11.5% YoY. Source: county tax records.
Cash-flow waterfall
monthlySold comps — $/sqft
last 12 mo · ≤1 miLoading sold comps…