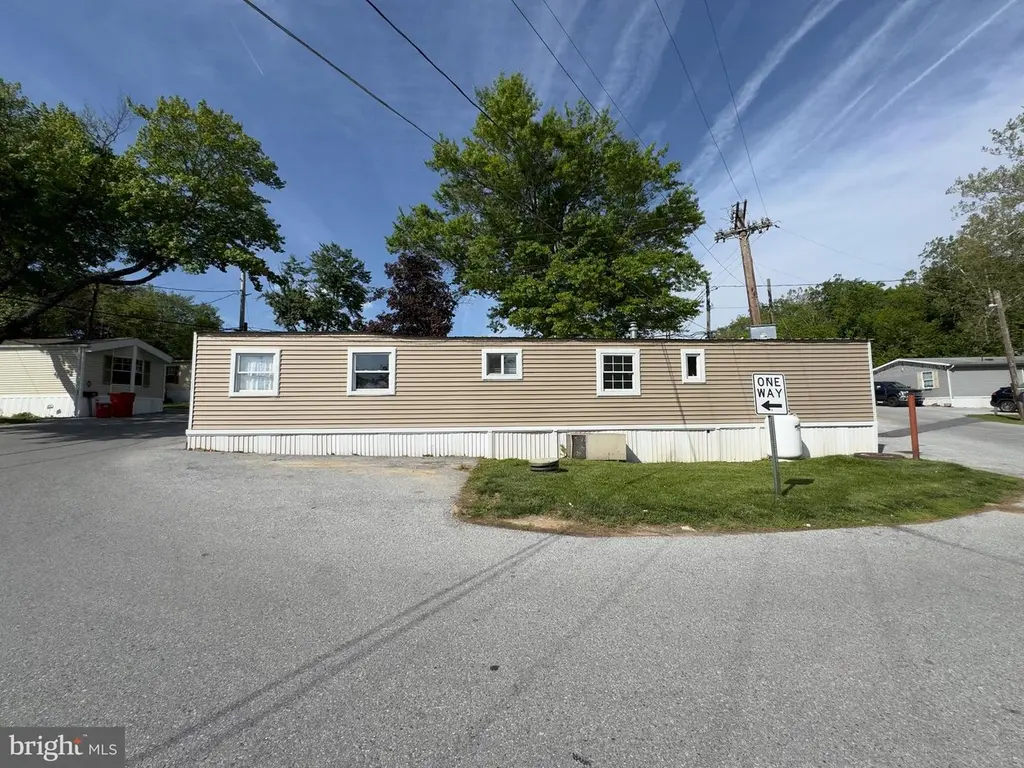
41 Dillan Dr · East Whiteland, PA
Flood risk 1/10 · Minimal
- FEMA flood zone
- X (unshaded)
- Chance of flooding over 30 yrs
- 0.0%
- Est. flood insurance / yr
- $473 – $860
Fire risk 3/10 · Minor
- Est. fire insurance / yr
- $511 – $949
Heat risk 5/10 · Moderate
- Hot days now (above 99°F)
- 7 days/yr
- Hot days in 30 yrs
- 15 days/yr
Wind risk 6/10 · Moderate
- Chance of severe wind over 30 yrs
- 27.0%
Air-quality risk 3/10 · Minor
- Unhealthy air days now
- 2 days/yr
- Unhealthy air days in 30 yrs
- 5 days/yr
Risk factors via First Street. Map © Google.
Why this score? — see what drove the B grade
The composite is a weighted blend of 9 inputs, each scored 0–100. Each bar is that input's sub-score; the figure is the points it added to the 100-point composite (weight × sub-score).
- Cash flow +30.0/30.0
- 1% rule +10.0/10.0
- DSCR +10.0/10.0
- ARV discount +7.5/15.0
- Schools +5.9/10.0
- Rent growth +3.2/5.0
- Livability +2.5/5.0
- Condition / age +2.5/5.0
- Appreciation +0.0/10.0
$100,000
🖨 Deal sheet 📄 Offer letter ✓ Due diligence
Key facts
- Built 1973
- Listed 34 days
Property features AI
Finance
- Other: Fee simple ownership
- HOA & community: Other monthly fee approximately $800
Exterior
- Parking: On-street parking
- Utilities: Community water; Community septic tank
- Home design: Manufactured home; Modular/Manufactured construction; Estimated year built; Single-level layout (all main living areas on the main level)
- Construction: Manufactured structure; Mobile home dimensions approximately 12 ft by 58 ft
- Exterior features: Deck(s); Shed; No basement
Interior
- Bedrooms: Three bedrooms on the main level
- Bathrooms: One full bathroom on the main level
- Heating & cooling: Forced air heating; Ceiling fans for cooling; Propane (metered) heating fuel; Propane hot water
- Interior features: Estimated living area
Neighborhood map
What this means for you Summary
Snapshot
- This is a 3-bed/1.0-bath manufactured listed at $100k.
Deal economics
- At list price, monthly cash flow is $1k ($16k/yr) — positive.
- The deal already cash-flows at list — no discount required.
- Meets the 1% rule at list price ($2k rent vs $100k).
- Recommended offer: $97k (3.0% below list) — sets the bar for market timing.
Location & tenants
- Location reads: area grade B — affects rentability + tenant quality, not the cash-flow math above.
- Great Valley SD (suburban): math 56% / reading 71% proficiency, ranked #33 of 539 in PA (top 6%) — acceptable for families but not a draw, mixed tenant base, ~2y average lease; only 10% free/reduced lunch — higher-income household profile.
- Zoned schools: Kathryn D. Markley El Sch (math 60% / reading 69%, grade B, #249 of 1,518 statewide, top 19%, 654 students, 23% FRL); Great Valley Ms (math 44% / reading 73%, grade B, #55 of 512 statewide, top 11%, 1,066 students, 20% FRL); Great Valley Hs (math 88%, 1,403 students, 18% FRL).
- Market conditions: Rents rising (+2.8%/yr); 168 active listings in the ZIP; high-income renter base; 1,513 units permitted in Chester County in 2024 (354 in 5+ unit buildings).
- This rent is only 17% of the median local income ($169k/yr) — well below the 30% rent-burden line; pricing power to push rent on renewal without tenant pushback.
Forward outlook
- Local home prices are declining (-3.0%/yr); year-one equity from $691 of loan paydown is wiped out by about $3k of value loss. Plan a longer hold.
- Chester County population projected at +6% by 2050 — modest demand growth; plan on rents tracking national, not racing it.
- At projected returns (-3.0% appreciation + 2.8% rent growth), your $28k cash investment doubles in ~2 years — after that, you're playing with house money.
Negotiation context
- It's been on market 35 days — a 3% lower offer ($97k) is reasonable based on typical stale-listing flexibility.
Risks & watch-outs
- Climate carrying-cost: major wind risk, 27% chance of damaging wind over 30y; extreme-heat days projected 7→15/yr by 2055 (HVAC capex compounding) — expect insurance premiums to compound above CPI over the hold.
Questions for the listing agent
- It's been on market 35 days. Have you received any prior offers? Is the seller open to a 3% concession, seller financing, or rate buy-down credit?
- Built in 1973 — when were the roof, HVAC, electrical panel, plumbing, and water heater last replaced?
- Is there a deadline driving the sale (1031 exchange, divorce, estate, relocation)? That informs how much negotiation room exists.
- What's the average days-on-market for RENTAL listings here right now (not sales)? A rising rental-DOM trend means longer vacancies and softer asking-rent achievability than the comps imply.
- What's the recent tenant-quality profile in this submarket — average credit score on applications, eviction rate, late-payment / NSF rate, and stable-employment percentage? A property-management company in the area should have these aggregated.
- How much new for-sale + rental construction is in the pipeline within 1–3 miles? Heavy new supply typically softens prices + rents 12–24 months out; constrained supply supports both.
Investment metrics
- 1% rule
- 2.45% ✓
- Cap rate
- 22.40%
- Cash-on-cash
- 57.51%
- DSCR
- 3.56
- GRM
- 3.4
CMA / ARV
No comps found within radius.
Projected returns pro-forma
-3.0% appreciation · 2.77% rent growth · sell at horizon
- IRR
- 55.7%
- Equity multiple
- 3.45×
- Total profit
- $68,673
- Equity at exit
- $14,910
- IRR
- 60.7%
- Equity multiple
- 6.98×
- Total profit
- $167,445
- Equity at exit
- $8,646
Cash invested: $28,000 (down + closing). Projections, not guarantees.
Landlord ↔ Tenant lean methodology
- Overall (STATE)
- 62 Landlord-Friendly
- State Pennsylvania
- 62 Landlord-Friendly · EVEN
- County
- — inherits STATE
- City
- — inherits STATE
ZIP-level market 19355
- Rents YoY
- 2.8%
- Active inventory
- 168
- Price-to-rent
- 3.4×
Monthly cashflow live
- Estimated rent
- $2,447 medium interval (Pro) →
- Mortgage (P&I)
- −$524
- Tax from tax record
- −$25 /mo · $303/yr
- Insurance
- −$42
- HOA
- −$0
- Vacancy / Maint / Mgmt
- −$514
- Net cashflow
- $1,342
Break-even live
UW: 25.0% down · 7.5% · 30yr · 1.5% tax · 5.0% vac · 8.0% maint · 8.0% mgmt
Financing live
Cash to close
- Down payment
- $25,000
- Closing costs
- $3,000
- Reserves months
- —
- Total cash needed
- —
Loan-product check · same deal, 3 products live
Conventional
25% down · 7.5% · 30yr
- Down + closing
- —
- Monthly P&I
- —
- Monthly cashflow
- —
- DSCR
- —
- Eligible?
- —
Personal DTI + credit; lowest rate.
DSCR
20% down · 8.5% · 30yr
- Down + closing
- —
- Monthly P&I
- —
- Monthly cashflow
- —
- DSCR
- —
- Eligible?
- —
No personal income docs; deal must DSCR.
Hard money
10% down · 12.0% · 12mo
- Down + closing
- —
- Monthly P&I
- —
- Monthly cashflow
- —
- DSCR
- —
- Eligible?
- —
Short-term bridge; refi at stabilization.
Listing history 16 events
-
2026-06-18days on market $100,000 Active 35 DOM
-
2026-06-17days on market $100,000 Active 34 DOM
-
2026-06-16days on market $100,000 Active 33 DOM
-
2026-06-15days on market $100,000 Active 32 DOM
-
2026-06-13days on market $100,000 Active 30 DOM
-
2026-06-13days on market $100,000 Active 29 DOM
-
2026-06-09days on market $100,000 Active 26 DOM
-
2026-06-08days on market $100,000 Active 25 DOM
-
2026-06-07days on market $100,000 Active 24 DOM
-
2026-06-04days on market $100,000 Active 21 DOM
-
2026-06-03days on market $100,000 Active 20 DOM
-
2026-06-02days on market $100,000 Active 19 DOM
-
2026-06-01days on market $100,000 Active 18 DOM
-
2026-05-31days on market $100,000 Active 17 DOM
-
2026-05-15$100,000 Active
-
2026-05-13historical $100,000
ⓘ Source: listings_history table (triggers on properties + properties_extension) + one-shot
backfill from property_details.listing_events for pre-trigger history.
Tax reassessment forecast PA · Partial reset (capped growth)
- Current annual tax
- $303 · $25/mo
- Projected year-2 tax
- $942 · $78/mo
- Expected delta
- +$638/yr (+$53/mo · 210.6%)
ⓘ Screening estimate from a state-policy table — verify with the county assessor before closing.
Climate risk First Street
- Flood 1/10 Low FEMA zone X (unshaded) · 0% chance over 30 yrs
- Wildfire 3/10 Moderate
- Heat 5/10 Major 7 d/yr ≥99°F today · 15 d/yr by 30 yrs out
- Wind 6/10 Major 27% chance of damaging wind over 30 yrs
- Air quality 3/10 Moderate 2 unhealthy d/yr today · 5 by 30 yrs out
Nearby sold comps map
Loading sold comps map…
Walkable amenities ~0.75 mi
Loading nearby amenities…
Taxation est. · year 1
- Rental income
- $29,366
- − Mortgage interest
- −$5,602
- − Property taxes
- −$303
- − Insurance
- −$500
- − Repairs & maintenance
- −$2,349
- − Management
- −$2,349
- − Depreciation
- −$2,909
- Taxable income
- $15,354
- Est. tax owed @ 24.0%
- −$3,685
- After-tax cash flow
- $12,418/yr
For passive investors: Depreciation is non-cash, so a rental often shows a tax loss while cash-flowing — sheltering income. Rental losses are passive: they offset passive income freely, and up to $25,000/yr can offset ordinary (W-2) income if you actively participate and your MAGI is under $100k (phasing out to $0 by $150k); unused losses carry forward. On sale, claimed depreciation is recaptured at up to 25%, and gains may owe capital-gains tax (a 1031 exchange can defer both). Figures are a year-1 estimate at your 24.0% rate — not tax advice; consult a CPA.
Schools (NCES district)
- District
- Great Valley SD
- NCES district ID
- 4210870
- Math proficiency
- 56% ▼ -15.00%
- Reading proficiency
- 71% ▼ -14.00%
- Median HH income
- $100,392
- Composite
- 58.74/100
- National rank
- #977
- State rank
- #33 of 539 in PA
Livability — East Whiteland
No livability data for this city. (Only ~50 U.S. cities are tracked.)
Census & demographics
- County
- Chester County · 432,350 people
- Metro
- Philadelphia-Camden-Wilmington, PA-NJ-DE-MD
- Population (ZIP)
- 29,425
- Household income
- $169,417
- Rent vs Own
- Severe rent burden
- 510.0
Population outlook (Chester County) Hauer SSP2
- Today (2025)
- 546,756 people
- By 2030
- 559,441 · +2.3%
- By 2040
- 576,377 · +5.4%
- By 2050
- 580,602 · +6.2%
- By 2075
- 581,575 · +6.4%
- By 2100
- 540,922 · -1.1%
Race, ethnicity, and origin ACS 2023
- Neighborhood character
- Predominantly White (69%)
- Race & ethnicity
- White 69% Asian 19% Hispanic / Latino 6% Two or more races 4% Black 4%
- Hispanic origin (detail)
- Mexican 2%
- Common ancestry
- Romanian 3% Slovak 2% Scotch-Irish 1%
- Foreign-born
- 22% · China, Canada, South Korea
- Languages at home
- 76% English-only · Other Indo-European 7% Other Asian/Pacific 6% Chinese 4%
Political lean MEDSL · Chester
- 2024 margin
- D (+14.5) · D 56.7% · R 42.2% · Other 1.0%
- 2008→2024 swing
- +5.2pp toward D · 2008: 9.2pp · 2024: 14.5pp
- All cycles
- 2024: D+14.5 2020: D+17.0 2016: D+9.2 2012: R+0.4 2008: D+9.2
Not yet ingested
- Civics
- —
Market trends
- HPI YoY
- ▼ -297.64%
- Current HPI
- 280.8023
- Rent YoY
- ▲ 2.77%
- Metro
- Philadelphia-Camden-Wilmington, PA-NJ-DE-MD
- State GDP YoY
- ▲ 1.68%
- F500 in state
- 34
Industry mix (Fortune 500 HQ in PA)
| Industry | F500 HQs | Revenue |
|---|---|---|
| Healthcare | 2 | $309B |
|
||
| Insurance | 2 | $27B |
|
||
| Telecommunications / Media | 1 | $124B |
|
||
| Industrial Distribution | 1 | $22B |
|
||
| Financial Services | 1 | $20B |
|
||
| Chemicals / Materials | 1 | $18B |
|
||
Price history
+0.0% since first listed2 events — show timeline
- 2026-05-15 Listed $100,000 BRIGHT MLS
- 2026-05-13 Coming Soon $100,000 BRIGHT MLS
Property tax history
+2.0%/yrLatest (2026): $303 · +2.8% YoY. Source: county tax records.
Cash-flow waterfall
monthlySold comps — $/sqft
last 12 mo · ≤1 miLoading sold comps…