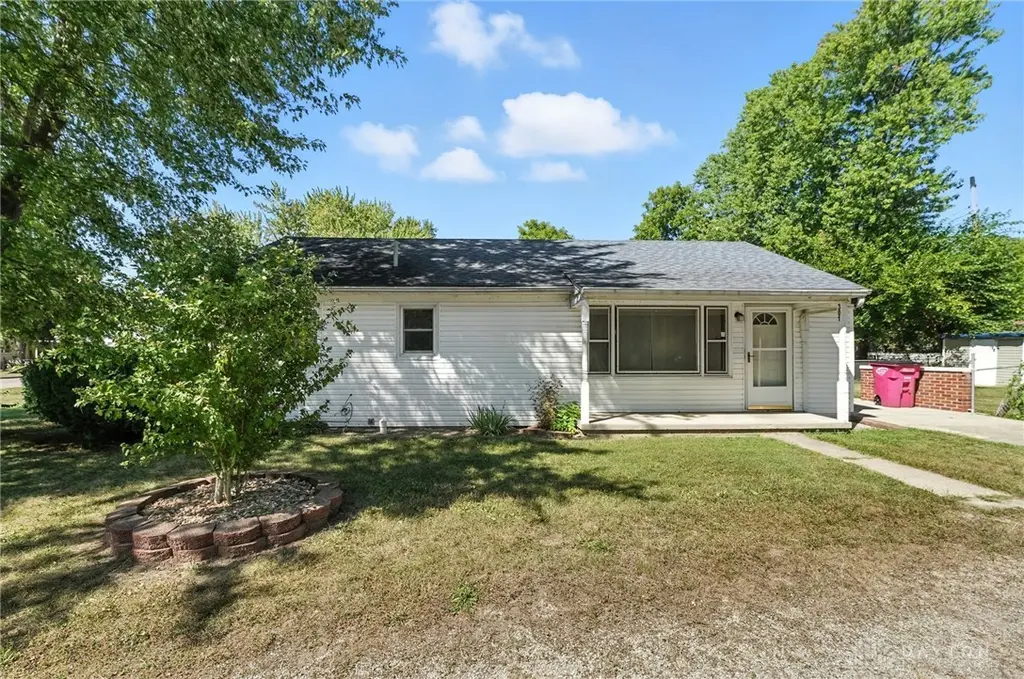
301 N Spring St · West Milton, OH
Flood risk 1/10 · Minimal
- FEMA flood zone
- X (unshaded)
- Chance of flooding over 30 yrs
- 0.0%
- Est. flood insurance / yr
- $507 – $1,088
Fire risk 1/10 · Minimal
- Est. fire insurance / yr
- $713 – $1,323
Heat risk 3/10 · Minor
- Hot days now (above 100°F)
- 7 days/yr
- Hot days in 30 yrs
- 18 days/yr
Wind risk 2/10 · Minimal
- Chance of severe wind over 30 yrs
- —
Air-quality risk 2/10 · Minimal
- Unhealthy air days now
- 1 days/yr
- Unhealthy air days in 30 yrs
- 2 days/yr
Risk factors via First Street. Map © Google.
Why this score? — see what drove the D+ grade
The composite is a weighted blend of 9 inputs, each scored 0–100. Each bar is that input's sub-score; the figure is the points it added to the 100-point composite (weight × sub-score).
- Cash flow +14.0/30.0
- ARV discount +12.0/15.0
- Schools +4.9/10.0
- DSCR +4.2/10.0
- Livability +3.2/5.0
- 1% rule +2.7/10.0
- Rent growth +2.5/5.0
- Condition / age +2.5/5.0
- Appreciation +0.0/10.0
$155,000
🖨 Deal sheet 📄 Offer letter ✓ Due diligence
Listing remarks
Beautiful ranch style home with recent updates that include laminate wood flooring throughout, neutral paint, modern light fixtures and more. Large lot includes concrete patio with partial brick wall and partial fence. Two storage sheds located on the back of the property allow for extra storage. Also, the front porch is a great place to take in the sunset or have a nice cup of coffee in the morning. You don't want to hit snooze on this property, it won't be around for long.
Key facts
- Ranch style home
- Concrete patio
- Partial brick wall
Tags
Neighborhood map
What this means for you Summary
Snapshot
- This is a 3-bed/1.0-bath single-family listed at $155k.
Deal economics
- At list price, monthly cash flow is $19 ($227/yr) — positive.
- The deal already cash-flows at list — no discount required.
- To meet the 1% rule (rent ≥ 1% of price), the offer needs to be $120k (22.6% below list).
- Recommended offer: $120k (22.6% below list) — sets the bar for 1% rule.
- Cap rate 6.4% vs local median 4.2% in West Milton — top-decile yield for the area; either an underpriced asset or a hidden risk that comps aren't pricing in. Stress-test before assuming the spread holds.
Location & tenants
- Location reads 64/100 on livability (#777 in OH) — a middle-class / working-renter tenant base. Strengths: cost of living A+, housing A-, crime B+; Watch: employment D+, amenities F, commute F.
- Milton-Union Exempted Village (rural): math 54% / reading 61% proficiency, ranked #324 of 656 in OH (top 49%) — acceptable for families but not a draw, mixed tenant base, ~2y average lease; 62% free/reduced lunch — lower-income household profile, screen leases tightly.
- Market conditions: 24 active listings in the ZIP; 1 comparable units currently listed for rent nearby; 326 units permitted in Miami County in 2024 (0 in 5+ unit buildings).
Forward outlook
- Local home prices are declining (-3.0%/yr); year-one equity from $1k of loan paydown is wiped out by about $5k of value loss. Plan a longer hold.
Negotiation context
- Only 2 days on market — expect competitive offers; lowballing is unlikely to land.
- 2 sale attempts with the ask held roughly flat each time — persistent listings suggest the price (not the market) is what's stuck; bring a comps-based counter.
- Current owner paid $38k; list at $155k implies a 308% gain — meaningful room to come down on a strong offer.
Questions for the listing agent
- Built in 1960 — when were the roof, HVAC, electrical panel, plumbing, and water heater last replaced?
- Is there a deadline driving the sale (1031 exchange, divorce, estate, relocation)? That informs how much negotiation room exists.
- Schools are B-rated — typically a magnet for longer-tenancy family renters. What's the average tenant stay here, and is there a school-zone premium baked into asking?
- The area grade is low — what's the realistic commute time and amenity access for the typical tenant pool here? Any planned neighborhood developments (good or bad) we should know about?
- What's the average days-on-market for RENTAL listings here right now (not sales)? A rising rental-DOM trend means longer vacancies and softer asking-rent achievability than the comps imply.
- What's the recent tenant-quality profile in this submarket — average credit score on applications, eviction rate, late-payment / NSF rate, and stable-employment percentage? A property-management company in the area should have these aggregated.
- How much new for-sale + rental construction is in the pipeline within 1–3 miles? Heavy new supply typically softens prices + rents 12–24 months out; constrained supply supports both.
Investment metrics
- 1% rule
- 0.77% ✗
- Cap rate
- 6.44%
- Cash-on-cash
- 0.52%
- DSCR
- 1.02
- GRM
- 10.8
CMA / ARV
- ARV (on-the-fly)
- $172,368
- Comps found
- 12
Show comp detail 12 sales within ~0.75 mi
| Address | Dist | Beds/Ba | Sqft | Sold | Price | $/sf | Match |
|---|---|---|---|---|---|---|---|
| 301 N Spring St | 0.00mi | 3/1.0 | 1,008 (0%) | 1mo | $152,500 | $151 | 99 |
| 409 W Hamilton St | 0.21mi | 2/1.0 (-1) | 1,016 (+1%) | 0mo | $174,900 | $172 | 83 |
| 290 N Jay St | 0.23mi | 3/1.0 | 960 (-5%) | 4mo | $186,400 | $194 | 78 |
| 207 Palm Ct | 0.22mi | 3/1.0 | 950 (-6%) | 5mo | $162,500 | $171 | 76 |
| 430 Forest Ave | 0.15mi | 2/1.5 (-1) | 950 (-6%) | 3mo | $170,000 | $179 | 74 |
| 224 Locust Ln | 0.45mi | 3/1.0 | 979 (-3%) | 5mo | $184,900 | $189 | 70 |
| 10 S Main St | 0.36mi | 2/1.0 (-1) | 1,033 (+2%) | 14mo | $165,000 | $160 | 63 |
| 7 Rockleigh Ave | 0.63mi | 3/1.0 | 1,066 (+6%) | 2mo | $180,000 | $169 | 59 |
| 108 Wagner Rd | 0.23mi | 3/1.5 | 1,120 (+11%) | 12mo | $201,500 | $180 | 59 |
| 155 Stillwater St | 0.62mi | 3/1.0 | 1,080 (+7%) | 1mo | $150,000 | $139 | 58 |
| 514 S Miami St | 0.68mi | 2/1.0 (-1) | 956 (-5%) | 4mo | $135,000 | $141 | 51 |
| 483 N Main St | 0.49mi | 3/1.0 | 1,107 (+10%) | 21mo | $160,000 | $145 | 43 |
Match score weights: distance 35% · size 25% · config 20% · recency 20%. Top-matched comps best support the ARV.
Projected returns pro-forma
-3.0% appreciation · 3.0% rent growth · sell at horizon
- IRR
- -15.5%
- Equity multiple
- 0.45×
- Total profit
- $-23,984
- Equity at exit
- $23,111
- IRR
- -7.1%
- Equity multiple
- 0.55×
- Total profit
- $-19,618
- Equity at exit
- $13,402
Cash invested: $43,400 (down + closing). Projections, not guarantees.
Landlord ↔ Tenant lean methodology
- Overall (STATE)
- 73 Landlord-Friendly
- State Ohio
- 73 Landlord-Friendly · R+6
- County
- — inherits STATE
- City
- — inherits STATE
ZIP-level market 45383
- Home prices YoY
- -27.8%
- Active inventory
- 24
- Price-to-rent
- 10.8×
Monthly cashflow live
- Estimated rent
- $1,200 medium interval (Pro) →
- Mortgage (P&I)
- −$813
- Tax from tax record
- −$52 /mo · $620/yr
- Insurance
- −$65
- HOA
- −$0
- Vacancy / Maint / Mgmt
- −$252
- Net cashflow
- $19
Break-even live
UW: 25.0% down · 7.5% · 30yr · 1.5% tax · 5.0% vac · 8.0% maint · 8.0% mgmt
Financing live
Cash to close
- Down payment
- $38,750
- Closing costs
- $4,650
- Reserves months
- —
- Total cash needed
- —
Loan-product check · same deal, 3 products live
Conventional
25% down · 7.5% · 30yr
- Down + closing
- —
- Monthly P&I
- —
- Monthly cashflow
- —
- DSCR
- —
- Eligible?
- —
Personal DTI + credit; lowest rate.
DSCR
20% down · 8.5% · 30yr
- Down + closing
- —
- Monthly P&I
- —
- Monthly cashflow
- —
- DSCR
- —
- Eligible?
- —
No personal income docs; deal must DSCR.
Hard money
10% down · 12.0% · 12mo
- Down + closing
- —
- Monthly P&I
- —
- Monthly cashflow
- —
- DSCR
- —
- Eligible?
- —
Short-term bridge; refi at stabilization.
Rent comps 1 comps
| Address | Beds | Baths | Sqft | Rent | $/sqft | DOM | Units | Dist |
|---|---|---|---|---|---|---|---|---|
| 439 Lyle Dr West Milton, OH | 2.0 | 2.0 | 1106 | $1,200 | $1.08 | 2d | 1 | 0.12mi |
Listing history 8 events
-
2026-04-27status Pending
-
2026-04-24$155,000 Active
-
2025-11-07historical
-
2025-10-13price $155,000
-
2025-09-19price $175,900
-
2025-09-05$179,900 Active
-
1996-05-24soldstatus $38,000
-
1987-08-28soldstatus $38,000
ⓘ Source: listings_history table (triggers on properties + properties_extension) + one-shot
backfill from property_details.listing_events for pre-trigger history.
Tax reassessment forecast OH · Partial reset (capped growth)
- Current annual tax
- $620 · $52/mo
- Projected year-2 tax
- $1,519 · $127/mo
- Expected delta
- +$899/yr (+$75/mo · 144.9%)
ⓘ Screening estimate from a state-policy table — verify with the county assessor before closing.
Climate risk First Street
- Flood 1/10 Low FEMA zone X (unshaded) · 0% chance over 30 yrs
- Wildfire 1/10 Low
- Heat 3/10 Moderate 7 d/yr ≥100°F today · 18 d/yr by 30 yrs out
- Wind 2/10 Low
- Air quality 2/10 Low 1 unhealthy d/yr today · 2 by 30 yrs out
Nearby sold comps map
Loading sold comps map…
Walkable amenities ~0.75 mi
Loading nearby amenities…
Taxation est. · year 1
- Rental income
- $14,400
- − Mortgage interest
- −$8,682
- − Property taxes
- −$620
- − Insurance
- −$775
- − Repairs & maintenance
- −$1,152
- − Management
- −$1,152
- − Depreciation
- −$4,509
- Taxable loss
- −$2,491
- Est. tax savings @ 24.0%
- +$598
- After-tax cash flow
- $824/yr
For passive investors: Depreciation is non-cash, so a rental often shows a tax loss while cash-flowing — sheltering income. Rental losses are passive: they offset passive income freely, and up to $25,000/yr can offset ordinary (W-2) income if you actively participate and your MAGI is under $100k (phasing out to $0 by $150k); unused losses carry forward. On sale, claimed depreciation is recaptured at up to 25%, and gains may owe capital-gains tax (a 1031 exchange can defer both). Figures are a year-1 estimate at your 24.0% rate — not tax advice; consult a CPA.
Schools (NCES district)
- District
- Milton-Union Exempted Village
- NCES district ID
- 3904551
- Math proficiency
- 54% ▼ -14.00%
- Reading proficiency
- 61% ▼ -8.00%
- Median HH income
- $51,479
- Composite
- 49.12/100
- National rank
- #2048
- State rank
- #324 of 656 in OH
Livability — West Milton
- Score
- 64/100
- State rank
- #777
- US rank
- #14077
Category grades
Schools grade is shown separately in the Schools card above.
Census & demographics
- Census place
- West Milton, OH
- County
- Miami · 104,562 people
- Metro
- Dayton-Kettering-Beavercreek, OH
- Population (ZIP)
- 6,883
- Household income
- $63,795
- Rent vs Own
- Severe rent burden
- 3.5
Population outlook (Miami County) Hauer SSP2
- Today (2025)
- 107,816 people
- By 2030
- 108,896 · +1.0%
- By 2040
- 109,581 · +1.6%
- By 2050
- 108,110 · +0.3%
- By 2075
- 101,523 · -5.8%
- By 2100
- 85,787 · -20.4%
Race, ethnicity, and origin ACS 2023
- Neighborhood character
- Predominantly White (95%)
- Race & ethnicity
- White 95% Two or more races 3%
- Common ancestry
- Lithuanian 5% Slovak 2% Romanian 2%
- Foreign-born
- 0%
Political lean MEDSL · Miami
- 2024 margin
- Solid R (+45.1) · D 27.0% · R 72.1%
- 2008→2024 swing
- -16.6pp toward R · 2008: -28.5pp · 2024: -45.1pp
- All cycles
- 2024: R+45.1 2020: R+44.3 2016: R+45.6 2012: R+35.6 2008: R+28.5
Not yet ingested
- Civics
- —
Market trends
- HPI YoY
- ▼ -89.93%
- Current HPI
- 233.9432
- Rent YoY
- —
- Metro
- —
- State GDP YoY
- ▲ 1.98%
- F500 in state
- 48
Industry mix (Fortune 500 HQ in OH)
| Industry | F500 HQs | Revenue |
|---|---|---|
| Insurance | 3 | $145B |
|
||
| Industrial Machinery | 3 | $49B |
|
||
| Financial Services | 3 | $24B |
|
||
| Consumer Goods | 2 | $93B |
|
||
| Aerospace / Defense | 2 | $47B |
|
||
| Utilities | 2 | $33B |
|
||
Price history
+307.9% since first listed8 events — show timeline
- 2026-04-27 Pending — Dayton MLS
- 2026-04-24 Listed $155,000 Dayton MLS
- 2025-11-07 Listing Removed — Dayton MLS
- 2025-10-13 Price Changed $155,000 Dayton MLS
- 2025-09-19 Price Changed $175,900 Dayton MLS
- 2025-09-05 Listed $179,900 Dayton MLS
- 1996-05-24 Sold (Public Records) $38,000 Public Records
- 1987-08-28 Sold (Public Records) $38,000 Public Records
Property tax history
-0.3%/yrLatest (2025): $620 · -28.2% YoY. Source: county tax records.
Cash-flow waterfall
monthlySold comps — $/sqft
last 12 mo · ≤1 miLoading sold comps…