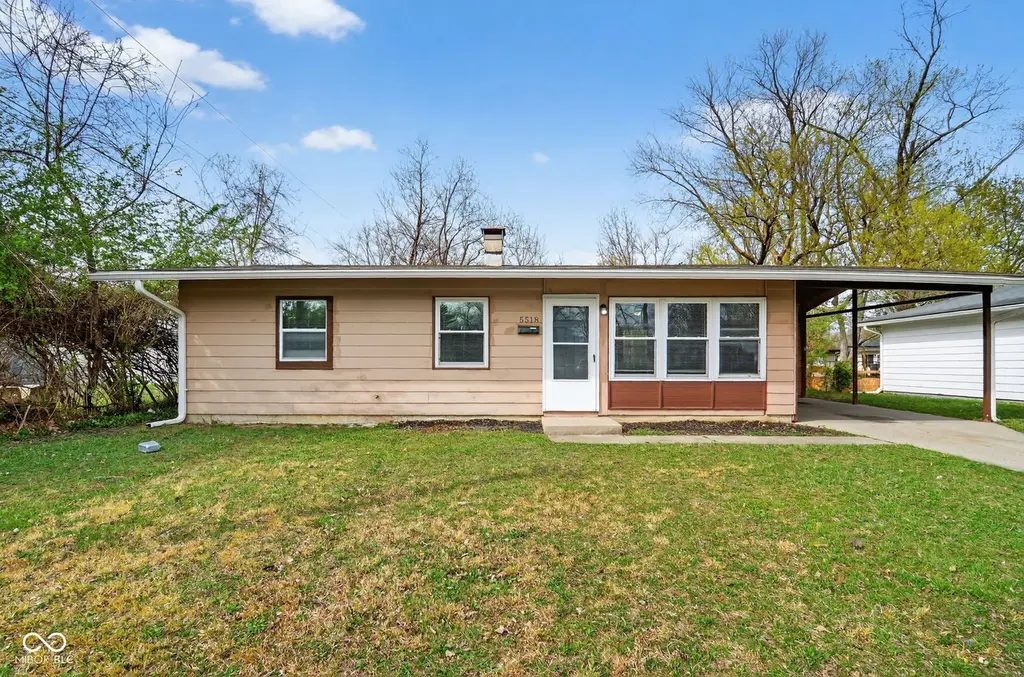
5518 Glencoe St · Indianapolis city (balance), IN
Flood risk 1/10 · Minimal
- FEMA flood zone
- X (unshaded)
- Chance of flooding over 30 yrs
- 0.0%
- Est. flood insurance / yr
- $507 – $1,088
Fire risk 1/10 · Minimal
- Est. fire insurance / yr
- $717 – $1,331
Heat risk 3/10 · Minor
- Hot days now (above 101°F)
- 7 days/yr
- Hot days in 30 yrs
- 18 days/yr
Wind risk 2/10 · Minimal
- Chance of severe wind over 30 yrs
- 1.0%
Air-quality risk 4/10 · Minor
- Unhealthy air days now
- 5 days/yr
- Unhealthy air days in 30 yrs
- 7 days/yr
Risk factors via First Street. Map © Google.
Why this score? — see what drove the C- grade
The composite is a weighted blend of 9 inputs, each scored 0–100. Each bar is that input's sub-score; the figure is the points it added to the 100-point composite (weight × sub-score).
- Cash flow +20.4/30.0
- ARV discount +7.9/15.0
- DSCR +6.5/10.0
- 1% rule +5.5/10.0
- Rent growth +4.2/5.0
- Livability +2.5/5.0
- Condition / age +2.5/5.0
- Schools +1.4/10.0
- Appreciation +0.0/10.0
$124,900
🖨 Deal sheet 📄 Offer letter ✓ Due diligence
Listing remarks
Discover the perfect blend of mid-century character and modern convenience in this charming 1956 ranch, ideally situated in the heart of the established Devington community. This beautifully efficient three-bedroom home captures the timeless "Atomic Age" aesthetic with its sleek, low-slung profile, durable brick accents, and a classic 240-square-foot carport that adds both style and functionality. Inside, the sun-drenched floor plan offers a cozy yet airy atmosphere, while the sprawling 0.16-acre level lot provides a private outdoor sanctuary perfect for gardening, entertaining, or peaceful relaxation. Located just minutes from I-465, I-70, and Shadeland Avenue, this property is a
Key facts
- 7,100 sq ft lot
- Built 1956
- Listed 16 days
Property features AI
Finance
- Financial info: No financial details provided
- HOA & community: No indication of low-maintenance lifestyle or HOA
Exterior
- Parking: Concrete parking
- Security: No accessibility or special security features reported
- Utilities: Public water; Municipal sewer connected; Solid waste service available
- Home design: Single-family residence; One story
- Construction: Wood siding exterior; Slab foundation
- Exterior features: Lot under 1/4 acre (approx. 0.16 acre); Lot described as 'Other'
Interior
- Kitchen: Kitchen on main level (approx. 9x12); Includes refrigerator and electric oven
- Bedrooms: Three bedrooms on the main level (sizes approx. 12x11, 12x9, 12x12)
- Flooring: Luxury vinyl plank in dining room and living room; Flooring type not specified for other rooms
- Bathrooms: One full bathroom (main level)
- Heating & cooling: Forced air heating; Central air conditioning
- Interior features: Refrigerator; Electric oven; Luxury vinyl plank flooring in dining room and living room; Six total main-level rooms
- Laundry & utility: No specific laundry details provided
Neighborhood map
What this means for you Summary
Snapshot
- This is a 3-bed/1.0-bath single-family listed at $125k.
Deal economics
- At list price, monthly cash flow is $162 ($2k/yr) — positive.
- The deal already cash-flows at list — no discount required.
- Meets the 1% rule at list price ($1k rent vs $125k).
- Recommended offer: $123k (1.5% below list) — sets the bar for market timing.
- Cap rate 7.9% vs local median 4.4% in Indianapolis city (balance) — top-decile yield for the area; either an underpriced asset or a hidden risk that comps aren't pricing in. Stress-test before assuming the spread holds.
Location & tenants
- Location reads: area grade C — affects rentability + tenant quality, not the cash-flow math above.
- Indianapolis Public Schools (urban): math 14% / reading 20% proficiency, ranked #286 of 301 in IN (top 95%) — low school quality limits family demand, transient renter base, plan for 1-2y turnover; 77% free/reduced lunch — lower-income household profile, screen leases tightly.
- Zoned schools: Floro Torrence School 83 (math 8% / reading 12%, grade F, #921 of 994 statewide, top 94%, 197 students, 85% FRL); Shortridge High School (math 20% / reading 51%, grade F, #263 of 369 statewide, top 72%, 1,089 students, 70% FRL) — zoned schools at 78% FRL track the district average.
- Market conditions: Rents rising fast (+6.8%/yr); 151 active listings in the ZIP; 36 comparable units currently listed for rent nearby; rentals at typical pace (median 24d on market — plan ~3-4 weeks tenant-placement turnaround); 44% of comp listings sitting > 30 days — soft ceiling on asking rent; 1,906 units permitted in Marion County in 2024 (621 in 5+ unit buildings).
- This rent runs 31% of the median local income ($50k/yr) — at the standard rent-burdened threshold; future hikes will face affordability resistance.
Forward outlook
- Local home prices are declining (-3.0%/yr); year-one equity from $864 of loan paydown is wiped out by about $4k of value loss. Plan a longer hold.
- Marion County population projected at +18% by 2050 — long-run rental-demand tailwind backs the buy-and-hold thesis.
- At projected returns (-3.0% appreciation + 6.8% rent growth), your $35k cash investment doubles in ~10 years — after that, you're playing with house money.
Negotiation context
- It's been on market 16 days — a 2% lower offer ($123k) is reasonable based on typical stale-listing flexibility.
Risks & watch-outs
- Watch-outs: built in 1956 — expect roof / HVAC / electrical / plumbing capex.
Questions for the listing agent
- Built in 1956 — when were the roof, HVAC, electrical panel, plumbing, and water heater last replaced?
- Is there a deadline driving the sale (1031 exchange, divorce, estate, relocation)? That informs how much negotiation room exists.
- What's the average days-on-market for RENTAL listings here right now (not sales)? A rising rental-DOM trend means longer vacancies and softer asking-rent achievability than the comps imply.
- What's the recent tenant-quality profile in this submarket — average credit score on applications, eviction rate, late-payment / NSF rate, and stable-employment percentage? A property-management company in the area should have these aggregated.
- How much new for-sale + rental construction is in the pipeline within 1–3 miles? Heavy new supply typically softens prices + rents 12–24 months out; constrained supply supports both.
Investment metrics
- 1% rule
- 1.05% ✓
- Cap rate
- 7.85%
- Cash-on-cash
- 5.57%
- DSCR
- 1.25
- GRM
- 7.9
CMA / ARV
- ARV (on-the-fly)
- $126,144
- Comps found
- 12
Show comp detail 12 sales within ~0.75 mi
| Address | Dist | Beds/Ba | Sqft | Sold | Price | $/sf | Match |
|---|---|---|---|---|---|---|---|
| 5602 Glencoe St | 0.07mi | 3/1.0 | 864 (0%) | 22mo | $134,000 | $155 | 78 |
| 4101 N Arlington Ave | 0.48mi | 3/1.0 | 944 (+9%) | 6mo | $145,000 | $154 | 57 |
| 3614 N Whittier Pl | 0.60mi | 3/2.0 | 912 (+6%) | 3mo | $171,999 | $189 | 56 |
| 3630 N Irvington Ave | 0.58mi | 3/1.0 | 912 (+6%) | 18mo | $132,000 | $145 | 48 |
| 3536 N Hawthorne Ln | 0.71mi | 3/2.0 | 925 (+7%) | 6mo | $149,900 | $162 | 46 |
| 3938 N Grand Ave | 0.49mi | 3/1.0 | 993 (+15%) | 9mo | $135,000 | $136 | 45 |
| 4002 N Catherwood Ave | 0.57mi | 4/1.0 (+1) | 984 (+14%) | 2mo | $125,000 | $127 | 44 |
| 3940 N Webster Ave | 0.53mi | 3/1.0 | 962 (+11%) | 15mo | $142,500 | $148 | 44 |
| 3716 N Butler Ave | 0.59mi | 3/2.0 | 912 (+6%) | 18mo | $133,000 | $146 | 44 |
| 4071 Sawyer St | 0.63mi | 3/1.0 | 964 (+12%) | 14mo | $36,000 | $37 | 40 |
| 4072 N Sheridan Ave | 0.71mi | 3/1.0 | 962 (+11%) | 19mo | $126,900 | $132 | 32 |
| 3605 N Butler Ave | 0.68mi | 3/1.0 | 990 (+15%) | 19mo | $79,500 | $80 | 28 |
Match score weights: distance 35% · size 25% · config 20% · recency 20%. Top-matched comps best support the ARV.
Projected returns pro-forma
-3.0% appreciation · 6.76% rent growth · sell at horizon
- IRR
- -3.5%
- Equity multiple
- 0.86×
- Total profit
- $-4,727
- Equity at exit
- $18,623
- IRR
- 10.1%
- Equity multiple
- 1.92×
- Total profit
- $32,149
- Equity at exit
- $10,799
Cash invested: $34,972 (down + closing). Projections, not guarantees.
Landlord ↔ Tenant lean methodology
- Overall (STATE)
- 90 Strongly Landlord-Friendly
- State Indiana
- 90 Strongly Landlord-Friendly · R+11
- County
- — inherits STATE
- City
- — inherits STATE
ZIP-level market 46226
- Rents YoY
- 6.8%
- Active inventory
- 151
- Price-to-rent
- 7.9×
Monthly cashflow live
- Estimated rent
- $1,313 high interval (Pro) →
- Mortgage (P&I)
- −$655
- Tax from tax record
- −$168 /mo · $2,014/yr
- Insurance
- −$52
- HOA
- −$0
- Vacancy / Maint / Mgmt
- −$276
- Net cashflow
- $162
Break-even live
UW: 25.0% down · 7.5% · 30yr · 1.5% tax · 5.0% vac · 8.0% maint · 8.0% mgmt
Financing live
Cash to close
- Down payment
- $31,225
- Closing costs
- $3,747
- Reserves months
- —
- Total cash needed
- —
Loan-product check · same deal, 3 products live
Conventional
25% down · 7.5% · 30yr
- Down + closing
- —
- Monthly P&I
- —
- Monthly cashflow
- —
- DSCR
- —
- Eligible?
- —
Personal DTI + credit; lowest rate.
DSCR
20% down · 8.5% · 30yr
- Down + closing
- —
- Monthly P&I
- —
- Monthly cashflow
- —
- DSCR
- —
- Eligible?
- —
No personal income docs; deal must DSCR.
Hard money
10% down · 12.0% · 12mo
- Down + closing
- —
- Monthly P&I
- —
- Monthly cashflow
- —
- DSCR
- —
- Eligible?
- —
Short-term bridge; refi at stabilization.
Rent comps 36 comps
| Address | Beds | Baths | Sqft | Rent | $/sqft | DOM | Units | Dist |
|---|---|---|---|---|---|---|---|---|
| 5602 Glencoe St Indianapolis, IN | 3.0 | 1.0 | 1000 | $1,749 | $1.75 | 17d | 1 | 0.09mi |
| 3836 Priscilla Ave Indianapolis, IN | 3.0 | 1.5 | 1040 | $1,275 | $1.23 | 2d | 1 | 0.40mi |
| 3718 N Audubon Rd Indianapolis, IN | 3.0 | 1.0 | 875 | $1,300 | $1.49 | 23d | 1 | 0.48mi |
| 3815 N Grand Ave Unit 3815 Indianapolis, IN | 2.0 | 1.0 | 965 | $1,250 | $1.30 | 4d | 1 | 0.51mi |
| 3636 N Whittier Pl Indianapolis, IN | 3.0 | 1.0 | 912 | $995 | $1.09 | 7d | 1 | 0.57mi |
| 3639 N Emerson Ave Indianapolis, IN | 4.0 | 1.0 | 1000 | $1,450 | $1.45 | 21d | 1 | 0.72mi |
| 3516 N Hawthorne Ln Indianapolis, IN | 3.0 | 1.0 | 925 | $1,225 | $1.32 | 4d | 1 | 0.75mi |
| 4404 Park Forest Ct Indianapolis, IN | 2.0 | 1.0 | 928 | $1,180 | $1.27 | 21d | 2 | 0.76mi |
| 4430 Park Forest Ct Indianapolis, IN | 2.0 | 1.0 | 928 | $1,180 | $1.27 | 43d | 1 | 0.77mi |
| 4411 Park Forest Ct Indianapolis, IN | 2.0 | 1.0 | 928 | $1,180 | $1.27 | 43d | 1 | 0.77mi |
| 4438 Park Forest Ct Indianapolis, IN | 2.0 | 1.0 | 928 | $1,180 | $1.27 | 43d | 1 | 0.78mi |
| 4555 N Arlington Ave Indianapolis, IN | 1.0–3.0 | 1.0–1.5 | 880 | $1,379 | $1.57 | 3d | 30 | 0.80mi |
| 4437 Park Forest Ct Indianapolis, IN | 2.0 | 1.0 | 928 | $1,180 | $1.27 | 43d | 1 | 0.80mi |
| 4445 Park Forest Ct Indianapolis, IN | 2.0 | 1.0 | 928 | $1,180 | $1.27 | 3d | 1 | 0.81mi |
| 4504 Park Forest Ct Indianapolis, IN | 2.0 | 1.0 | 928 | $1,180 | $1.27 | 3d | 1 | 0.82mi |
| 4521 Park Forest Ct Indianapolis, IN | 2.0 | 1.0 | 700 | $1,180 | $1.69 | 4d | 1 | 0.83mi |
| 4537 Park Forest Ct Indianapolis, IN | 2.0 | 1.0 | 928 | $1,180 | $1.27 | 43d | 1 | 0.88mi |
| 4545 Park Forest Ct Indianapolis, IN | 2.0 | 1.0 | 928 | $1,180 | $1.27 | 43d | 1 | 0.89mi |
| 4405 Park Forest Ct Indianapolis, IN | 2.0 | 1.0 | 928 | $1,180 | $1.27 | 23d | 1 | 0.91mi |
| 3319 N Hawthorne Ln Indianapolis, IN | 3.0 | 1.0 | 1084 | $1,100 | $1.01 | 23d | 1 | 1.03mi |
| 3301 Mardenna Ave Indianapolis, IN | 3.0 | 1.0 | 925 | $1,200 | $1.30 | 43d | 1 | 1.06mi |
| 3316 N Emerson Ave Indianapolis, IN | 3.0 | 1.0 | 912 | $1,100 | $1.21 | 23d | 1 | 1.10mi |
| 6005 Dickson Rd Unit 4 Indianapolis, IN | 2.0 | 1.0 | 873 | $725 | $0.83 | 43d | 1 | 1.13mi |
| 6015 Dickson Rd #1 Indianapolis, IN | 2.0 | 1.0 | 825 | $950 | $1.15 | 43d | 1 | 1.14mi |
| 6049 Dickson Rd Apt 4 Indianapolis, IN | 2.0 | 1.0 | 750 | $950 | $1.27 | 43d | 1 | 1.17mi |
| 6048 Dickson Rd #3 Indianapolis, IN | 2.0 | 1.0 | 725 | $900 | $1.24 | 43d | 1 | 1.20mi |
| 6108 Dickson Rd Unit 3 Indianapolis, IN | 2.0 | 1.0 | 750 | $900 | $1.20 | 43d | 1 | 1.22mi |
| 6118 Dickson Rd Apt 3 Indianapolis, IN | 2.0 | 1.0 | 750 | $950 | $1.27 | 43d | 1 | 1.23mi |
| 6051 Laurel Hall Dr Apt 4 Indianapolis, IN | 2.0 | 1.0 | 750 | $950 | $1.27 | 43d | 1 | 1.24mi |
| 6028 Laurel Hall Dr #3 Indianapolis, IN | 2.0 | 1.0 | 875 | $950 | $1.09 | 43d | 1 | 1.25mi |
| 4307 N Edmondson Ave Indianapolis, IN | 3.0 | 1.0 | 900 | $1,299 | $1.44 | 2d | 1 | 1.26mi |
| 6111 Laurel Hall Dr #1 Indianapolis, IN | 2.0 | 1.0 | 725 | $950 | $1.31 | 23d | 1 | 1.26mi |
| 6111 Laurel Hall Dr #3 Indianapolis, IN | 2.0 | 1.0 | 725 | $950 | $1.31 | 43d | 1 | 1.26mi |
| 3332 Wallace Ave Indianapolis, IN | 3.0 | 1.0 | 936 | $1,600 | $1.71 | 23d | 1 | 1.27mi |
| 3315 N Euclid Ave Indianapolis, IN | 2.0 | 1.0 | 780 | $1,300 | $1.67 | 14d | 1 | 1.42mi |
| 3900 N Shadeland Ave Indianapolis, IN | 1.0–2.0 | 1.0 | 1070 | $1,075 | $1.00 | 3d | 6 | 1.44mi |
Listing history 2 events
-
2026-04-26status Pending
-
2026-04-10$124,900 Active
ⓘ Source: listings_history table (triggers on properties + properties_extension) + one-shot
backfill from property_details.listing_events for pre-trigger history.
Tax reassessment forecast IN · Partial reset (capped growth)
- Current annual tax
- $2,014 · $168/mo
- Projected year-2 tax
- $2,014 · $168/mo
- Expected delta
- $0/yr ($0/mo · -0.0%)
ⓘ Screening estimate from a state-policy table — verify with the county assessor before closing.
Climate risk First Street
- Flood 1/10 Low FEMA zone X (unshaded) · 0% chance over 30 yrs
- Wildfire 1/10 Low
- Heat 3/10 Moderate 7 d/yr ≥101°F today · 18 d/yr by 30 yrs out
- Wind 2/10 Low 100% chance of damaging wind over 30 yrs
- Air quality 4/10 Moderate 5 unhealthy d/yr today · 7 by 30 yrs out
Nearby sold comps map
Loading sold comps map…
Walkable amenities ~0.75 mi
Loading nearby amenities…
Taxation est. · year 1
- Rental income
- $15,753
- − Mortgage interest
- −$6,996
- − Property taxes
- −$2,014
- − Insurance
- −$624
- − Repairs & maintenance
- −$1,260
- − Management
- −$1,260
- − Depreciation
- −$3,633
- Taxable loss
- −$36
- Est. tax savings @ 24.0%
- +$9
- After-tax cash flow
- $1,955/yr
For passive investors: Depreciation is non-cash, so a rental often shows a tax loss while cash-flowing — sheltering income. Rental losses are passive: they offset passive income freely, and up to $25,000/yr can offset ordinary (W-2) income if you actively participate and your MAGI is under $100k (phasing out to $0 by $150k); unused losses carry forward. On sale, claimed depreciation is recaptured at up to 25%, and gains may owe capital-gains tax (a 1031 exchange can defer both). Figures are a year-1 estimate at your 24.0% rate — not tax advice; consult a CPA.
Schools (NCES district)
- District
- Indianapolis Public Schools
- NCES district ID
- 1804770
- Math proficiency
- 14% ▼ -7.00%
- Reading proficiency
- 20% ▼ -3.00%
- Median HH income
- $32,034
- Composite
- 13.69/100
- National rank
- #9499
- State rank
- #286 of 301 in IN
Livability — Indianapolis city (balance)
No livability data for this city. (Only ~50 U.S. cities are tracked.)
Census & demographics
- Census place
- Indianapolis city (balance), IN
- County
- Marion County · 998,460 people
- City population
- 881,119
- Metro
- Indianapolis-Carmel-Anderson, IN
- Population (ZIP)
- 47,099
- Household income
- $50,325
- Rent vs Own
- Severe rent burden
- 2742.0
Population outlook (Marion County) Hauer SSP2
- Today (2025)
- 1,025,572 people
- By 2030
- 1,065,727 · +3.9%
- By 2040
- 1,141,577 · +11.3%
- By 2050
- 1,208,920 · +17.9%
- By 2075
- 1,367,288 · +33.3%
- By 2100
- 1,438,201 · +40.2%
Race, ethnicity, and origin ACS 2023
- Neighborhood character
- Diverse neighborhood (Simpson 0.62)
- Race & ethnicity
- Black 53% White 25% Hispanic / Latino 17% Two or more races 9% Asian 2%
- Hispanic origin (detail)
- Mexican 11%
- Common ancestry
- Lithuanian 1% Italian 1% Romanian 1%
- Foreign-born
- 11% · Canada
- Languages at home
- 86% English-only · Spanish 10% French/Haitian/Cajun 1% Other Asian/Pacific 1%
Political lean MEDSL · Marion
- 2024 margin
- Strong D (+27.7) · D 63.0% · R 35.3% · Other 1.7%
- 2008→2024 swing
- -0.7pp no change · 2008: 28.4pp · 2024: 27.7pp
- All cycles
- 2024: D+27.7 2020: D+29.1 2016: D+22.8 2012: D+22.2 2008: D+28.4
Not yet ingested
- Civics
- —
Market trends
- HPI YoY
- ▼ -218.85%
- Current HPI
- 239.43
- Rent YoY
- ▲ 6.76%
- Metro
- Indianapolis-Carmel-Anderson, IN
- State GDP YoY
- ▲ 2.90%
- F500 in state
- 18
Industry mix (Fortune 500 HQ in IN)
| Industry | F500 HQs | Revenue |
|---|---|---|
| Industrial Machinery | 2 | $37B |
|
||
| Healthcare | 1 | $177B |
|
||
| Pharmaceuticals | 1 | $45B |
|
||
| Metals / Steel | 1 | $18B |
|
||
| Agriculture | 1 | $17B |
|
||
| Packaging | 1 | $12B |
|
||
Price history
2 events — show timeline
- 2026-04-26 Pending — MIBOR as Distributed by MLS Grid
- 2026-04-10 Listed $124,900 MIBOR as Distributed by MLS Grid
Property tax history
+17.3%/yrLatest (2025): $2,014 · +5.2% YoY. Source: county tax records.
Cash-flow waterfall
monthlySold comps — $/sqft
last 12 mo · ≤1 miLoading sold comps…