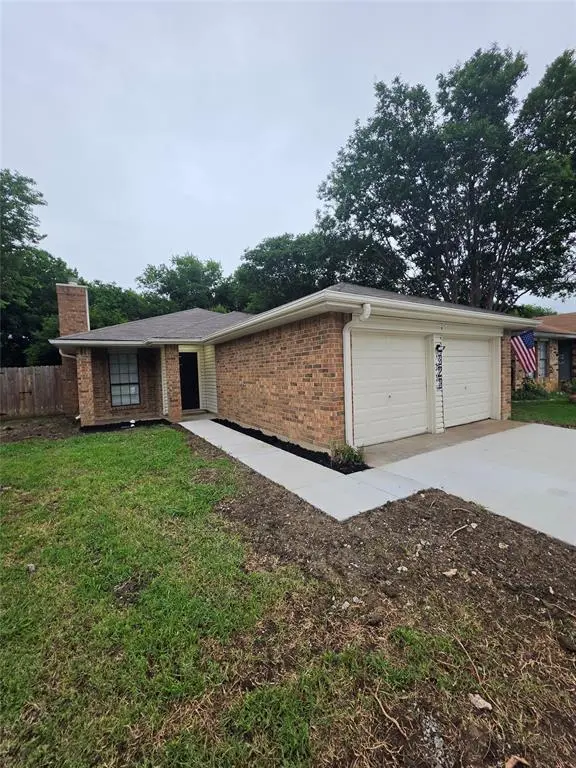
323 Valley Spring Dr · Arlington, TX
Flood risk 1/10 · Minimal
- FEMA flood zone
- X (unshaded)
- Chance of flooding over 30 yrs
- 0.0%
- Est. flood insurance / yr
- $507 – $1,088
Fire risk 3/10 · Minor
- Est. fire insurance / yr
- $1,222 – $2,270
Heat risk 7/10 · Major
- Hot days now (above 110°F)
- 7 days/yr
- Hot days in 30 yrs
- 22 days/yr
Wind risk 6/10 · Moderate
- Chance of severe wind over 30 yrs
- 27.0%
Air-quality risk 3/10 · Minor
- Unhealthy air days now
- 2 days/yr
- Unhealthy air days in 30 yrs
- 3 days/yr
Risk factors via First Street. Map © Google.
Why this score? — see what drove the D grade
The composite is a weighted blend of 9 inputs, each scored 0–100. Each bar is that input's sub-score; the figure is the points it added to the 100-point composite (weight × sub-score).
- ARV discount +12.2/15.0
- Cash flow +11.3/30.0
- Livability +3.9/5.0
- 1% rule +3.7/10.0
- DSCR +3.3/10.0
- Rent growth +2.8/5.0
- Schools +2.5/10.0
- Condition / age +2.5/5.0
- Appreciation +0.7/10.0
$239,000
🖨 Deal sheet (PDF) 📄 Offer letter ✓ Due diligence
Listing remarks
NICE SINGLE STORY HOME, LIVING AREA, DINING AREA, LUXURY VINYL PLANK FLOORING THROUGH OUT , LOTS OF UPDATES, QUARTZ COUNTER TOPS, NEW SS APPLIANCES, ROOF REPLACED. .. . DRIVEWAY REPLACED. .. FRESH PAINT, TWO CAR GARAGE, FENCED YARD. .. .. EMAIL AGENT IF YOU HAVE QUESTIONS. .. .. .. .. .. .. .. ..
Key facts
- New ss appliances
- Driveway replaced
- Single story home
Tags
Property features AI
Finance
- Other: Property subtype: Single Family Residence; Lot is less than 0.5 acre; Municipal utility district: No
- HOA & community: No HOA / association
Exterior
- Parking: Attached garage; 2-car garage with garage door opener; Covered parking for 2 vehicles; Driveway; Garage faces front
- Utilities: City water; City sewer; Electricity available; Sewer available
- Home design: Single family residence; Residential property; One story; Preowned (built in 1985)
- Construction: Brick exterior; Built in 1985
- Exterior features: Fenced yard; Curbs and sidewalks; Concrete surfaces
Interior
- Kitchen: Dishwasher; Disposal; Electric cooktop; Electric range
- Bedrooms: 2 bedrooms (both on main level)
- Bathrooms: 2 full bathrooms
- Heating & cooling: Central heating (electric); Central air conditioning (electric)
- Interior features: One-level layout; Wood-burning fireplace; 4 total rooms; 1 living area; 1 dining area; Other interior features
- Laundry & utility: Washer/dryer hookup (utility details not specified)
Neighborhood map
What this means for you Summary
Snapshot
- This is a 3-bed/2.0-bath single-family listed at $239k.
Deal economics
- At list price, monthly cash flow is $-87 ($-1k/yr) — negative.
- To cash-flow at today's rent, offer at most $224k (6.4% below list).
- To meet the 1% rule (rent ≥ 1% of price), the offer needs to be $207k (13.3% below list).
- Recommended offer: $207k (13.3% below list) — sets the bar for 1% rule.
- Cap rate 5.9% vs local median 3.6% in Arlington — top-decile yield for the area; either an underpriced asset or a hidden risk that comps aren't pricing in. Stress-test before assuming the spread holds.
Location & tenants
- Location reads 78/100 on livability (#75 in TX, #2,697 nationally) — a middle-class / working-renter tenant base. Strengths: amenities A+, cost of living A+, housing A+; Watch: crime F, commute F.
- Arlington ISD (urban): math 24% / reading 34% proficiency, ranked #629 of 826 in TX (top 76%) — low school quality limits family demand, transient renter base, plan for 1-2y turnover.
- Zoned schools: Amos El (math 17% / reading 27%, grade F, #3,333 of 4,322 statewide, top 80%, 381 students, 89% FRL); Ousley J H (math 37% / reading 49%, grade D-, #540 of 1,662 statewide, top 33%, 876 students, 78% FRL); Seguin H S (math 32% / reading 45%, grade F, #866 of 1,632 statewide, top 54%, 1,529 students, 72% FRL) — zoned schools average 79% FRL vs 60% district-wide (20 pts higher); higher-poverty schools than district average — tighter screening recommended.
- Market conditions: Rents rising (+1.4%/yr); 80 active listings in the ZIP; 40 comparable units currently listed for rent nearby; rentals at typical pace (median 22d on market — plan ~3-4 weeks tenant-placement turnaround); solid renter incomes; 18,938 units permitted in Tarrant County in 2024 (8,336 in 5+ unit buildings).
Forward outlook
- Local home prices are declining (-3.0%/yr); year-one equity from $2k of loan paydown is wiped out by about $7k of value loss. Plan a longer hold.
- Tarrant County population projected at +41% by 2050 — long-run rental-demand tailwind backs the buy-and-hold thesis.
Negotiation context
- It's been on market 40 days — a 3% lower offer ($232k) is reasonable based on typical stale-listing flexibility.
Risks & watch-outs
- Climate carrying-cost: major wind risk, 27% chance of damaging wind over 30y; extreme-heat days projected 7→22/yr by 2055 (HVAC capex compounding) — expect insurance premiums to compound above CPI over the hold.
Questions for the listing agent
- What do current leases actually rent for vs. the listed asking? Can we see a recent rent roll and the last 12 months of T-12 income?
- It's been on market 40 days. Have you received any prior offers? Is the seller open to a 13% concession, seller financing, or rate buy-down credit?
- Is there a deadline driving the sale (1031 exchange, divorce, estate, relocation)? That informs how much negotiation room exists.
- Schools are D-rated, which usually means shorter tenancies and higher turnover. Who's the typical renter profile here, and what's been the actual vacancy rate?
- Crime grade is F in this area — have there been break-ins, vandalism, or insurance claims at this property in the last 3 years? What carrier currently insures it and at what premium?
- The area grade is low — what's the realistic commute time and amenity access for the typical tenant pool here? Any planned neighborhood developments (good or bad) we should know about?
- What's the average days-on-market for RENTAL listings here right now (not sales)? A rising rental-DOM trend means longer vacancies and softer asking-rent achievability than the comps imply.
- What's the recent tenant-quality profile in this submarket — average credit score on applications, eviction rate, late-payment / NSF rate, and stable-employment percentage? A property-management company in the area should have these aggregated.
- How much new for-sale + rental construction is in the pipeline within 1–3 miles? Heavy new supply typically softens prices + rents 12–24 months out; constrained supply supports both.
Investment metrics
- 1% rule
- 0.87% ✗
- Cap rate
- 5.86%
- Cash-on-cash
- -1.55%
- DSCR
- 0.93
- GRM
- 9.6
CMA / ARV
- ARV (median comp)
- $266,654
- List price
- $239,000
- Delta
- -10.37%
- Verdict
- UNDERPRICED
- Comps
- 20 within 1.0 mi
Show comp detail 12 sales within ~0.75 mi
| Address | Dist | Beds/Ba | Sqft | Sold | Price | $/sf | Match |
|---|---|---|---|---|---|---|---|
| 224 Valley Spring Dr | 0.14mi | 2/2.0 (-1) | 1,010 (0%) | 4mo | $220,000 | $218 | 85 |
| 323 Valley Spring Dr | 0.00mi | 2/2.0 (-1) | 1,120 (+11%) | 0mo | $239,000 | $213 | 77 |
| 5604 Congressional Dr | 0.38mi | 3/2.0 | 1,095 (+8%) | 2mo | $235,000 | $215 | 66 |
| 6205 Patriotic Ct | 0.43mi | 2/2.0 (-1) | 1,024 (+1%) | 8mo | $249,900 | $244 | 66 |
| 507 British Ct | 0.60mi | 3/1.0 | 1,005 (-0%) | 10mo | $229,000 | $228 | 59 |
| 115 Valley Spring Dr | 0.25mi | 2/2.0 (-1) | 1,136 (+12%) | 6mo | $220,000 | $194 | 58 |
| 531 Valley Mills Dr | 0.32mi | 3/2.0 | 1,136 (+12%) | 13mo | $265,000 | $233 | 53 |
| 201 Caprock Dr | 0.23mi | 3/2.0 | 1,136 (+12%) | 21mo | $239,000 | $210 | 51 |
| 418 Betsy Ross Dr | 0.62mi | 2/2.0 (-1) | 1,003 (-1%) | 17mo | $245,000 | $244 | 51 |
| 6016 Hollyleaf Dr | 0.52mi | 2/2.0 (-1) | 1,082 (+7%) | 19mo | $280,000 | $259 | 43 |
| 5314 Umbrella Pine Ct | 0.65mi | 3/1.0 | 1,140 (+13%) | 3mo | $225,000 | $197 | 42 |
| 5302 Yaupon Dr | 0.68mi | 2/1.0 (-1) | 1,059 (+5%) | 16mo | $229,000 | $216 | 38 |
Match score weights: distance 35% · size 25% · config 20% · recency 20%. Top-matched comps best support the ARV.
Projected returns pro-forma
-3.0% appreciation · 1.39% rent growth · sell at horizon
- IRR
- -20.7%
- Equity multiple
- 0.29×
- Total profit
- $-47,481
- Equity at exit
- $35,636
- IRR
- -18.2%
- Equity multiple
- 0.08×
- Total profit
- $-61,280
- Equity at exit
- $20,664
Cash invested: $66,920 (down + closing). Projections, not guarantees.
Landlord ↔ Tenant lean methodology
- Overall (STATE)
- 87 Strongly Landlord-Friendly
- State Texas
- 87 Strongly Landlord-Friendly · R+5
- County
- — inherits STATE
- City
- — inherits STATE
ZIP-level market 76018
- Home prices YoY
- -2.8%
- Rents YoY
- 1.4%
- Active inventory
- 80
- Price-to-rent
- 9.6×
Monthly cashflow live
- Estimated rent
- $2,073 high interval (Pro) →
- Mortgage (P&I)
- −$1,253
- Tax from tax record
- −$372 /mo · $4,460/yr
- Insurance
- −$100
- HOA
- −$0
- Vacancy / Maint / Mgmt
- −$435
- Net cashflow
- $-87
Break-even live
Sensitivity live
| Price | -10% $49 | -5% $-19 | +0% $-87 | +5% $-154 | +10% $-222 |
|---|---|---|---|---|---|
| Rent | -10% $-251 | -5% $-169 | +0% $-87 | +5% $-5 | +10% $77 |
| Rate | -1.0pp $34 | -0.5pp $-26 | base $-87 | +0.5pp $-149 | +1.0pp $-212 |
UW: 25.0% down · 7.5% · 30yr · 1.5% tax · 5.0% vac · 8.0% maint · 8.0% mgmt
Financing live
Cash to close
- Down payment
- $59,750
- Closing costs
- $7,170
- Reserves months
- —
- Total cash needed
- —
Loan-product check · same deal, 3 products live
Conventional
25% down · 7.5% · 30yr
- Down + closing
- —
- Monthly P&I
- —
- Monthly cashflow
- —
- DSCR
- —
- Eligible?
- —
Personal DTI + credit; lowest rate.
DSCR
20% down · 8.5% · 30yr
- Down + closing
- —
- Monthly P&I
- —
- Monthly cashflow
- —
- DSCR
- —
- Eligible?
- —
No personal income docs; deal must DSCR.
Hard money
10% down · 12.0% · 12mo
- Down + closing
- —
- Monthly P&I
- —
- Monthly cashflow
- —
- DSCR
- —
- Eligible?
- —
Short-term bridge; refi at stabilization.
Rent comps 40 comps
| Address | Beds | Baths | Sqft | Rent | $/sqft | DOM | Units | Dist |
|---|---|---|---|---|---|---|---|---|
| 323 Moss Hill Dr Arlington, TX | 3.0 | 2.0 | 1053 | $1,900 | $1.80 | 9d | 1 | 0.07mi |
| 216 Caprock Dr Arlington, TX | 3.0 | 2.0 | 1211 | $1,850 | $1.53 | 18d | 1 | 0.15mi |
| 216 Caprock Dr Arlington, TX | 3.0 | 2.0 | 1211 | $1,850 | $1.53 | 5d | 1 | 0.15mi |
| 325 Angelina Dr Arlington, TX | 3.0 | 2.0 | 1441 | $1,900 | $1.32 | 9d | 1 | 0.16mi |
| 517 Valley Mills Dr Arlington, TX | 3.0 | 2.0 | 1200 | $1,800 | $1.50 | 45d | 1 | 0.29mi |
| 5907 Lovingham Ct Unit 5907 Arlington, TX | 3.0 | 2.0 | 1200 | $2,050 | $1.71 | 45d | 1 | 0.38mi |
| 222 Mahogany Dr Arlington, TX | 3.0 | 2.0 | 1421 | $2,160 | $1.52 | 18d | 1 | 0.40mi |
| 6306 Pilgrim Ln Arlington, TX | 3.0 | 2.0 | 1197 | $1,885 | $1.57 | 45d | 1 | 0.48mi |
| 6014 Hollyleaf Dr Arlington, TX | 3.0 | 2.5 | 1389 | $2,145 | $1.54 | 3d | 1 | 0.51mi |
| 101 Colony Dr Arlington, TX | 3.0 | 2.0 | 1400 | $2,055 | $1.47 | 45d | 1 | 0.54mi |
| 6202 Tidewater Dr Arlington, TX | 3.0 | 2.0 | 1424 | $2,100 | $1.47 | 21d | 1 | 0.55mi |
| 708 Port Richmond Way Arlington, TX | 3.0 | 2.0 | 1180 | $1,900 | $1.61 | 12d | 1 | 0.58mi |
| 746 Bonnet Trl Arlington, TX | 2.0 | 2.0 | 1416 | $2,175 | $1.54 | 26d | 1 | 0.64mi |
| 529 Nightshade Dr Arlington, TX | 3.0 | 2.0 | 1208 | $1,950 | $1.61 | 0d | 1 | 0.65mi |
| 529 Nightshade Dr Arlington, TX | 3.0 | 2.0 | 1208 | $1,950 | $1.61 | 45d | 1 | 0.65mi |
| 920 Tennessee Trl Arlington, TX | 3.0 | 2.0 | 1500 | $2,095 | $1.40 | 3d | 1 | 0.67mi |
| 916 Ashmount Ln Arlington, TX | 3.0 | 2.0 | 1185 | $1,899 | $1.60 | 45d | 1 | 0.68mi |
| 734 Port Richmond Way Arlington, TX | 3.0 | 2.0 | 1424 | $2,050 | $1.44 | 45d | 1 | 0.69mi |
| 5304 Tamarack Ct Arlington, TX | 3.0 | 2.0 | 1452 | $2,211 | $1.52 | 0d | 1 | 0.70mi |
| 805 Greenridge Dr Arlington, TX | 3.0 | 2.0 | 1361 | $2,050 | $1.51 | 21d | 1 | 0.72mi |
| 405 Myrtle Dr Arlington, TX | 3.0 | 2.0 | 1371 | $2,100 | $1.53 | 9d | 1 | 0.72mi |
| 5310 Pampas Ct Arlington, TX | 3.0 | 2.0 | 1231 | $1,800 | $1.46 | 26d | 1 | 0.72mi |
| 816 W Colony Dr Arlington, TX | 3.0 | 2.0 | 1296 | $2,025 | $1.56 | 20d | 1 | 0.73mi |
| 231 Myrtle Dr Arlington, TX | 3.0 | 2.0 | 1346 | $1,785 | $1.33 | 45d | 1 | 0.77mi |
| 405 Lemon Dr Arlington, TX | 3.0 | 2.0 | 1371 | $1,875 | $1.37 | 14d | 1 | 0.77mi |
| 6403 Jennie Ln Arlington, TX | 3.0 | 2.0 | 1491 | $2,400 | $1.61 | 45d | 1 | 0.78mi |
| 230 Lemon Dr Arlington, TX | 3.0 | 2.0 | 1389 | $1,990 | $1.43 | 45d | 1 | 0.80mi |
| 322 Juniper Dr Arlington, TX | 3.0 | 2.0 | 1326 | $1,800 | $1.36 | 18d | 1 | 0.88mi |
| 911 Pinion Dr Arlington, TX | 3.0 | 2.0 | 1299 | $1,400 | $1.08 | 45d | 1 | 0.88mi |
| 312 Juniper Dr Arlington, TX | 3.0 | 2.0 | 1101 | $1,895 | $1.72 | 0d | 1 | 0.90mi |
| 312 Juniper Dr Arlington, TX | 3.0 | 2.0 | 1101 | $1,995 | $1.81 | 24d | 1 | 0.90mi |
| 312 Juniper Dr Arlington, TX | 3.0 | 2.0 | 1101 | $1,995 | $1.81 | 26d | 1 | 0.90mi |
| 863 Valleybrooke Dr Arlington, TX | 3.0 | 2.0 | 1123 | $1,950 | $1.74 | 45d | 1 | 0.91mi |
| 850 Colson Dr Arlington, TX | 3.0 | 2.0 | 1350 | $2,095 | $1.55 | 45d | 1 | 0.93mi |
| 1009 Danforth Ct Arlington, TX | 3.0 | 2.0 | 1436 | $2,050 | $1.43 | 4d | 1 | 0.94mi |
| 5211 Carpenter Dr Arlington, TX | 3.0 | 2.0 | 1268 | $1,945 | $1.53 | 26d | 1 | 0.94mi |
| 5211 Carpenter Dr Arlington, TX | 3.0 | 2.0 | 1268 | $1,945 | $1.53 | 19d | 1 | 0.94mi |
| 5216 Carpenter Dr Arlington, TX | 3.0 | 2.5 | 1276 | $1,925 | $1.51 | 20d | 1 | 0.95mi |
| 6301 Fairlane Dr Arlington, TX | 3.0 | 2.0 | 1420 | $1,900 | $1.34 | 26d | 1 | 0.95mi |
| 6216 Fairlane Dr Arlington, TX | 3.0 | 2.0 | 1270 | $1,900 | $1.50 | 14d | 1 | 0.97mi |
Listing history 11 events
-
2026-06-08statusdays on market $239,000 Pending 40 DOM
-
2026-06-07days on market $239,000 Active Option Contract 39 DOM
-
2026-06-04days on market $239,000 Active Option Contract 36 DOM
-
2026-06-03days on market $239,000 Active Option Contract 35 DOM
-
2026-06-02days on market $239,000 Active Option Contract 34 DOM
-
2026-06-02status $239,000 Active Option Contract 33 DOM
-
2026-06-01days on market $239,000 Active 33 DOM
-
2026-05-31days on market $239,000 Active 32 DOM
-
2026-04-29$239,000 Active 288-char remark
-
2012-12-28soldstatus
-
1985-12-02soldstatus
ⓘ Source: listings_history table (triggers on properties + properties_extension) + one-shot
backfill from property_details.listing_events for pre-trigger history.
Tax reassessment forecast TX · Resets to sale price
- Current annual tax
- $4,460 · $372/mo
- Projected year-2 tax
- $4,460 · $372/mo
- Expected delta
- $0/yr ($0/mo · 0.0%)
ⓘ Screening estimate from a state-policy table — verify with the county assessor before closing.
Climate risk First Street
- Flood 1/10 Low FEMA zone X (unshaded) · 0% chance over 30 yrs
- Wildfire 3/10 Moderate
- Heat 7/10 Severe 7 d/yr ≥110°F today · 22 d/yr by 30 yrs out
- Wind 6/10 Major 27% chance of damaging wind over 30 yrs
- Air quality 3/10 Moderate 2 unhealthy d/yr today · 3 by 30 yrs out
Nearby sold comps map
Loading sold comps map…
Walkable amenities ~0.75 mi
Loading nearby amenities…
Taxation est. · year 1
- Rental income
- $24,879
- − Mortgage interest
- −$13,388
- − Property taxes
- −$4,460
- − Insurance
- −$1,195
- − Repairs & maintenance
- −$1,990
- − Management
- −$1,990
- − Depreciation
- −$6,953
- Taxable loss
- −$5,097
- Est. tax savings @ 24.0%
- +$1,223
- After-tax cash flow
- $183/yr
For passive investors: Depreciation is non-cash, so a rental often shows a tax loss while cash-flowing — sheltering income. Rental losses are passive: they offset passive income freely, and up to $25,000/yr can offset ordinary (W-2) income if you actively participate and your MAGI is under $100k (phasing out to $0 by $150k); unused losses carry forward. On sale, claimed depreciation is recaptured at up to 25%, and gains may owe capital-gains tax (a 1031 exchange can defer both). Figures are a year-1 estimate at your 24.0% rate — not tax advice; consult a CPA.
Schools (NCES district)
- District
- Arlington ISD
- NCES district ID
- 4808700
- Math proficiency
- 24% ▼ -21.00%
- Reading proficiency
- 34% ▼ -8.00%
- Median HH income
- $50,873
- Composite
- 25.42/100
- National rank
- #7458
- State rank
- #629 of 826 in TX
Livability — Arlington
- Score
- 78/100
- State rank
- #75
- US rank
- #2697
Category grades
Schools grade is shown separately in the Schools card above.
Census & demographics
- Census place
- Arlington, TX
- County
- Tarrant County · 2,033,669 people
- City population
- 366,588
- Metro
- Dallas-Fort Worth-Arlington, TX
- Population (ZIP)
- 26,834
- Household income
- $88,288
- Rent vs Own
- Severe rent burden
- 598.0
Population outlook (Tarrant County) Hauer SSP2
- Today (2025)
- 2,380,417 people
- By 2030
- 2,578,900 · +8.3%
- By 2040
- 2,974,995 · +25.0%
- By 2050
- 3,350,489 · +40.8%
- By 2075
- 4,216,909 · +77.2%
- By 2100
- 4,741,527 · +99.2%
Race, ethnicity, and origin ACS 2023
- Neighborhood character
- Highly diverse neighborhood (Simpson 0.76)
- Race & ethnicity
- Hispanic / Latino 34% Black 24% White 23% Asian 14% Two or more races 14% Native American 2%
- Hispanic origin (detail)
- Mexican 26%
- Common ancestry
- Slovak 1% Romanian 1% Lithuanian 0%
- Foreign-born
- 20% · Canada, Vietnam
- Languages at home
- 62% English-only · Spanish 22% Vietnamese 11% French/Haitian/Cajun 1%
Political lean MEDSL · Tarrant
- 2024 margin
- Lean R (+5.1) · D 46.7% · R 51.9% · Other 1.4%
- 2008→2024 swing
- +6.6pp toward D · 2008: -11.7pp · 2024: -5.1pp
- All cycles
- 2024: R+5.1 2020: D+0.2 2016: R+8.7 2012: R+15.7 2008: R+11.7
Not yet ingested
- Civics
- —
Market trends
- HPI YoY
- ▼ -8.64%
- Current HPI
- 296.8765
- Rent YoY
- ▲ 1.39%
- Metro
- Dallas-Fort Worth-Arlington, TX
- State GDP YoY
- ▲ 3.95%
- F500 in state
- 110
Industry mix (Fortune 500 HQ in TX)
| Industry | F500 HQs | Revenue |
|---|---|---|
| Energy | 16 | $1,198B |
|
||
| Technology | 5 | $198B |
|
||
| Engineering / Construction | 4 | $72B |
|
||
| Energy Services | 3 | $60B |
|
||
| Utilities | 3 | $41B |
|
||
| Healthcare | 2 | $330B |
|
||
Price history
6 events — show timeline
- 2026-06-17 Sold (MLS) — NTREIS
- 2026-06-08 Pending — NTREIS
- 2026-06-01 Contingent — NTREIS
- 2026-04-29 Listed $239,000 NTREIS
- 2012-12-28 Sold (Public Records) — Public Records
- 1985-12-02 Sold (Public Records) — Public Records
Property tax history
+6.4%/yrLatest (2025): $4,460 · -2.5% YoY. Source: county tax records.
Cash-flow waterfall
monthlySold comps — $/sqft
last 12 mo · ≤1 miLoading sold comps…