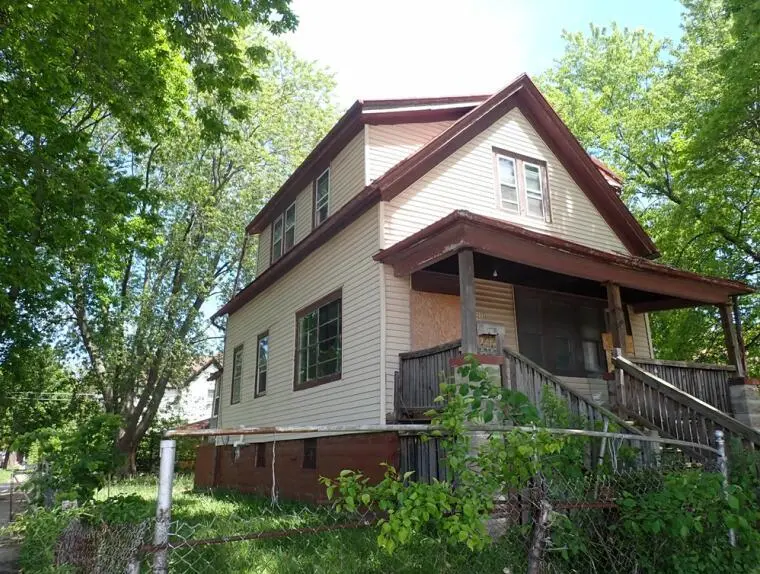
2532 W Lloyd St · Milwaukee, WI
Flood risk 7/10 · Major
- FEMA flood zone
- X (unshaded)
- Chance of flooding over 30 yrs
- 0.76%
- Est. flood insurance / yr
- $473 – $860
Fire risk 1/10 · Minimal
- Est. fire insurance / yr
- $636 – $1,182
Heat risk 2/10 · Minimal
- Hot days now (above 98°F)
- 7 days/yr
- Hot days in 30 yrs
- 13 days/yr
Wind risk 2/10 · Minimal
- Chance of severe wind over 30 yrs
- —
Air-quality risk 3/10 · Minor
- Unhealthy air days now
- 3 days/yr
- Unhealthy air days in 30 yrs
- 4 days/yr
Risk factors via First Street. Map © Google.
Why this score? — see what drove the A- grade
The composite is a weighted blend of 9 inputs, each scored 0–100. Each bar is that input's sub-score; the figure is the points it added to the 100-point composite (weight × sub-score).
- Cash flow +30.0/30.0
- ARV discount +15.0/15.0
- 1% rule +10.0/10.0
- DSCR +10.0/10.0
- Appreciation +6.5/10.0
- Livability +4.0/5.0
- Rent growth +2.5/5.0
- Condition / age +2.5/5.0
- Schools +1.2/10.0
$74,800
🖨 Deal sheet 📄 Offer letter ✓ Due diligence
Listing remarks
This is a tax foreclosed property. For the first 30-days of the listing period, no offers below listing price will be considered per Wisconsin foreclosure law. Offers from Owner Occupants will be considered preferred bidders. Bids due by July 13th, 2026 at 10:00 am
Key facts
- 0.3 acre lot
- Built 1868
- Listed 10 days
Property features AI
Finance
- Other: Lot size approximately 0.3 acres (less than 1/2 acre); Zoned RT4
Exterior
- Utilities: Municipal water; Municipal sewer
- Home design: Single-family, 1-story home; Approximately 1,251–1,500 total living area
- Construction: Assessor/Public Record for year built
- Exterior features: Aluminum and vinyl exterior
Interior
- Kitchen: Kitchen on main level (10 x 10)
- Bedrooms: Main level master bedroom (10 x 10)
- Bathrooms: 1 full bathroom
- Heating & cooling: Forced air heating; Natural gas fuel
- Interior features: Full basement
Neighborhood map
What this means for you Summary
Snapshot
- This is a 3-bed/1.5-bath single-family listed at $75k.
Deal economics
- At list price, monthly cash flow is $361 ($4k/yr) — positive.
- The deal already cash-flows at list — no discount required.
- Meets the 1% rule at list price ($1k rent vs $75k).
- Cap rate 13.0% vs local median 5.1% in Milwaukee — top-decile yield for the area; either an underpriced asset or a hidden risk that comps aren't pricing in. Stress-test before assuming the spread holds.
Location & tenants
- Location reads 81/100 on livability (#55 in WI, #1,534 nationally) — a professional / high-income tenant draw. Strengths: amenities A+, commute A+, cost of living A+; Watch: employment D+, schools F, crime F.
- Milwaukee School District (urban): math 10% / reading 18% proficiency, ranked #337 of 342 in WI (top 98%) — low school quality limits family demand, transient renter base, plan for 1-2y turnover; 77% free/reduced lunch — lower-income household profile, screen leases tightly.
- Market conditions: 28 active listings in the ZIP; 40 comparable units currently listed for rent nearby; rentals at typical pace (median 24d on market — plan ~3-4 weeks tenant-placement turnaround); 40% of comp listings sitting > 30 days — soft ceiling on asking rent; lower-income renter base — watch delinquency; 1,017 units permitted in Milwaukee County in 2024 (803 in 5+ unit buildings).
- At $1,379/mo this rent would consume 52% of the median local household income ($32k/yr) (locally 636% of renters already pay >50% of income on rent) — very limited rent-growth headroom before tenants either downsize or default.
Forward outlook
- In year one you build about $3k of equity ($517 loan paydown + $2k appreciation (3.0% local appreciation)).
- Milwaukee County population projected at +4% by 2050 — modest demand growth; plan on rents tracking national, not racing it.
- At projected returns (3.0% appreciation + 3.0% rent growth), your $21k cash investment doubles in ~3 years — after that, you're playing with house money.
Negotiation context
- Only 10 days on market — expect competitive offers; lowballing is unlikely to land.
Risks & watch-outs
- Watch-outs: property tax is 4.0% of price; flood insurance adds $56/mo; built in 1868 — expect roof / HVAC / electrical / plumbing capex.
- Climate carrying-cost: major flood risk — expect insurance premiums to compound above CPI over the hold.
Questions for the listing agent
- Built in 1868 — when were the roof, HVAC, electrical panel, plumbing, and water heater last replaced?
- Property tax is high relative to price — has the assessment been appealed recently, and will the sale trigger a re-assessment?
- What's the actual annual flood-insurance premium (NFIP or private), and is the property in a SFHA with mandatory coverage?
- Is there a deadline driving the sale (1031 exchange, divorce, estate, relocation)? That informs how much negotiation room exists.
- Schools are F-rated, which usually means shorter tenancies and higher turnover. Who's the typical renter profile here, and what's been the actual vacancy rate?
- Crime grade is F in this area — have there been break-ins, vandalism, or insurance claims at this property in the last 3 years? What carrier currently insures it and at what premium?
- What's the average days-on-market for RENTAL listings here right now (not sales)? A rising rental-DOM trend means longer vacancies and softer asking-rent achievability than the comps imply.
- What's the recent tenant-quality profile in this submarket — average credit score on applications, eviction rate, late-payment / NSF rate, and stable-employment percentage? A property-management company in the area should have these aggregated.
- How much new for-sale + rental construction is in the pipeline within 1–3 miles? Heavy new supply typically softens prices + rents 12–24 months out; constrained supply supports both.
Investment metrics
- 1% rule
- 1.84% ✓
- Cap rate
- 12.97%
- Cash-on-cash
- 23.86%
- DSCR
- 2.06
- GRM
- 4.5
CMA / ARV
- ARV (on-the-fly)
- $147,393
- Comps found
- 12
Show comp detail 12 sales within ~0.75 mi
| Address | Dist | Beds/Ba | Sqft | Sold | Price | $/sf | Match |
|---|---|---|---|---|---|---|---|
| 2027 N 23rd St | 0.24mi | 3/2.0 | 1,540 (+8%) | 10mo | $172,000 | $112 | 66 |
| 1949 N 22nd St | 0.32mi | 3/1.0 | 1,360 (-5%) | 14mo | $135,000 | $99 | 63 |
| 2200 W Galena St | 0.53mi | 3/1.5 | 1,512 (+6%) | 6mo | $155,000 | $103 | 61 |
| 1815 W Galena St | 0.70mi | 3/1.5 | 1,326 (-7%) | 0mo | $135,000 | $102 | 55 |
| 2456 N 21st St | 0.55mi | 4/1.0 (+1) | 1,369 (-4%) | 12mo | $140,000 | $102 | 50 |
| 2816 W Vliet St | 0.65mi | 3/2.0 | 1,344 (-6%) | 11mo | $180,000 | $134 | 49 |
| 2462 N 23rd St | 0.47mi | 3/1.0 | 1,227 (-14%) | 7mo | $129,900 | $106 | 47 |
| 2464 N 34th St | 0.65mi | 3/2.0 | 1,280 (-11%) | 10mo | $195,000 | $152 | 42 |
| 2114 N 34th St | 0.51mi | 4/1.0 (+1) | 1,278 (-11%) | 12mo | $85,000 | $67 | 42 |
| 2457 N 25th St | 0.40mi | 4/1.0 (+1) | 1,230 (-14%) | 13mo | $126,500 | $103 | 41 |
| 2518 N 27th St | 0.47mi | 4/1.0 (+1) | 1,582 (+11%) | 18mo | $130,000 | $82 | 38 |
| 2634 N 24th Pl | 0.63mi | 4/1.0 (+1) | 1,256 (-12%) | 15mo | $98,000 | $78 | 31 |
Match score weights: distance 35% · size 25% · config 20% · recency 20%. Top-matched comps best support the ARV.
Projected returns pro-forma
3.02% appreciation · 3.0% rent growth · sell at horizon
- IRR
- 27.1%
- Equity multiple
- 2.54×
- Total profit
- $32,240
- Equity at exit
- $33,732
- IRR
- 27.8%
- Equity multiple
- 4.95×
- Total profit
- $82,662
- Equity at exit
- $52,062
Cash invested: $20,944 (down + closing). Projections, not guarantees.
Landlord ↔ Tenant lean methodology
- Overall (STATE)
- 73 Landlord-Friendly
- State Wisconsin
- 73 Landlord-Friendly · R+2
- County
- — inherits STATE
- City
- — inherits STATE
ZIP-level market 53205
- Home prices YoY
- 0.8%
- Active inventory
- 28
- Price-to-rent
- 4.5×
Monthly cashflow live
- Estimated rent
- $1,379 high interval (Pro) →
- Mortgage (P&I)
- −$392
- Tax from tax record
- −$250 /mo · $2,998/yr
- Insurance
- −$31
- Flood insurance flood zone
- −$56 /mo · $666/yr
- HOA
- −$0
- Vacancy / Maint / Mgmt
- −$290
- Net cashflow
- $361
Break-even live
UW: 25.0% down · 7.5% · 30yr · 1.5% tax · 5.0% vac · 8.0% maint · 8.0% mgmt
Financing live
Cash to close
- Down payment
- $18,700
- Closing costs
- $2,244
- Reserves months
- —
- Total cash needed
- —
Loan-product check · same deal, 3 products live
Conventional
25% down · 7.5% · 30yr
- Down + closing
- —
- Monthly P&I
- —
- Monthly cashflow
- —
- DSCR
- —
- Eligible?
- —
Personal DTI + credit; lowest rate.
DSCR
20% down · 8.5% · 30yr
- Down + closing
- —
- Monthly P&I
- —
- Monthly cashflow
- —
- DSCR
- —
- Eligible?
- —
No personal income docs; deal must DSCR.
Hard money
10% down · 12.0% · 12mo
- Down + closing
- —
- Monthly P&I
- —
- Monthly cashflow
- —
- DSCR
- —
- Eligible?
- —
Short-term bridge; refi at stabilization.
Rent comps 40 comps
| Address | Beds | Baths | Sqft | Rent | $/sqft | DOM | Units | Dist |
|---|---|---|---|---|---|---|---|---|
| 2119 W Brown St Milwaukee, WI | 3.0 | 1.0 | 1754 | $995 | $0.57 | 3d | 1 | 0.35mi |
| 2201 N 32nd St Unit 2201 Milwaukee, WI | 3.0 | 1.0 | 1100 | $1,195 | $1.09 | 16d | 1 | 0.43mi |
| 3109 W Walnut St Milwaukee, WI | 2.0 | 1.0 | 1000 | $1,095 | $1.09 | 44d | 1 | 0.52mi |
| 2809 W Clarke St Unit 12811 Milwaukee, WI | 3.0 | 1.0 | 1400 | $1,200 | $0.86 | 17d | 1 | 0.56mi |
| 2308 W Clarke St Milwaukee, WI | 4.0 | 2.0 | 1545 | $1,750 | $1.13 | 23d | 1 | 0.61mi |
| 1639 N 33rd St Milwaukee, WI | 3.0 | 1.0 | 1424 | $950 | $0.67 | 23d | 1 | 0.62mi |
| 2630 N 24th St Milwaukee, WI | 2.0 | 1.0 | 934 | $1,450 | $1.55 | 20d | 1 | 0.64mi |
| 1515 N 32nd St Unit 1515 Milwaukee, WI | 3.0 | 1.0 | 1200 | $1,245 | $1.04 | 4d | 1 | 0.67mi |
| 1430 N 21st St Unit 2 Milwaukee, WI | 2.0 | 1.0 | 1000 | $975 | $0.97 | 44d | 1 | 0.70mi |
| 2419 W McKinley Ave Milwaukee, WI | 2.0 | 1.0 | 1852 | $1,200 | $0.65 | 44d | 1 | 0.77mi |
| 1239 N 26th St Unit 1 Milwaukee, WI | 3.0 | 1.0 | 1300 | $1,400 | $1.08 | 44d | 1 | 0.78mi |
| 1239 N 26th St Unit 1 Milwaukee, WI | 3.0 | 1.0 | 1300 | $1,400 | $1.08 | 44d | 1 | 0.78mi |
| 1235 N 26th St Milwaukee, WI | 3.0 | 1.0 | 900 | $950 | $1.06 | 44d | 1 | 0.78mi |
| 2741 N 23rd St Milwaukee, WI | 3.0 | 1.0 | 900 | $1,050 | $1.17 | 14d | 1 | 0.78mi |
| 2741 N 23rd St Unit 2 Milwaukee, WI | 3.0 | 1.0 | 1000 | $1,100 | $1.10 | 17d | 1 | 0.78mi |
| 2765 N 26th St Unit 2 Milwaukee, WI | 2.0 | 1.0 | 1100 | $1,100 | $1.00 | 4d | 1 | 0.78mi |
| 2765 N 26th St Unit 1 Milwaukee, WI | 3.0 | 1.0 | 1125 | $1,200 | $1.07 | 4d | 1 | 0.78mi |
| 3100 W Center St Milwaukee, WI | 3.0 | 2.0 | 1174 | $1,531 | $1.30 | 2d | 1 | 0.79mi |
| 2001 N 38th St #2003 Milwaukee, WI | 3.0 | 1.0 | 1326 | $950 | $0.72 | 2d | 1 | 0.79mi |
| 2478-2480 W Juneau Ave Unit 2478 Milwaukee, WI | 4.0 | 1.0 | 1375 | $1,495 | $1.09 | 23d | 1 | 0.82mi |
| 2610 W Juneau Ave Unit 2610 Milwaukee, WI | 3.0 | 1.0 | 893 | $1,400 | $1.57 | 23d | 1 | 0.82mi |
| 2530 N 37th St Milwaukee, WI | 2.0 | 1.0 | 1037 | $1,000 | $0.96 | 14d | 1 | 0.84mi |
| 2403-2405 N 39th St Unit 2403 Lower Milwaukee, WI | 3.0 | 1.0 | 1200 | $995 | $0.83 | 10d | 1 | 0.90mi |
| 2403-2405 N 39th St Unit 2405 Upper Milwaukee, WI | 3.0 | 1.0 | 1141 | $995 | $0.87 | 10d | 1 | 0.90mi |
| 2870 N 29th St #2872 Milwaukee, WI | 3.0 | 1.0 | 1300 | $1,250 | $0.96 | 44d | 1 | 0.93mi |
| 2251 N 41st St Unit Lower Milwaukee, WI | 3.0 | 1.0 | 1187 | $1,198 | $1.01 | 14d | 1 | 0.97mi |
| 2945 N 23rd St Milwaukee, WI | 3.0 | 1.0 | 1014 | $1,195 | $1.18 | 44d | 1 | 1.03mi |
| 2512 N 41st St #2514 Milwaukee, WI | 2.0 | 1.0 | 1007 | $1,200 | $1.19 | 44d | 1 | 1.03mi |
| 936 N 25th St Unit 1 Milwaukee, WI | 2.0 | 1.0 | 900 | $1,338 | $1.49 | 44d | 1 | 1.07mi |
| 2931 W Chambers St Milwaukee, WI | 2.0 | 1.0 | 1400 | $1,050 | $0.75 | 23d | 1 | 1.08mi |
| 2232 N 44th St Unit 2234 Upper Milwaukee, WI | 3.0 | 1.0 | 1000 | $1,195 | $1.20 | 44d | 1 | 1.15mi |
| 2955 N 17th St Unit B UPSTAIRS Milwaukee, WI | 2.0 | 1.0 | 1000 | $900 | $0.90 | 17d | 1 | 1.16mi |
| 2331 N 44th St #2333 Milwaukee, WI | 2.0 | 1.0 | 1000 | $995 | $0.99 | 44d | 1 | 1.19mi |
| 1116 N 13th St Milwaukee, WI | 3.0 | 1.0 | 1400 | $1,345 | $0.96 | 14d | 1 | 1.27mi |
| 3124 N 33rd St Milwaukee, WI | 2.0 | 1.0 | 1200 | $1,200 | $1.00 | 44d | 1 | 1.31mi |
| 1303 N 10th St Milwaukee, WI | 3.0 | 1.0–2.0 | 797 | $2,990 | $3.75 | 2d | 26 | 1.31mi |
| 2712 N 44th St Unit 2712A Milwaukee, WI | 2.0 | 1.0 | 911 | $995 | $1.09 | 23d | 1 | 1.34mi |
| 2663 N 44th St Unit 1 Milwaukee, WI | 2.0 | 1.0 | 900 | $995 | $1.11 | 44d | 1 | 1.34mi |
| 2713 N 44th St Milwaukee, WI | 3.0 | 1.0 | 1450 | $1,350 | $0.93 | 44d | 1 | 1.37mi |
| 1009 W Juneau Ave Unit 114 Milwaukee, WI | 2.0 | 1.5 | 900 | $2,350 | $2.61 | 44d | 1 | 1.38mi |
Listing history 8 events
-
2026-06-18days on market $74,800 Active 10 DOM
-
2026-06-17days on market $74,800 Active 9 DOM
-
2026-06-16days on market $74,800 Active 8 DOM
-
2026-06-15days on market $74,800 Active 7 DOM
-
2026-06-13days on market $74,800 Active 5 DOM
-
2026-06-13days on market $74,800 Active 4 DOM
-
2026-06-08remarks 265-char remark
-
2026-06-08$74,800 Active 1 DOM
ⓘ Source: listings_history table (triggers on properties + properties_extension) + one-shot
backfill from property_details.listing_events for pre-trigger history.
Tax reassessment forecast WI · Partial reset (capped growth)
- Current annual tax
- $2,998 · $250/mo
- Projected year-2 tax
- $2,998 · $250/mo
- Expected delta
- $0/yr ($0/mo · 0.0%)
ⓘ Screening estimate from a state-policy table — verify with the county assessor before closing.
Climate risk First Street
- Flood 7/10 Severe FEMA zone X (unshaded) · 76% chance over 30 yrs
- Wildfire 1/10 Low
- Heat 2/10 Low 7 d/yr ≥98°F today · 13 d/yr by 30 yrs out
- Wind 2/10 Low
- Air quality 3/10 Moderate 3 unhealthy d/yr today · 4 by 30 yrs out
Nearby sold comps map
Loading sold comps map…
Walkable amenities ~0.75 mi
Loading nearby amenities…
Taxation est. · year 1
- Rental income
- $16,552
- − Mortgage interest
- −$4,190
- − Property taxes
- −$2,998
- − Insurance
- −$1,040
- − Repairs & maintenance
- −$1,324
- − Management
- −$1,324
- − Depreciation
- −$2,176
- Taxable income
- $3,499
- Est. tax owed @ 24.0%
- −$840
- After-tax cash flow
- $3,491/yr
For passive investors: Depreciation is non-cash, so a rental often shows a tax loss while cash-flowing — sheltering income. Rental losses are passive: they offset passive income freely, and up to $25,000/yr can offset ordinary (W-2) income if you actively participate and your MAGI is under $100k (phasing out to $0 by $150k); unused losses carry forward. On sale, claimed depreciation is recaptured at up to 25%, and gains may owe capital-gains tax (a 1031 exchange can defer both). Figures are a year-1 estimate at your 24.0% rate — not tax advice; consult a CPA.
Schools (NCES district)
- District
- Milwaukee School District
- NCES district ID
- 5509600
- Math proficiency
- 10% ▼ -5.00%
- Reading proficiency
- 18% ▬ 0.00%
- Median HH income
- $36,339
- Composite
- 11.61/100
- National rank
- #9696
- State rank
- #337 of 342 in WI
Livability — Milwaukee
- Score
- 81/100
- State rank
- #55
- US rank
- #1534
Category grades
Schools grade is shown separately in the Schools card above.
Census & demographics
- Census place
- Milwaukee, WI
- County
- Milwaukee County · 926,379 people
- City population
- 573,768
- Metro
- Milwaukee-Waukesha, WI
- Population (ZIP)
- 9,265
- Household income
- $31,529
- Rent vs Own
- Severe rent burden
- 636.0
Population outlook (Milwaukee County) Hauer SSP2
- Today (2025)
- 995,758 people
- By 2030
- 1,009,124 · +1.3%
- By 2040
- 1,028,128 · +3.3%
- By 2050
- 1,040,066 · +4.4%
- By 2075
- 1,057,849 · +6.2%
- By 2100
- 1,039,774 · +4.4%
Race, ethnicity, and origin ACS 2023
- Neighborhood character
- Predominantly Black (80%)
- Race & ethnicity
- Black 80% Asian 7% White 6% Hispanic / Latino 6% Two or more races 3%
- Hispanic origin (detail)
- Mexican 4%
- Common ancestry
- Portuguese 1% Lithuanian 1% Swedish 1%
- Foreign-born
- 6% · Canada
- Languages at home
- 88% English-only · Other Asian/Pacific 5% Spanish 5%
Political lean MEDSL · Milwaukee
- 2024 margin
- Solid D (+38.5) · D 68.3% · R 29.8% · Other 1.8%
- 2008→2024 swing
- +2.7pp toward D · 2008: 35.9pp · 2024: 38.5pp
- All cycles
- 2024: D+38.5 2020: D+39.9 2016: D+37.5 2012: D+34.6 2008: D+35.9
Not yet ingested
- Civics
- —
Market trends
- HPI YoY
- ▲ 3.02%
- Current HPI
- 363.0038
- Rent YoY
- —
- Metro
- Milwaukee-Waukesha, WI
- State GDP YoY
- ▲ 2.10%
- F500 in state
- 20
Industry mix (Fortune 500 HQ in WI)
| Industry | F500 HQs | Revenue |
|---|---|---|
| Industrial Machinery | 4 | $23B |
|
||
| Industrial Technology | 2 | $36B |
|
||
| Insurance | 1 | $36B |
|
||
| Professional Services | 1 | $19B |
|
||
| Utilities | 1 | $9B |
|
||
| Consumer Goods | 1 | $3B |
|
||
Price history
1 event — show timeline
- 2026-06-08 Listed $74,800 METROMLS
Property tax history
+12.0%/yrLatest (2024): $2,998 · +30.7% YoY. Source: county tax records.
Cash-flow waterfall
monthlySold comps — $/sqft
last 12 mo · ≤1 miLoading sold comps…