4898 NW 29th Ct #412 · Lauderdale Lakes, FL
Flood risk No data
- FEMA flood zone
- —
- Chance of flooding over 30 yrs
- —
- Est. flood insurance / yr
- —
Fire risk No data
- Est. fire insurance / yr
- —
Heat risk No data
- Hot days now (above threshold)
- —
- Hot days in 30 yrs
- —
Wind risk No data
- Chance of severe wind over 30 yrs
- —
Air-quality risk No data
- Unhealthy air days now
- —
- Unhealthy air days in 30 yrs
- —
Risk factors via First Street. Map © Google.
Why this score? — see what drove the B grade
The composite is a weighted blend of 9 inputs, each scored 0–100. Each bar is that input's sub-score; the figure is the points it added to the 100-point composite (weight × sub-score).
- Cash flow +29.7/30.0
- 1% rule +10.0/10.0
- DSCR +10.0/10.0
- ARV discount +7.5/15.0
- Schools +4.1/10.0
- Livability +4.0/5.0
- Rent growth +2.6/5.0
- Condition / age +2.5/5.0
- Appreciation +0.0/10.0
$59,900
🖨 Deal sheet 📄 Offer letter ✓ Due diligence
Listing remarks
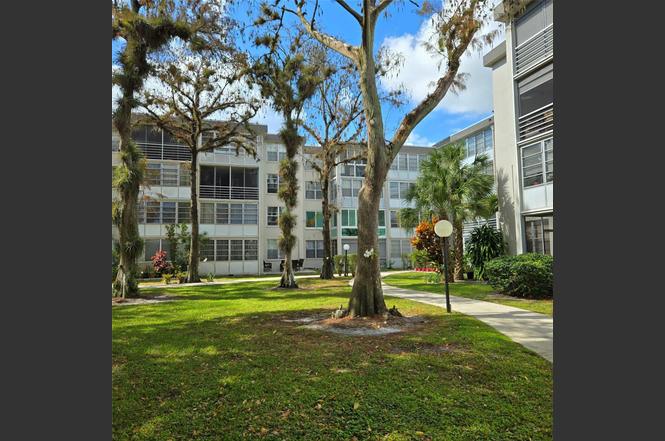
* HIDDEN GEM OF BROWARD COUNTY * PEACEFUL PARK-LIKE SETTING AMID COURTYARD STYLE BLDGS * COMMUNITY POOL, GRACEFUL TREES and WALKING PATHS * TOP FLOOR SEMI-UPDATED CONDO IN MOVE-IN CONDITION * Close to elevator, laundry room w/ view of parking spot from your front door * Freshly painted with NO wallpaper & NO carpet * Private, spacious screened patio overlooking garden & treetops * Some updates including vanity in bathroom, flooring and NO plastic ceiling in kitchen * Water Heater 2022 * Reasonable monthly fee includes extended cable, reserves & more * Pick-up trucks permitted but only (1) vehicle/unit * 700+ credit score all buyers * No income requ
Key facts
- Screened patio
- Water heater 2022
- Community pool
Tags
Property features AI
Finance
- Other: Senior community
- HOA & community: Has association; Monthly HOA fee; Association amenities include billiard room, clubhouse, picnic area, pool, storage, trash chute, and maintenance; HOA covers insurance, grounds and structure maintenance, pest control, sewer, trash, water, elevator, reserves, roof repairs, and pool service
Exterior
- Parking: Assigned parking (total 189 spaces)
- Utilities: Cable available
- Home design: Condominium; Resale unit; 4-story building; South-facing
- Construction: CBS construction
- Exterior features: Screened porch; Porch; Not waterfront
Interior
- Kitchen: Dishwasher; Electric range; Refrigerator
- Bedrooms: 1 bedroom (main level)
- Flooring: Laminate; Tile; Other
- Bathrooms: 1 full bathroom (main level)
- Heating & cooling: Central electric heating; Central electric cooling
- Interior features: Walk-in closets; Drapes and rods
Neighborhood map
What this means for you Summary
Snapshot
- This is a 1-bed/1.0-bath condo listed at $60k.
Deal economics
- At list price, monthly cash flow is $218 ($3k/yr) — positive.
- The deal already cash-flows at list — no discount required.
- Meets the 1% rule at list price ($2k rent vs $60k).
- Recommended offer: $56k (6.0% below list) — sets the bar for market timing.
- Cap rate 10.7% vs local median 5.6% in Lauderdale Lakes — top-decile yield for the area; either an underpriced asset or a hidden risk that comps aren't pricing in. Stress-test before assuming the spread holds.
Location & tenants
- Location reads 81/100 on livability (#100 in FL, #1,527 nationally) — a professional / high-income tenant draw. Strengths: commute A+, cost of living A+, housing A+; Watch: crime D+, amenities F, employment F.
- Broward (suburban): math 42% / reading 53% proficiency, ranked #46 of 73 in FL (top 63%) — families likely to look elsewhere, expect single-tenant / working-renter base with shorter leases.
- Zoned schools: Castle Hill Elementary School (math 22% / reading 22%, grade F, #2,080 of 2,144 statewide, top 97%, 562 students, 86% FRL); Boyd H. Anderson High School (math 10% / reading 14%, grade F, #622 of 667 statewide, top 93%, 2,038 students, 72% FRL) — zoned schools average 79% FRL vs 51% district-wide (28 pts higher); higher-poverty schools than district average — tighter screening recommended.
- Zoned-school proficiency averages 17% at this address vs 48% district-wide (-30 pts) — the specific schools serving this property underperform the Broward average; the district grade overstates school quality for this exact location.
- Market conditions: Rents flat; 656 active listings in the ZIP; 40 comparable units currently listed for rent nearby; rentals at typical pace (median 17d on market — plan ~3-4 weeks tenant-placement turnaround); 2,111 units permitted in Broward County in 2024 (1,265 in 5+ unit buildings).
- This rent runs 40% of the median local income ($46k/yr) — at the standard rent-burdened threshold; future hikes will face affordability resistance.
Forward outlook
- Local home prices are declining (-3.0%/yr); year-one equity from $414 of loan paydown is wiped out by about $2k of value loss. Plan a longer hold.
- Broward County population projected at +34% by 2050 — long-run rental-demand tailwind backs the buy-and-hold thesis.
Negotiation context
- It's been on market 62 days — a 6% lower offer ($56k) is reasonable based on typical stale-listing flexibility.
- 2 sale attempts since 9y ago; this cycle's ask has dropped $11k (16%) from the opening price — seller is motivated, your offer sets the floor, not the list.
- Current owner paid $41k; 46% above their basis — modest negotiation headroom, anchor on the comps not their cost.
Risks & watch-outs
- Watch-outs: property tax is 3.4% of price; HOA is 31% of rent.
Questions for the listing agent
- It's been on market 62 days. Have you received any prior offers? Is the seller open to a 6% concession, seller financing, or rate buy-down credit?
- Built in 1974 — when were the roof, HVAC, electrical panel, plumbing, and water heater last replaced?
- Property tax is high relative to price — has the assessment been appealed recently, and will the sale trigger a re-assessment?
- What does the HOA fee cover, when was the last increase, and are there any pending special assessments or reserve-fund shortfalls?
- Any open or pending special assessments — roof, HVAC, plumbing, elevator, façade? What's the per-unit balance and payoff schedule, and is the seller paying it off at close or rolling it to the buyer?
- Why hasn't it sold? Are there any deal-killer items the seller is aware of (foundation, flood, title, zoning, code violations)?
- Is there a deadline driving the sale (1031 exchange, divorce, estate, relocation)? That informs how much negotiation room exists.
- Crime grade is D in this area — have there been break-ins, vandalism, or insurance claims at this property in the last 3 years? What carrier currently insures it and at what premium?
- What's the average days-on-market for RENTAL listings here right now (not sales)? A rising rental-DOM trend means longer vacancies and softer asking-rent achievability than the comps imply.
- What's the recent tenant-quality profile in this submarket — average credit score on applications, eviction rate, late-payment / NSF rate, and stable-employment percentage? A property-management company in the area should have these aggregated.
- How much new apartment / multifamily construction is in the pipeline within 1–3 miles? Heavy new supply (>2% of stock underway) typically softens rents 12–24 months out; light construction supports rent growth.
Investment metrics
- 1% rule
- 2.55% ✓
- Cap rate
- 10.66%
- Cash-on-cash
- 15.60%
- DSCR
- 1.69
- GRM
- 3.3
CMA / ARV
No comps found within radius.
Projected returns pro-forma
-3.0% appreciation · 0.26% rent growth · sell at horizon
- IRR
- 0.7%
- Equity multiple
- 1.03×
- Total profit
- $453
- Equity at exit
- $8,931
- IRR
- 4.1%
- Equity multiple
- 1.23×
- Total profit
- $3,864
- Equity at exit
- $5,179
Cash invested: $16,772 (down + closing). Projections, not guarantees.
Landlord ↔ Tenant lean methodology
- Overall (STATE)
- 87 Strongly Landlord-Friendly
- State Florida
- 87 Strongly Landlord-Friendly · R+3
- County
- — inherits STATE
- City
- — inherits STATE
ZIP-level market 33313
- Rents YoY
- 0.3%
- Active inventory
- 656
- Price-to-rent
- 3.3×
Monthly cashflow live
- Estimated rent
- $1,530 high interval (Pro) →
- Mortgage (P&I)
- −$314
- Tax from tax record
- −$170 /mo · $2,044/yr
- Insurance
- −$25
- HOA
- −$481
- Vacancy / Maint / Mgmt
- −$321
- Net cashflow
- $218
Break-even live
UW: 25.0% down · 7.5% · 30yr · 1.5% tax · 5.0% vac · 8.0% maint · 8.0% mgmt
Financing live
Cash to close
- Down payment
- $14,975
- Closing costs
- $1,797
- Reserves months
- —
- Total cash needed
- —
Loan-product check · same deal, 3 products live
Conventional
25% down · 7.5% · 30yr
- Down + closing
- —
- Monthly P&I
- —
- Monthly cashflow
- —
- DSCR
- —
- Eligible?
- —
Personal DTI + credit; lowest rate.
DSCR
20% down · 8.5% · 30yr
- Down + closing
- —
- Monthly P&I
- —
- Monthly cashflow
- —
- DSCR
- —
- Eligible?
- —
No personal income docs; deal must DSCR.
Hard money
10% down · 12.0% · 12mo
- Down + closing
- —
- Monthly P&I
- —
- Monthly cashflow
- —
- DSCR
- —
- Eligible?
- —
Short-term bridge; refi at stabilization.
Rent comps 40 comps
| Address | Beds | Baths | Sqft | Rent | $/sqft | DOM | Units | Dist |
|---|---|---|---|---|---|---|---|---|
| 4851 NW 26th Ct #338 Lauderdale Lakes, FL | 1.0 | 1.0 | 705 | $1,650 | $2.34 | 16d | 1 | 0.14mi |
| 3001 NW 48th Ave #440 Lauderdale Lakes, FL | 1.0 | 1.5 | 705 | $1,300 | $1.84 | 24d | 1 | 0.23mi |
| 5021 W Oakland Park Blvd Lauderdale Lakes, FL | 1.0 | 1.0 | 684 | $1,550 | $2.27 | 17d | 2 | 0.24mi |
| 3061 NW 47th Ter Unit 327B Lauderdale Lakes, FL | 1.0 | 1.5 | 662 | $1,600 | $2.42 | 7d | 1 | 0.28mi |
| 3061 NW 47th Ter #327 Lauderdale Lakes, FL | 1.0 | 1.5 | 662 | $1,500 | $2.27 | 24d | 1 | 0.28mi |
| 3061 NW 47th Ter Unit 132C Lauderdale Lakes, FL | 1.0 | 1.0 | 610 | $1,500 | $2.46 | 24d | 1 | 0.28mi |
| 2901 NW 47th Ter Unit 247B Lauderdale Lakes, FL | 1.0 | 1.5 | 662 | $1,450 | $2.19 | 24d | 1 | 0.28mi |
| 2901 NW 47th Ter Unit 348B Lauderdale Lakes, FL | 1.0 | 1.5 | 662 | $1,350 | $2.04 | 24d | 1 | 0.28mi |
| 3141 NW 47th Ter Lauderdale Lakes, FL | 1.0–2.0 | 1.5–2.0 | 861 | $1,440 | $1.67 | 24d | 2 | 0.28mi |
| 3161 NW 47th Ter #110 Lauderdale Lakes, FL | 1.0 | 1.5 | 721 | $1,500 | $2.08 | 5d | 1 | 0.28mi |
| 3161 NW 47th Ter #111 Lauderdale Lakes, FL | 1.0 | 1.5 | 721 | $1,500 | $2.08 | 24d | 1 | 0.28mi |
| 5031 W Oakland Park Blvd Lauderdale Lakes, FL | 1.0 | 1.0 | 683 | $1,400 | $2.05 | 10d | 2 | 0.30mi |
| 3301 NW 47th Ter #308 Lauderdale Lakes, FL | 1.0 | 2.0 | 750 | $2,200 | $2.93 | 11d | 1 | 0.46mi |
| 3460 NW 50th Ave Lauderdale Lakes, FL | 1.0–2.0 | 1.0–2.0 | 750 | $1,499 | $2.00 | 16d | 3 | 0.52mi |
| 2800 NW 56th Ave Lauderhill, FL | 1.0–2.0 | 1.0–2.0 | 847 | $1,175 | $1.39 | 24d | 8 | 0.54mi |
| 2800 NW 56th Ave Lauderhill, FL | 1.0–2.0 | 1.0–2.0 | 847 | $1,250 | $1.48 | 2d | 8 | 0.54mi |
| 2800 NW 56th Ave Lauderhill, FL | 1.0–2.0 | 1.0–2.0 | 847 | $1,250 | $1.48 | 4d | 8 | 0.54mi |
| 2800 NW 56th Ave Lauderhill, FL | 1.0–2.0 | 1.0–2.0 | 847 | $1,480 | $1.75 | 15d | 6 | 0.54mi |
| 2800 NW 56th Ave Lauderhill, FL | 1.0–2.0 | 1.0–2.0 | 847 | $1,250 | $1.48 | 21d | 7 | 0.54mi |
| 3531 NW 50th Ave #609 Lauderdale Lakes, FL | 1.0 | 1.0 | 684 | $1,350 | $1.97 | 24d | 1 | 0.56mi |
| 5321 NW 21st Ct Lauderhill, FL | 2.0 | 1.0 | 750 | $1,900 | $2.53 | 24d | 1 | 0.61mi |
| 3030 NW 43rd Ter Lauderdale Lakes, FL | 1.0 | 1.0 | 592 | $1,400 | $2.36 | 1d | 2 | 0.65mi |
| 3030 NW 43rd Ter #102 Lauderdale Lakes, FL | 1.0 | 1.0 | 710 | $1,450 | $2.04 | 24d | 1 | 0.66mi |
| 2360 NW 56th Ave Lauderhill, FL | 1.0–3.0 | 1.0–2.0 | 924 | $1,435 | $1.55 | 2d | 22 | 0.69mi |
| 3033 NW 43rd Ave #108 Lauderdale Lakes, FL | 1.0 | 1.0 | 650 | $1,590 | $2.45 | 13d | 1 | 0.69mi |
| 2481 NW 56th Ave Unit 6-16 Lauderhill, FL | 1.0 | 1.0 | 745 | $1,600 | $2.15 | 16d | 1 | 0.77mi |
| 4121 NW 26th St Unit T16 Lauderhill, FL | 1.0 | 1.5 | 750 | $1,500 | $2.00 | 24d | 1 | 0.78mi |
| 4141 NW 26th St #316 Lauderhill, FL | 1.0 | 1.0 | 624 | $1,450 | $2.32 | 24d | 1 | 0.79mi |
| 2070 NW 43rd Ter #6 Lauderhill, FL | 1.0 | 1.0 | 600 | $1,600 | $2.67 | 21d | 1 | 0.83mi |
| 3720 Inverrary Dr Lauderhill, FL | 3.0 | 1.0–2.0 | 940 | $1,600 | $1.70 | 10d | 5 | 0.84mi |
| 4400 W Sunrise Blvd Fort Lauderdale, FL | 2.0 | 1.0–2.0 | 811 | $2,624 | $3.24 | 1d | 44 | 0.94mi |
| 2241 NW 59th Ter Unit 1 Lauderhill, FL | 2.0 | 1.0 | 735 | $1,850 | $2.52 | 24d | 1 | 0.94mi |
| 1861 NW 46th Ave Lauderhill, FL | 2.0 | 1.0–2.0 | 730 | $1,490 | $2.04 | 1d | 13 | 0.97mi |
| 6108 NW 26th St Sunrise, FL | 1.0–3.0 | 1.0–2.0 | 925 | $1,675 | $1.81 | 1d | 42 | 0.99mi |
| 3760 Inverrary Dr Lauderhill, FL | 2.0 | 1.0–2.0 | 800 | $1,725 | $2.16 | 5d | 3 | 1.01mi |
| 4160 NW 21st St Lauderhill, FL | 1.0–2.0 | 1.0 | 810 | $1,675 | $2.07 | 24d | 3 | 1.02mi |
| 4160 NW 21st St Lauderhill, FL | 1.0–2.0 | 1.0 | 810 | $1,599 | $1.97 | 7d | 2 | 1.02mi |
| 3760 Inverrary Dr Unit 3M Lauderhill, FL | — | 1.0 | 450 | $1,800 | $4.00 | 24d | 1 | 1.03mi |
| 3670 Inverrary Dr Lauderhill, FL | 1.0 | 1.0–1.5 | 650 | $1,600 | $2.46 | 7d | 3 | 1.03mi |
| 3670 Inverrary Dr Lauderhill, FL | 1.0 | 1.0–1.5 | 650 | $1,450 | $2.23 | 14d | 2 | 1.03mi |
HOA detail condo
- Monthly dues
- $481 · $5,772/yr
- Likely covers
- watercablepool
- Assessments
- None detected in remarks — confirm with the listing agent.
Listing history 11 events
-
2026-05-13status Pending
-
2026-04-21price $59,900
-
2026-03-19price $65,000
-
2025-11-15$70,900 Active
-
2018-09-28soldstatus $41,000
-
2017-11-10historical
-
2017-05-13$44,000 Active
-
2005-05-16soldstatus $52,000
-
1998-09-29soldstatus $10,000
-
1998-09-29soldstatus $10,000
-
1994-08-19soldstatus $20,000
ⓘ Source: listings_history table (triggers on properties + properties_extension) + one-shot
backfill from property_details.listing_events for pre-trigger history.
Tax reassessment forecast FL · Resets to sale price
- Current annual tax
- $2,044 · $170/mo
- Projected year-2 tax
- $2,044 · $170/mo
- Expected delta
- $0/yr ($0/mo · 0.0%)
ⓘ Screening estimate from a state-policy table — verify with the county assessor before closing.
Nearby sold comps map
Loading sold comps map…
Walkable amenities ~0.75 mi
Loading nearby amenities…
Taxation est. · year 1
- Rental income
- $18,356
- − Mortgage interest
- −$3,355
- − Property taxes
- −$2,044
- − Insurance
- −$300
- − Repairs & maintenance
- −$1,469
- − Management
- −$1,469
- − HOA
- −$5,772
- − Depreciation
- −$1,743
- Taxable income
- $2,206
- Est. tax owed @ 24.0%
- −$529
- After-tax cash flow
- $2,087/yr
For passive investors: Depreciation is non-cash, so a rental often shows a tax loss while cash-flowing — sheltering income. Rental losses are passive: they offset passive income freely, and up to $25,000/yr can offset ordinary (W-2) income if you actively participate and your MAGI is under $100k (phasing out to $0 by $150k); unused losses carry forward. On sale, claimed depreciation is recaptured at up to 25%, and gains may owe capital-gains tax (a 1031 exchange can defer both). Figures are a year-1 estimate at your 24.0% rate — not tax advice; consult a CPA.
Schools (NCES district)
- District
- Broward
- NCES district ID
- 1200180
- Math proficiency
- 42% ▼ -18.00%
- Reading proficiency
- 53% ▼ -5.00%
- Median HH income
- $52,139
- Composite
- 40.88/100
- National rank
- #3621
- State rank
- #46 of 73 in FL
Livability — Lauderdale Lakes
- Score
- 81/100
- State rank
- #100
- US rank
- #1527
Category grades
Schools grade is shown separately in the Schools card above.
Census & demographics
- Census place
- Lauderdale Lakes, FL
- County
- Broward County · 1,963,430 people
- Metro
- Miami-Fort Lauderdale-Pompano Beach, FL
- Population (ZIP)
- 62,807
- Household income
- $46,305
- Rent vs Own
- Severe rent burden
- 5692.0
Population outlook (Broward County) Hauer SSP2
- Today (2025)
- 2,207,033 people
- By 2030
- 2,360,704 · +7.0%
- By 2040
- 2,661,208 · +20.6%
- By 2050
- 2,946,698 · +33.5%
- By 2075
- 3,602,273 · +63.2%
- By 2100
- 3,970,984 · +79.9%
Race, ethnicity, and origin ACS 2023
- Neighborhood character
- Predominantly Black (77%)
- Race & ethnicity
- Black 77% Hispanic / Latino 12% Two or more races 8% White 7% Asian 2%
- Hispanic origin (detail)
- Puerto Rican 2% Cuban 3% Dominican 1%
- Common ancestry
- Hispanic 20%
- Foreign-born
- 39% · Canada, Jamaica, Dominican Republic
- Languages at home
- 66% English-only · French/Haitian/Cajun 22% Spanish 10%
Political lean MEDSL · Broward
- 2024 margin
- D (+17.0) · D 58.0% · R 41.0%
- 2008→2024 swing
- -17.8pp toward R · 2008: 34.7pp · 2024: 17.0pp
- All cycles
- 2024: D+17.0 2020: D+29.8 2016: D+35.0 2012: D+34.9 2008: D+34.7
Not yet ingested
- Civics
- —
Market trends
- HPI YoY
- ▼ -338.15%
- Current HPI
- 288.9345
- Rent YoY
- ▲ 0.26%
- Metro
- Miami-Fort Lauderdale-Pompano Beach, FL
- State GDP YoY
- ▲ 3.28%
- F500 in state
- 36
Industry mix (Fortune 500 HQ in FL)
| Industry | F500 HQs | Revenue |
|---|---|---|
| Industrial Technology | 2 | $29B |
|
||
| Insurance | 2 | $17B |
|
||
| Retail | 1 | $60B |
|
||
| Technology Distribution | 1 | $58B |
|
||
| Homebuilding | 1 | $35B |
|
||
| Technology Manufacturing | 1 | $35B |
|
||
Price history
+199.5% since first listed11 events — show timeline
- 2026-05-13 Pending — Beaches MLS
- 2026-04-21 Price Changed $59,900 Beaches MLS
- 2026-03-19 Price Changed $65,000 Beaches MLS
- 2025-11-15 Listed $70,900 Beaches MLS
- 2018-09-28 Sold (Public Records) $41,000 Public Records
- 2017-11-10 Listing Removed — MARMLS
- 2017-05-13 Listed $44,000 MARMLS
- 2005-05-16 Sold (Public Records) $52,000 Public Records
- 1998-09-29 Sold (Public Records) $10,000 Public Records
- 1998-09-29 Sold (Public Records) $10,000 Public Records
- 1994-08-19 Sold (Public Records) $20,000 Public Records
Property tax history
+7.1%/yrLatest (2025): $2,044 · +4.6% YoY. Source: county tax records.
Cash-flow waterfall
monthlySold comps — $/sqft
last 12 mo · ≤1 miLoading sold comps…