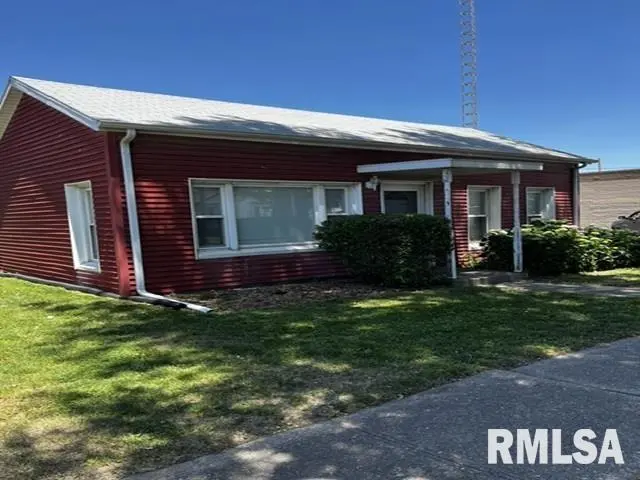
215 E Sangamon St · Petersburg, IL
Flood risk 3/10 · Minor
- FEMA flood zone
- X (unshaded)
- Chance of flooding over 30 yrs
- 0.1%
- Est. flood insurance / yr
- $507 – $1,088
Fire risk 1/10 · Minimal
- Est. fire insurance / yr
- $804 – $1,492
Heat risk 4/10 · Minor
- Hot days now (above 104°F)
- 7 days/yr
- Hot days in 30 yrs
- 20 days/yr
Wind risk 2/10 · Minimal
- Chance of severe wind over 30 yrs
- 1.0%
Air-quality risk 2/10 · Minimal
- Unhealthy air days now
- 1 days/yr
- Unhealthy air days in 30 yrs
- 2 days/yr
Risk factors via First Street. Map © Google.
Why this score? — see what drove the C+ grade
The composite is a weighted blend of 9 inputs, each scored 0–100. Each bar is that input's sub-score; the figure is the points it added to the 100-point composite (weight × sub-score).
- Cash flow +23.3/30.0
- ARV discount +15.0/15.0
- DSCR +7.5/10.0
- 1% rule +6.0/10.0
- Livability +3.4/5.0
- Rent growth +2.5/5.0
- Condition / age +2.5/5.0
- Schools +2.1/10.0
- Appreciation +0.0/10.0
$95,000
🖨 Deal sheet 📄 Offer letter ✓ Due diligence
Listing remarks MLS
Cute Bungalow With Lots Of Updating. Maintenance Free Exterior. Roof Redone In 1993. Thermopane Vinyl Windows Tilt In To Clean. Kitchen Cabinets, Disposal, Dishwasher & Stove New In 1987. Property Is Zoned Commercial. Enclosed Porch Off Kitchen For Washer
Key facts
- Heated garage
- Private patio
- Loads of storage
Tags
Property features AI
Exterior
- Parking: Attached, oversized garage with alley access (1 garage space)
- Utilities: Public water; Public sewer
- Home design: Single family residence; Not new construction
- Construction: Shingle roof; Crawl space/partial unfinished basement
- Exterior features: Shed(s); Replacement windows; Lean-to; Level lot; Paved road access
Interior
- Kitchen: Dishwasher; Microwave; Refrigerator; Vinyl flooring in kitchen
- Bedrooms: 2 bedrooms (both on the main level)
- Flooring: Hardwood in great room; Carpet in bedrooms and dining room; Vinyl in kitchen, laundry, and breezeway
- Bathrooms: 1 full bathroom
- Heating & cooling: Central air conditioning; Forced air heating; Gas water heater
- Interior features: Ceiling fan(s); Wood-burning stove in family room; One fireplace
- Laundry & utility: Washer and dryer; Main-level laundry room with vinyl flooring
Neighborhood map
What this means for you Summary
Snapshot
- This is a 2-bed/1.0-bath single-family listed at $95k.
Deal economics
- At list price, monthly cash flow is $173 ($2k/yr) — positive.
- The deal already cash-flows at list — no discount required.
- Meets the 1% rule at list price ($1k rent vs $95k).
Location & tenants
- Location reads 68/100 on livability (#451 in IL) — a middle-class / working-renter tenant base. Strengths: crime A+, cost of living A+, housing A+; Watch: amenities F, commute F, health & safety F.
- Porta CUSD 202 (town): math 16% / reading 29% proficiency, ranked #363 of 620 in IL (top 58%) — low school quality limits family demand, transient renter base, plan for 1-2y turnover.
- Zoned schools: Petersburg Elem School (345 students, 0% FRL) — zoned schools average 0% FRL vs 32% district-wide (32 pts lower); this property's tenant base skews higher-income than the district average.
- Market conditions: 39 active listings in the ZIP; 9 units permitted in Menard County in 2024 (0 in 5+ unit buildings).
Forward outlook
- Local home prices are declining (-3.0%/yr); year-one equity from $657 of loan paydown is wiped out by about $3k of value loss. Plan a longer hold.
- Menard County population projected at -17% by 2050 — secular population decline; favor cash flow + early exit over multi-decade hold.
Negotiation context
- Only 3 days on market — expect competitive offers; lowballing is unlikely to land.
- 2 sale attempts since 29y ago with the ask held roughly flat each time — persistent listings suggest the price (not the market) is what's stuck; bring a comps-based counter.
- Current owner paid $46k; list at $95k implies a 107% gain — meaningful room to come down on a strong offer.
Risks & watch-outs
- Watch-outs: built in 1920 — expect roof / HVAC / electrical / plumbing capex.
Questions for the listing agent
- Built in 1920 — when were the roof, HVAC, electrical panel, plumbing, and water heater last replaced?
- Is there a deadline driving the sale (1031 exchange, divorce, estate, relocation)? That informs how much negotiation room exists.
- Schools are F-rated, which usually means shorter tenancies and higher turnover. Who's the typical renter profile here, and what's been the actual vacancy rate?
- What's the average days-on-market for RENTAL listings here right now (not sales)? A rising rental-DOM trend means longer vacancies and softer asking-rent achievability than the comps imply.
- What's the recent tenant-quality profile in this submarket — average credit score on applications, eviction rate, late-payment / NSF rate, and stable-employment percentage? A property-management company in the area should have these aggregated.
- How much new for-sale + rental construction is in the pipeline within 1–3 miles? Heavy new supply typically softens prices + rents 12–24 months out; constrained supply supports both.
Investment metrics
- 1% rule
- 1.10% ✓
- Cap rate
- 8.48%
- Cash-on-cash
- 7.83%
- DSCR
- 1.35
- GRM
- 7.6
CMA / ARV
- ARV (on-the-fly)
- $131,440
- Comps found
- 12
Show comp detail 12 sales within ~0.75 mi
| Address | Dist | Beds/Ba | Sqft | Sold | Price | $/sf | Match |
|---|---|---|---|---|---|---|---|
| 321 N 5th St | 0.04mi | 2/1.0 | 1,253 (+1%) | 10mo | $105,000 | $84 | 88 |
| 214 E Taylor St | 0.03mi | 2/1.0 | 1,153 (-7%) | 3mo | $87,500 | $76 | 84 |
| 605 N 6th St | 0.19mi | 2/1.0 | 1,100 (-11%) | 9mo | $98,500 | $90 | 64 |
| 420 W Monroe St | 0.43mi | 2/1.0 | 1,183 (-5%) | 13mo | $94,000 | $79 | 61 |
| 224 W Rutledge St | 0.24mi | 3/1.0 (+1) | 1,100 (-11%) | 9mo | $139,900 | $127 | 57 |
| 554 W Monroe St | 0.54mi | 2/1.0 | 1,166 (-6%) | 10mo | $98,000 | $84 | 57 |
| 503 N 7th St | 0.17mi | 3/2.0 (+1) | 1,400 (+13%) | 7mo | $163,500 | $117 | 56 |
| 416 S 12th St | 0.59mi | 2/1.0 | 1,096 (-12%) | 2mo | $119,900 | $109 | 52 |
| 930 N 5th | 0.39mi | 3/2.5 (+1) | 1,360 (+10%) | 7mo | $125,000 | $92 | 48 |
| 303 W Lincoln Ave | 0.49mi | 2/2.0 | 1,418 (+14%) | 1mo | $150,000 | $106 | 48 |
| 911 W Monroe St | 0.75mi | 2/1.0 | 1,100 (-11%) | 1mo | $160,000 | $145 | 45 |
| 17544 Bobwhite St | 0.75mi | 3/1.0 (+1) | 1,176 (-5%) | 12mo | $140,000 | $119 | 42 |
Match score weights: distance 35% · size 25% · config 20% · recency 20%. Top-matched comps best support the ARV.
Projected returns pro-forma
-3.0% appreciation · 3.0% rent growth · sell at horizon
- IRR
- -4.4%
- Equity multiple
- 0.84×
- Total profit
- $-4,330
- Equity at exit
- $14,165
- IRR
- 5.3%
- Equity multiple
- 1.40×
- Total profit
- $10,516
- Equity at exit
- $8,214
Cash invested: $26,600 (down + closing). Projections, not guarantees.
Landlord ↔ Tenant lean methodology
- Overall (STATE)
- 43 Moderately Tenant-Leaning
- State Illinois
- 43 Moderately Tenant-Leaning · D+7
- County
- — inherits STATE
- City
- — inherits STATE
ZIP-level market 62675
- Home prices YoY
- -29.6%
- Active inventory
- 39
- Price-to-rent
- 7.6×
Monthly cashflow live
- Estimated rent
- $1,048 medium interval (Pro) →
- Mortgage (P&I)
- −$498
- Tax from tax record
- −$117 /mo · $1,402/yr
- Insurance
- −$40
- HOA
- −$0
- Vacancy / Maint / Mgmt
- −$220
- Net cashflow
- $173
Break-even live
UW: 25.0% down · 7.5% · 30yr · 1.5% tax · 5.0% vac · 8.0% maint · 8.0% mgmt
Financing live
Cash to close
- Down payment
- $23,750
- Closing costs
- $2,850
- Reserves months
- —
- Total cash needed
- —
Loan-product check · same deal, 3 products live
Conventional
25% down · 7.5% · 30yr
- Down + closing
- —
- Monthly P&I
- —
- Monthly cashflow
- —
- DSCR
- —
- Eligible?
- —
Personal DTI + credit; lowest rate.
DSCR
20% down · 8.5% · 30yr
- Down + closing
- —
- Monthly P&I
- —
- Monthly cashflow
- —
- DSCR
- —
- Eligible?
- —
No personal income docs; deal must DSCR.
Hard money
10% down · 12.0% · 12mo
- Down + closing
- —
- Monthly P&I
- —
- Monthly cashflow
- —
- DSCR
- —
- Eligible?
- —
Short-term bridge; refi at stabilization.
Listing history 3 events
-
2026-06-12statusdays on market $95,000 Pending 3 DOM
-
2026-06-09remarks 533-char remark
-
2026-06-09$95,000 Active 1 DOM
ⓘ Source: listings_history table (triggers on properties + properties_extension) + one-shot
backfill from property_details.listing_events for pre-trigger history.
Tax reassessment forecast IL · Partial reset (capped growth)
- Current annual tax
- $1,402 · $117/mo
- Projected year-2 tax
- $1,779 · $148/mo
- Expected delta
- +$377/yr (+$31/mo · 26.9%)
ⓘ Screening estimate from a state-policy table — verify with the county assessor before closing.
Climate risk First Street
- Flood 3/10 Moderate FEMA zone X (unshaded) · 10% chance over 30 yrs
- Wildfire 1/10 Low
- Heat 4/10 Moderate 7 d/yr ≥104°F today · 20 d/yr by 30 yrs out
- Wind 2/10 Low 100% chance of damaging wind over 30 yrs
- Air quality 2/10 Low 1 unhealthy d/yr today · 2 by 30 yrs out
Nearby sold comps map
Loading sold comps map…
Walkable amenities ~0.75 mi
Loading nearby amenities…
Taxation est. · year 1
- Rental income
- $12,579
- − Mortgage interest
- −$5,321
- − Property taxes
- −$1,402
- − Insurance
- −$475
- − Repairs & maintenance
- −$1,006
- − Management
- −$1,006
- − Depreciation
- −$2,764
- Taxable income
- $604
- Est. tax owed @ 24.0%
- −$145
- After-tax cash flow
- $1,937/yr
For passive investors: Depreciation is non-cash, so a rental often shows a tax loss while cash-flowing — sheltering income. Rental losses are passive: they offset passive income freely, and up to $25,000/yr can offset ordinary (W-2) income if you actively participate and your MAGI is under $100k (phasing out to $0 by $150k); unused losses carry forward. On sale, claimed depreciation is recaptured at up to 25%, and gains may owe capital-gains tax (a 1031 exchange can defer both). Figures are a year-1 estimate at your 24.0% rate — not tax advice; consult a CPA.
Schools (NCES district)
- District
- Porta CUSD 202
- NCES district ID
- 1731410
- Math proficiency
- 16% ▼ -9.00%
- Reading proficiency
- 29% ▼ -9.00%
- Median HH income
- $57,294
- Composite
- 20.63/100
- National rank
- #8544
- State rank
- #363 of 620 in IL
Livability — Petersburg
- Score
- 68/100
- State rank
- #451
- US rank
- #9281
Category grades
Schools grade is shown separately in the Schools card above.
Census & demographics
- Census place
- Petersburg, IL
- Population (ZIP)
- 5,981
Population outlook (Menard County) Hauer SSP2
- Today (2025)
- 11,894 people
- By 2030
- 11,493 · -3.4%
- By 2040
- 10,675 · -10.2%
- By 2050
- 9,861 · -17.1%
- By 2075
- 8,334 · -29.9%
- By 2100
- 6,799 · -42.8%
Race, ethnicity, and origin ACS 2023
- Neighborhood character
- Predominantly White (95%)
- Race & ethnicity
- White 95% Two or more races 5% Hispanic / Latino 1%
- Common ancestry
- Romanian 4% Lithuanian 2% Slovak 1%
- Foreign-born
- 1% · Canada
- Languages at home
- 97% English-only · Spanish 1% Chinese 1% French/Haitian/Cajun 1%
Political lean MEDSL · Menard
- 2024 margin
- Solid R (+41.5) · D 28.6% · R 70.0% · Other 1.4%
- 2008→2024 swing
- -26.6pp toward R · 2008: -14.9pp · 2024: -41.5pp
- All cycles
- 2024: R+41.5 2020: R+39.4 2016: R+37.7 2012: R+30.1 2008: R+14.9
Not yet ingested
- Civics
- —
Market trends
- HPI YoY
- ▼ -59.68%
- Current HPI
- 142.2551
- Rent YoY
- —
- Metro
- —
- State GDP YoY
- ▲ 1.59%
- F500 in state
- 60
Industry mix (Fortune 500 HQ in IL)
| Industry | F500 HQs | Revenue |
|---|---|---|
| Insurance | 4 | $201B |
|
||
| Consumer Goods | 4 | $87B |
|
||
| Industrial Machinery | 3 | $64B |
|
||
| Healthcare | 2 | $55B |
|
||
| Retail / Pharmacy | 1 | $148B |
|
||
| Agriculture / Food | 1 | $86B |
|
||
Price history
+90.4% since first listed3 events — show timeline
- 2026-06-08 Listed $95,000 RMLSA as Distributed by MLS Grid
- 1997-12-01 Sold (MLS) $46,000 RMLSA as Distributed by MLS Grid
- 1997-09-24 Listed $49,900 RMLSA as Distributed by MLS Grid
Property tax history
+0.5%/yrLatest (2024): $1,402 · +1.0% YoY. Source: county tax records.
Cash-flow waterfall
monthlySold comps — $/sqft
last 12 mo · ≤1 miLoading sold comps…