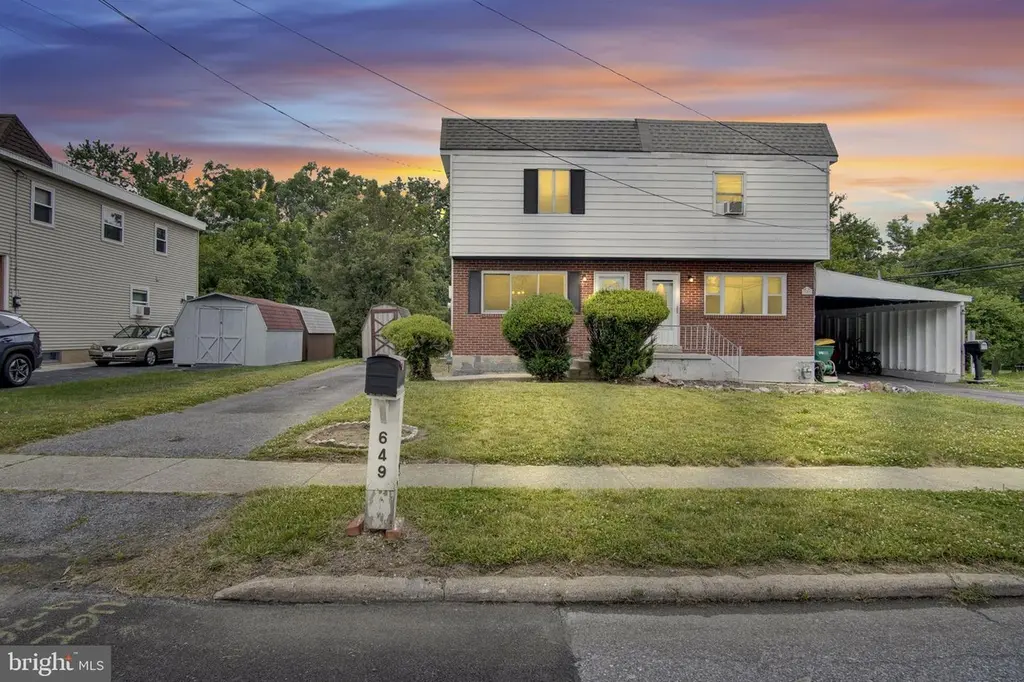
649 Erford Rd · East Pennsboro, PA
Flood risk 10/10 · Severe
- FEMA flood zone
- X (shaded)
- Chance of flooding over 30 yrs
- 0.99%
- Est. flood insurance / yr
- $507 – $1,088
Fire risk 1/10 · Minimal
- Est. fire insurance / yr
- $511 – $949
Heat risk 5/10 · Moderate
- Hot days now (above 101°F)
- 7 days/yr
- Hot days in 30 yrs
- 15 days/yr
Wind risk 3/10 · Minor
- Chance of severe wind over 30 yrs
- 5.0%
Air-quality risk 2/10 · Minimal
- Unhealthy air days now
- 1 days/yr
- Unhealthy air days in 30 yrs
- 3 days/yr
Risk factors via First Street. Map © Google.
Why this score? — see what drove the B- grade
The composite is a weighted blend of 9 inputs, each scored 0–100. Each bar is that input's sub-score; the figure is the points it added to the 100-point composite (weight × sub-score).
- Cash flow +24.9/30.0
- ARV discount +15.0/15.0
- DSCR +8.1/10.0
- 1% rule +6.5/10.0
- Rent growth +4.0/5.0
- Schools +3.8/10.0
- Livability +2.5/5.0
- Condition / age +2.5/5.0
- Appreciation +0.0/10.0
$149,900
🖨 Deal sheet 📄 Offer letter ✓ Due diligence
Listing remarks
Opportunity awaits in Ridley Park! This semi-detached home is the perfect equity builder, offering 3 bedrooms, 1.5 bathrooms, and a picturesque setting along the Conodoguinet Creek. Enjoy beautiful creek views, direct access to nearby green space, and a community park just steps away from this dreamy lot. Inside, you'll find hardwood flooring throughout the home, including beneath the existing carpet. The main level features replacement windows and exterior doors. The functional floor plan provides comfortable living spaces and generously sized bedrooms upstairs. A full basement offers excellent storage and includes the laundry area. Additional highlights include driveway parking, efficient
Key facts
- Hardwood flooring
- Creek views
- Community park
Tags
Property features AI
Exterior
- Parking: Asphalt driveway; Driveway parking (2 spaces); Total of 2 garage/parking spaces
- Utilities: Public water; Public sewer; 200+ amp electrical service with circuit breakers; Natural gas hot water
- Home design: Semi-detached; Vinyl siding with brick front; Shingle and rubber roof; Built year per assessor (not specified exact year); Entry level information not specified; Facing direction not specified
- Construction: Block foundation; Replacement, wood frame and vinyl-clad windows
- Exterior features: Play area; Sidewalks; Backs to open common area; Cleared and open lot; Sloping terrain; Stream/creek on property; Has a water view; Shed
Interior
- Kitchen: Kitchen (appliances not specified)
- Bedrooms: Three bedrooms on the upper level (1st upper level)
- Flooring: Hardwood; Vinyl
- Bathrooms: One full bathroom (upper level); One half bathroom (main level)
- Heating & cooling: Forced air heating (natural gas); Window air conditioning units (electric)
- Interior features: Tub with shower; Dining area; Family room off the kitchen; Traditional floor plan; Wood floors; Drywall walls and ceilings; Interior access to basement; Unfinished basement
- Laundry & utility: Washer/dryer hookup in basement
Neighborhood map
What this means for you Summary
Snapshot
- This is a 3-bed/1.5-bath townhouse listed at $150k.
Deal economics
- At list price, monthly cash flow is $256 ($3k/yr) — positive.
- The deal already cash-flows at list — no discount required.
- Meets the 1% rule at list price ($2k rent vs $150k).
Location & tenants
- Location reads: area grade B — affects rentability + tenant quality, not the cash-flow math above.
- East Pennsboro Area SD (suburban): math 30% / reading 57% proficiency, ranked #275 of 539 in PA (top 51%) — families likely to look elsewhere, expect single-tenant / working-renter base with shorter leases.
- Zoned schools: East Pennsboro Area Shs (math 82% / reading 72%, grade A-, #22 of 437 statewide, top 5%, 761 students, 36% FRL).
- Zoned-school proficiency averages 77% at this address vs 44% district-wide (+34 pts) — the actual schools serving this property are materially stronger than the East Pennsboro Area SD average implies; a family-tenant draw the district grade alone would hide.
- Market conditions: Rents rising fast (+6.1%/yr); 148 active listings in the ZIP; 8 comparable units currently listed for rent nearby; rentals at typical pace (median 24d on market — plan ~3-4 weeks tenant-placement turnaround); solid renter incomes; 1,052 units permitted in Cumberland County in 2024 (310 in 5+ unit buildings).
Forward outlook
- Local home prices are declining (-3.0%/yr); year-one equity from $1k of loan paydown is wiped out by about $4k of value loss. Plan a longer hold.
- Cumberland County population projected at +17% by 2050 — long-run rental-demand tailwind backs the buy-and-hold thesis.
- At projected returns (-3.0% appreciation + 6.1% rent growth), your $42k cash investment doubles in ~9 years — after that, you're playing with house money.
Negotiation context
- Only 1 days on market — expect competitive offers; lowballing is unlikely to land.
Risks & watch-outs
- Watch-outs: flood insurance adds $66/mo.
- Climate carrying-cost: severe flood risk; extreme-heat days projected 7→15/yr by 2055 (HVAC capex compounding) — expect insurance premiums to compound above CPI over the hold.
Questions for the listing agent
- Built in 1969 — when were the roof, HVAC, electrical panel, plumbing, and water heater last replaced?
- What's the actual annual flood-insurance premium (NFIP or private), and is the property in a SFHA with mandatory coverage?
- Is there a deadline driving the sale (1031 exchange, divorce, estate, relocation)? That informs how much negotiation room exists.
- What's the average days-on-market for RENTAL listings here right now (not sales)? A rising rental-DOM trend means longer vacancies and softer asking-rent achievability than the comps imply.
- What's the recent tenant-quality profile in this submarket — average credit score on applications, eviction rate, late-payment / NSF rate, and stable-employment percentage? A property-management company in the area should have these aggregated.
- How much new for-sale + rental construction is in the pipeline within 1–3 miles? Heavy new supply typically softens prices + rents 12–24 months out; constrained supply supports both.
Investment metrics
- 1% rule
- 1.15% ✓
- Cap rate
- 8.88%
- Cash-on-cash
- 9.22%
- DSCR
- 1.41
- GRM
- 7.2
CMA / ARV
- ARV (on-the-fly)
- $189,720
- Comps found
- 12
Show comp detail 12 sales within ~0.75 mi
| Address | Dist | Beds/Ba | Sqft | Sold | Price | $/sf | Match |
|---|---|---|---|---|---|---|---|
| 14 W Glenwood Dr Unit B | 0.14mi | 3/1.5 | 1,224 (0%) | 2mo | $220,000 | $180 | 92 |
| 606 Erford Rd | 0.17mi | 3/2.0 | 1,224 (0%) | 3mo | $189,000 | $154 | 88 |
| 18-B W Glenwood Dr | 0.16mi | 3/1.5 | 1,224 (0%) | 7mo | $205,000 | $167 | 86 |
| 604 Erford Rd | 0.17mi | 3/1.5 | 1,224 (0%) | 9mo | $184,900 | $151 | 85 |
| 603 Erford Rd | 0.21mi | 3/1.5 | 1,224 (0%) | 8mo | $189,900 | $155 | 84 |
| 830 Erford Rd | 0.38mi | 3/1.5 | 1,224 (0%) | 9mo | $210,000 | $172 | 75 |
| 831 Erford Rd | 0.40mi | 3/1.5 | 1,224 (0%) | 10mo | $215,000 | $176 | 73 |
| 315 S Enola Dr | 0.41mi | 3/1.0 | 1,184 (-3%) | 0mo | $160,000 | $135 | 73 |
| 235 S Enola Dr | 0.48mi | 3/1.0 | 1,244 (+2%) | 1mo | $160,000 | $129 | 72 |
| 1123 2nd St | 0.55mi | 3/1.0 | 1,258 (+3%) | 6mo | $160,000 | $127 | 62 |
| 211 S Enola Dr | 0.58mi | 3/1.0 | 1,338 (+9%) | 2mo | $160,000 | $120 | 54 |
| 165 S Enola Dr | 0.65mi | 3/1.0 | 1,356 (+11%) | 9mo | $225,000 | $166 | 42 |
Match score weights: distance 35% · size 25% · config 20% · recency 20%. Top-matched comps best support the ARV.
Projected returns pro-forma
-3.0% appreciation · 6.14% rent growth · sell at horizon
- IRR
- -1.4%
- Equity multiple
- 0.95×
- Total profit
- $-2,287
- Equity at exit
- $22,351
- IRR
- 11.6%
- Equity multiple
- 2.05×
- Total profit
- $43,907
- Equity at exit
- $12,961
Cash invested: $41,972 (down + closing). Projections, not guarantees.
Landlord ↔ Tenant lean methodology
- Overall (STATE)
- 62 Landlord-Friendly
- State Pennsylvania
- 62 Landlord-Friendly · EVEN
- County
- — inherits STATE
- City
- — inherits STATE
ZIP-level market 17011
- Rents YoY
- 6.1%
- Active inventory
- 148
- Price-to-rent
- 7.2×
Monthly cashflow live
- Estimated rent
- $1,726 high interval (Pro) →
- Mortgage (P&I)
- −$786
- Tax from tax record
- −$192 /mo · $2,305/yr
- Insurance
- −$62
- Flood insurance flood zone
- −$66 /mo · $798/yr
- HOA
- −$0
- Vacancy / Maint / Mgmt
- −$362
- Net cashflow
- $256
Break-even live
UW: 25.0% down · 7.5% · 30yr · 1.5% tax · 5.0% vac · 8.0% maint · 8.0% mgmt
Financing live
Cash to close
- Down payment
- $37,475
- Closing costs
- $4,497
- Reserves months
- —
- Total cash needed
- —
Loan-product check · same deal, 3 products live
Conventional
25% down · 7.5% · 30yr
- Down + closing
- —
- Monthly P&I
- —
- Monthly cashflow
- —
- DSCR
- —
- Eligible?
- —
Personal DTI + credit; lowest rate.
DSCR
20% down · 8.5% · 30yr
- Down + closing
- —
- Monthly P&I
- —
- Monthly cashflow
- —
- DSCR
- —
- Eligible?
- —
No personal income docs; deal must DSCR.
Hard money
10% down · 12.0% · 12mo
- Down + closing
- —
- Monthly P&I
- —
- Monthly cashflow
- —
- DSCR
- —
- Eligible?
- —
Short-term bridge; refi at stabilization.
Rent comps 8 comps
| Address | Beds | Baths | Sqft | Rent | $/sqft | DOM | Units | Dist |
|---|---|---|---|---|---|---|---|---|
| 7 Adams St Unit 08 Enola, PA | 2.0 | 1.0 | 700 | $1,300 | $1.86 | 23d | 1 | 0.42mi |
| 400 W Crestwood Dr Camp Hill, PA | 1.0–3.0 | 1.0–2.0 | 1042 | $2,071 | $1.99 | 14d | 14 | 0.79mi |
| 150 Erford Rd Camp Hill, PA | 1.0–2.0 | 1.5–2.0 | 879 | $1,680 | $1.91 | 14d | 38 | 1.03mi |
| 3 Silk Mill Dr East Pennsboro Township, PA | 2.0 | 1.0–2.0 | 1319 | $1,822 | $1.38 | 14d | 8 | 1.16mi |
| 616 N Front St Lemoyne, PA | 3.0 | 1.0 | 1408 | $1,650 | $1.17 | 44d | 1 | 1.36mi |
| 20 House Ave Camp Hill, PA | 2.0 | 2.0 | 1243 | $1,720 | $1.38 | 14d | 2 | 1.40mi |
| 2301 N 2nd St Harrisburg, PA | 2.0 | 1.5 | 1325 | $1,595 | $1.20 | 44d | 1 | 1.44mi |
| 508 N 2nd St Wormleysburg, PA | 2.0 | 1.0 | 887 | $1,395 | $1.57 | 44d | 1 | 1.48mi |
Listing history 7 events
-
2026-06-18statusdays on market $149,900 Active 1 DOM
-
2026-06-17days on market $149,900 Coming Soon 6 DOM
-
2026-06-16days on market $149,900 Coming Soon 5 DOM
-
2026-06-15days on market $149,900 Coming Soon 4 DOM
-
2026-06-14days on market $149,900 Coming Soon 2 DOM
-
2026-06-13remarks 699-char remark
-
2026-06-13$149,900 Coming Soon 1 DOM
ⓘ Source: listings_history table (triggers on properties + properties_extension) + one-shot
backfill from property_details.listing_events for pre-trigger history.
Tax reassessment forecast PA · Partial reset (capped growth)
- Current annual tax
- $2,305 · $192/mo
- Projected year-2 tax
- $2,337 · $195/mo
- Expected delta
- +$32/yr (+$3/mo · 1.4%)
ⓘ Screening estimate from a state-policy table — verify with the county assessor before closing.
Climate risk First Street
- Flood 10/10 Extreme FEMA zone X (shaded) · 99% chance over 30 yrs
- Wildfire 1/10 Low
- Heat 5/10 Major 7 d/yr ≥101°F today · 15 d/yr by 30 yrs out
- Wind 3/10 Moderate 5% chance of damaging wind over 30 yrs
- Air quality 2/10 Low 1 unhealthy d/yr today · 3 by 30 yrs out
Nearby sold comps map
Loading sold comps map…
Walkable amenities ~0.75 mi
Loading nearby amenities…
Taxation est. · year 1
- Rental income
- $20,707
- − Mortgage interest
- −$8,397
- − Property taxes
- −$2,305
- − Insurance
- −$1,547
- − Repairs & maintenance
- −$1,657
- − Management
- −$1,657
- − Depreciation
- −$4,361
- Taxable income
- $784
- Est. tax owed @ 24.0%
- −$188
- After-tax cash flow
- $2,885/yr
For passive investors: Depreciation is non-cash, so a rental often shows a tax loss while cash-flowing — sheltering income. Rental losses are passive: they offset passive income freely, and up to $25,000/yr can offset ordinary (W-2) income if you actively participate and your MAGI is under $100k (phasing out to $0 by $150k); unused losses carry forward. On sale, claimed depreciation is recaptured at up to 25%, and gains may owe capital-gains tax (a 1031 exchange can defer both). Figures are a year-1 estimate at your 24.0% rate — not tax advice; consult a CPA.
Schools (NCES district)
- District
- East Pennsboro Area SD
- NCES district ID
- 4208580
- Math proficiency
- 30% ▼ -16.00%
- Reading proficiency
- 57% ▼ -8.00%
- Median HH income
- $60,120
- Composite
- 38.26/100
- National rank
- #4239
- State rank
- #275 of 539 in PA
Livability — East Pennsboro
No livability data for this city. (Only ~50 U.S. cities are tracked.)
Census & demographics
- County
- Cumberland County · 257,673 people
- Metro
- Harrisburg-Carlisle, PA
- Population (ZIP)
- 39,664
- Household income
- $92,556
- Rent vs Own
- Severe rent burden
- 858.0
Population outlook (Cumberland County) Hauer SSP2
- Today (2025)
- 267,950 people
- By 2030
- 278,105 · +3.8%
- By 2040
- 296,552 · +10.7%
- By 2050
- 312,937 · +16.8%
- By 2075
- 349,233 · +30.3%
- By 2100
- 361,875 · +35.1%
Race, ethnicity, and origin ACS 2023
- Neighborhood character
- Predominantly White (74%)
- Race & ethnicity
- White 74% Black 8% Hispanic / Latino 7% Two or more races 6% Asian 6%
- Hispanic origin (detail)
- Mexican 2% Puerto Rican 2%
- Common ancestry
- Italian 3% Romanian 3% Lithuanian 3%
- Foreign-born
- 9% · Canada, Vietnam, China
- Languages at home
- 88% English-only · Spanish 4% Other Asian/Pacific 2% Other Indo-European 1%
Political lean MEDSL · Cumberland
- 2024 margin
- Lean R (+9.4) · D 44.6% · R 54.1% · Other 1.3%
- 2008→2024 swing
- +4.2pp toward D · 2008: -13.6pp · 2024: -9.4pp
- All cycles
- 2024: R+9.4 2020: R+10.6 2016: R+18.6 2012: R+18.5 2008: R+13.6
Not yet ingested
- Civics
- —
Market trends
- HPI YoY
- ▼ -232.65%
- Current HPI
- 254.4755
- Rent YoY
- ▲ 6.14%
- Metro
- Harrisburg-Carlisle, PA
- State GDP YoY
- ▲ 1.68%
- F500 in state
- 34
Industry mix (Fortune 500 HQ in PA)
| Industry | F500 HQs | Revenue |
|---|---|---|
| Healthcare | 2 | $309B |
|
||
| Insurance | 2 | $27B |
|
||
| Telecommunications / Media | 1 | $124B |
|
||
| Industrial Distribution | 1 | $22B |
|
||
| Financial Services | 1 | $20B |
|
||
| Chemicals / Materials | 1 | $18B |
|
||
Price history
1 event — show timeline
- 2026-06-11 Coming Soon $149,900 BRIGHT MLS
Property tax history
+3.4%/yrLatest (2026): $2,305 · +1.8% YoY. Source: county tax records.
Cash-flow waterfall
monthlySold comps — $/sqft
last 12 mo · ≤1 miLoading sold comps…