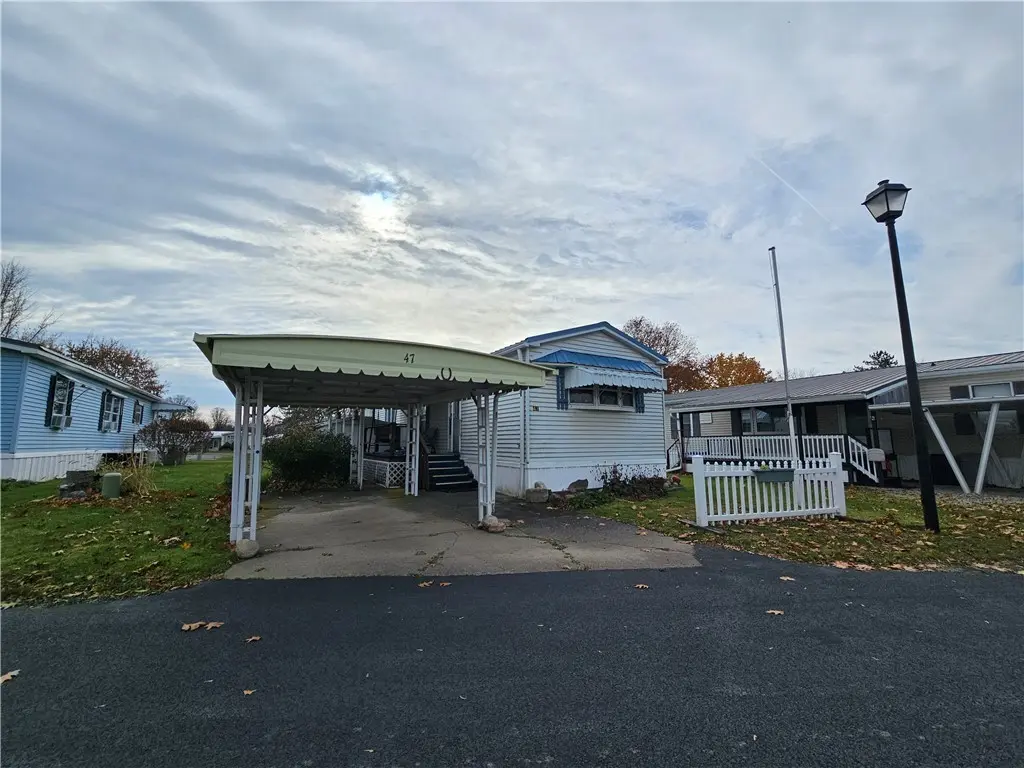
47 Cedar · Hornell, NY
Flood risk 1/10 · Minimal
- FEMA flood zone
- X (shaded)
- Chance of flooding over 30 yrs
- 0.0%
- Est. flood insurance / yr
- $473 – $860
Fire risk 2/10 · Minimal
- Est. fire insurance / yr
- $691 – $1,283
Heat risk 3/10 · Minor
- Hot days now (above 91°F)
- 8 days/yr
- Hot days in 30 yrs
- 18 days/yr
Wind risk 1/10 · Minimal
- Chance of severe wind over 30 yrs
- —
Air-quality risk 1/10 · Minimal
- Unhealthy air days now
- 0 days/yr
- Unhealthy air days in 30 yrs
- 0 days/yr
Risk factors via First Street. Map © Google.
Why this score? — see what drove the B+ grade
The composite is a weighted blend of 9 inputs, each scored 0–100. Each bar is that input's sub-score; the figure is the points it added to the 100-point composite (weight × sub-score).
- Cash flow +30.0/30.0
- 1% rule +10.0/10.0
- DSCR +10.0/10.0
- ARV discount +7.5/15.0
- Appreciation +7.0/10.0
- Livability +3.5/5.0
- Schools +3.4/10.0
- Rent growth +2.5/5.0
- Condition / age +2.2/5.0
$34,900
🖨 Deal sheet 📄 Offer letter ✓ Due diligence
Listing remarks MLS
This well-maintained single-wide home in the desirable 55+ Woodlands Community offers comfortable, low-maintenance living just minutes from the City of Hornell and all the amenities the area provides. Inside, you’ll find an inviting open-concept kitchen and living room combo, creating a bright and functional main living space. The home features 2 bedrooms and 1 full bathroom, making it an ideal fit for downsizing or simplified living. Enjoy additional convenience with a covered porch, perfect for relaxing outdoors, along with a carport for sheltered parking and an on-site storage shed for tools or seasonal items. This peaceful, community-oriented setting provides easy access to shopping, dining, medical services, and more—an excellent opportunity for affordable living in a prime location.
Key facts
- Covered porch
- Open-concept kitchen
- On-site storage shed
Tags
Neighborhood map
What this means for you Summary
Snapshot
- This is a 2-bed/1.0-bath manufactured listed at $35k. Condition is rated fair.
Deal economics
- At list price, monthly cash flow is $699 ($8k/yr) — positive.
- The deal already cash-flows at list — no discount required.
- Meets the 1% rule at list price ($1k rent vs $35k).
- Recommended offer: $31k (12.0% below list) — sets the bar for market timing.
- Cap rate 30.3% vs local median 13.3% in Hornell — top-decile yield for the area; either an underpriced asset or a hidden risk that comps aren't pricing in. Stress-test before assuming the spread holds.
Location & tenants
- Location reads 70/100 on livability (#451 in NY) — a middle-class / working-renter tenant base. Strengths: cost of living A+, housing A+, health & safety A+; Watch: amenities C-, schools D, crime F.
- Hornell City School District (town): math 33% / reading 49% proficiency, ranked #519 of 590 in NY (top 88%) — families likely to look elsewhere, expect single-tenant / working-renter base with shorter leases.
- Market conditions: 59 active listings in the ZIP; 196 units permitted in Steuben County in 2024 (0 in 5+ unit buildings).
Forward outlook
- In year one you build about $2k of equity ($241 loan paydown + $1k appreciation (4.0% local appreciation)).
- Steuben County population projected at -20% by 2050 — secular population decline; favor cash flow + early exit over multi-decade hold.
- At projected returns (4.0% appreciation + 3.0% rent growth), your $10k cash investment doubles in ~1 year — after that, you're playing with house money.
Negotiation context
- It's been on market 212 days — a 12% lower offer ($31k) is reasonable based on typical stale-listing flexibility.
Questions for the listing agent
- It's been on market 212 days. Have you received any prior offers? Is the seller open to a 12% concession, seller financing, or rate buy-down credit?
- Have any recent inspections been done? Can we get a copy of the seller's disclosures and any deferred-maintenance estimates?
- Why hasn't it sold? Are there any deal-killer items the seller is aware of (foundation, flood, title, zoning, code violations)?
- Is there a deadline driving the sale (1031 exchange, divorce, estate, relocation)? That informs how much negotiation room exists.
- Schools are D-rated, which usually means shorter tenancies and higher turnover. Who's the typical renter profile here, and what's been the actual vacancy rate?
- Crime grade is F in this area — have there been break-ins, vandalism, or insurance claims at this property in the last 3 years? What carrier currently insures it and at what premium?
- What's the average days-on-market for RENTAL listings here right now (not sales)? A rising rental-DOM trend means longer vacancies and softer asking-rent achievability than the comps imply.
- What's the recent tenant-quality profile in this submarket — average credit score on applications, eviction rate, late-payment / NSF rate, and stable-employment percentage? A property-management company in the area should have these aggregated.
- How much new for-sale + rental construction is in the pipeline within 1–3 miles? Heavy new supply typically softens prices + rents 12–24 months out; constrained supply supports both.
Investment metrics
- 1% rule
- 3.41% ✓
- Cap rate
- 30.32%
- Cash-on-cash
- 85.82%
- DSCR
- 4.82
- GRM
- 2.4
CMA / ARV
- ARV (median comp)
- $995
- List price
- $34,900
- Delta
- 3407.54%
- Verdict
- OVERPRICED
- Comps
- 2 within 2.0 mi
Projected returns pro-forma
3.95% appreciation · 3.0% rent growth · sell at horizon
- IRR
- 90.8%
- Equity multiple
- 6.17×
- Total profit
- $50,513
- Equity at exit
- $17,588
- IRR
- 89.8%
- Equity multiple
- 12.81×
- Total profit
- $115,360
- Equity at exit
- $28,683
Cash invested: $9,772 (down + closing). Projections, not guarantees.
Landlord ↔ Tenant lean methodology
- Overall (STATE)
- 15 Strongly Tenant-Friendly
- State New York
- 15 Strongly Tenant-Friendly · D+10
- County
- — inherits STATE
- City
- — inherits STATE
ZIP-level market 14843
- Home prices YoY
- 1.9%
- Active inventory
- 59
- Price-to-rent
- 2.4×
Monthly cashflow live
- Estimated rent
- $1,190 medium interval (Pro) →
- Mortgage (P&I)
- −$183
- Tax est. 1.5%
- −$44 /mo · $524/yr
- Insurance
- −$15
- HOA
- −$0
- Vacancy / Maint / Mgmt
- −$250
- Net cashflow
- $699
Break-even live
UW: 25.0% down · 7.5% · 30yr · 1.5% tax · 5.0% vac · 8.0% maint · 8.0% mgmt
Financing live
Cash to close
- Down payment
- $8,725
- Closing costs
- $1,047
- Reserves months
- —
- Total cash needed
- —
Loan-product check · same deal, 3 products live
Conventional
25% down · 7.5% · 30yr
- Down + closing
- —
- Monthly P&I
- —
- Monthly cashflow
- —
- DSCR
- —
- Eligible?
- —
Personal DTI + credit; lowest rate.
DSCR
20% down · 8.5% · 30yr
- Down + closing
- —
- Monthly P&I
- —
- Monthly cashflow
- —
- DSCR
- —
- Eligible?
- —
No personal income docs; deal must DSCR.
Hard money
10% down · 12.0% · 12mo
- Down + closing
- —
- Monthly P&I
- —
- Monthly cashflow
- —
- DSCR
- —
- Eligible?
- —
Short-term bridge; refi at stabilization.
Listing history 17 events
-
2026-06-19days on market $34,900 Active 212 DOM
-
2026-06-18days on market $34,900 Active 211 DOM
-
2026-06-17days on market $34,900 Active 210 DOM
-
2026-06-16days on market $34,900 Active 209 DOM
-
2026-06-15days on market $34,900 Active 208 DOM
-
2026-06-14days on market $34,900 Active 206 DOM
-
2026-06-12days on market $34,900 Active 205 DOM
-
2026-06-09days on market $34,900 Active 202 DOM
-
2026-06-08days on market $34,900 Active 201 DOM
-
2026-06-07days on market $34,900 Active 200 DOM
-
2026-06-07days on market $34,900 Active 199 DOM
-
2026-06-03days on market $34,900 Active 196 DOM
-
2026-06-02days on market $34,900 Active 195 DOM
-
2026-06-01days on market $34,900 Active 194 DOM
-
2026-05-31days on market $34,900 Active 193 DOM
-
2026-05-30days on market $34,900 Active 192 DOM
-
2025-11-12$34,900 Active 811-char remark
Show marketing remark (811 chars)
This well-maintained single-wide home in the desirable 55+ Woodlands Community offers comfortable, low-maintenance living just minutes from the City of Hornell and all the amenities the area provides. Inside, you’ll find an inviting open-concept kitchen and living room combo, creating a bright and functional main living space. The home features 2 bedrooms and 1 full bathroom, making it an ideal fit for downsizing or simplified living. Enjoy additional convenience with a covered porch, perfect for relaxing outdoors, along with a carport for sheltered parking and an on-site storage shed for tools or seasonal items. This peaceful, community-oriented setting provides easy access to shopping, dining, medical services, and more—an excellent opportunity for affordable living in a prime location.
ⓘ Source: listings_history table (triggers on properties + properties_extension) + one-shot
backfill from property_details.listing_events for pre-trigger history.
Climate risk First Street
- Flood 1/10 Low FEMA zone X (shaded) · 0% chance over 30 yrs
- Wildfire 2/10 Low
- Heat 3/10 Moderate 8 d/yr ≥91°F today · 18 d/yr by 30 yrs out
- Wind 1/10 Low
- Air quality 1/10 Low 0 unhealthy d/yr today · 0 by 30 yrs out
Nearby sold comps map
Loading sold comps map…
Walkable amenities ~0.75 mi
Loading nearby amenities…
Taxation est. · year 1
- Rental income
- $14,279
- − Mortgage interest
- −$1,955
- − Property taxes
- −$524
- − Insurance
- −$174
- − Repairs & maintenance
- −$1,142
- − Management
- −$1,142
- − Depreciation
- −$1,015
- Taxable income
- $8,326
- Est. tax owed @ 24.0%
- −$1,998
- After-tax cash flow
- $6,388/yr
For passive investors: Depreciation is non-cash, so a rental often shows a tax loss while cash-flowing — sheltering income. Rental losses are passive: they offset passive income freely, and up to $25,000/yr can offset ordinary (W-2) income if you actively participate and your MAGI is under $100k (phasing out to $0 by $150k); unused losses carry forward. On sale, claimed depreciation is recaptured at up to 25%, and gains may owe capital-gains tax (a 1031 exchange can defer both). Figures are a year-1 estimate at your 24.0% rate — not tax advice; consult a CPA.
Condition & rehab AI · 1 photo
A well-maintained single-wide home in a desirable community, ready for a fresh coat of paint and some minor updates to boost its resale and rental value.
Value-add opportunities
- Both Paint exterior — Enhances curb appeal and value
- Both Clean windows — Improves natural light and aesthetics
- Both Replace carpet — Freshens interior and adds value
- Both Update kitchen appliances — Modernizes space and adds value
Renovation cost estimate screening
Value-add ROI direction
- Both Paint exterior — Enhances curb appeal and value ↑
- Both Clean windows — Improves natural light and aesthetics ↑
- Both Replace carpet — Freshens interior and adds value ↑
- Both Update kitchen appliances — Modernizes space and adds value ↑
ⓘ Cost ranges are severity-bucket heuristics (US national rule-of-thumb). Get contractor quotes + a written scope before underwriting a rehab budget.
Schools (NCES district)
- District
- Hornell City School District
- NCES district ID
- 3614820
- Math proficiency
- 33% ▼ -8.00%
- Reading proficiency
- 49% ▲ 6.00%
- Median HH income
- $40,251
- Composite
- 34.33/100
- National rank
- #5234
- State rank
- #519 of 590 in NY
Livability — Hornell
- Score
- 70/100
- State rank
- #451
- US rank
- #7888
Category grades
Schools grade is shown separately in the Schools card above.
Census & demographics
- Census place
- Hornell, NY
- County
- Steuben County · 41,193 people
- City population
- 12,383
- Metro
- Corning, NY
- Population (ZIP)
- 12,383
- Household income
- $57,874
- Rent vs Own
- Severe rent burden
- 415.0
Population outlook (Steuben County) Hauer SSP2
- Today (2025)
- 93,062 people
- By 2030
- 89,793 · -3.5%
- By 2040
- 82,353 · -11.5%
- By 2050
- 74,286 · -20.2%
- By 2075
- 55,589 · -40.3%
- By 2100
- 37,587 · -59.6%
Race, ethnicity, and origin ACS 2023
- Neighborhood character
- Predominantly White (92%)
- Race & ethnicity
- White 92% Two or more races 3% Hispanic / Latino 3% Black 2%
- Common ancestry
- Lithuanian 3% Romanian 2% Iranian 2%
- Foreign-born
- 4% · Canada
- Languages at home
- 95% English-only · French/Haitian/Cajun 2% Arabic 1% Spanish 1%
Political lean MEDSL · Steuben
- 2024 margin
- Solid R (+31.8) · D 34.1% · R 65.9%
- 2008→2024 swing
- -15.0pp toward R · 2008: -16.8pp · 2024: -31.8pp
- All cycles
- 2024: R+31.8 2020: R+29.6 2016: R+36.2 2012: R+16.4 2008: R+16.8
Not yet ingested
- Civics
- —
Market trends
- HPI YoY
- ▲ 3.95%
- Current HPI
- 210.1986
- Rent YoY
- —
- Metro
- Corning, NY
- State GDP YoY
- ▲ 2.60%
- F500 in state
- 92
Industry mix (Fortune 500 HQ in NY)
| Industry | F500 HQs | Revenue |
|---|---|---|
| Financial Services | 10 | $950B |
|
||
| Consumer Goods | 9 | $162B |
|
||
| Insurance | 4 | $225B |
|
||
| Telecommunications | 2 | $144B |
|
||
| Pharmaceuticals | 2 | $112B |
|
||
| Media / Entertainment | 2 | $69B |
|
||
Price history
1 event — show timeline
- 2025-11-12 Listed $34,900 UNYREIS
Cash-flow waterfall
monthlySold comps — $/sqft
last 12 mo · ≤1 miLoading sold comps…