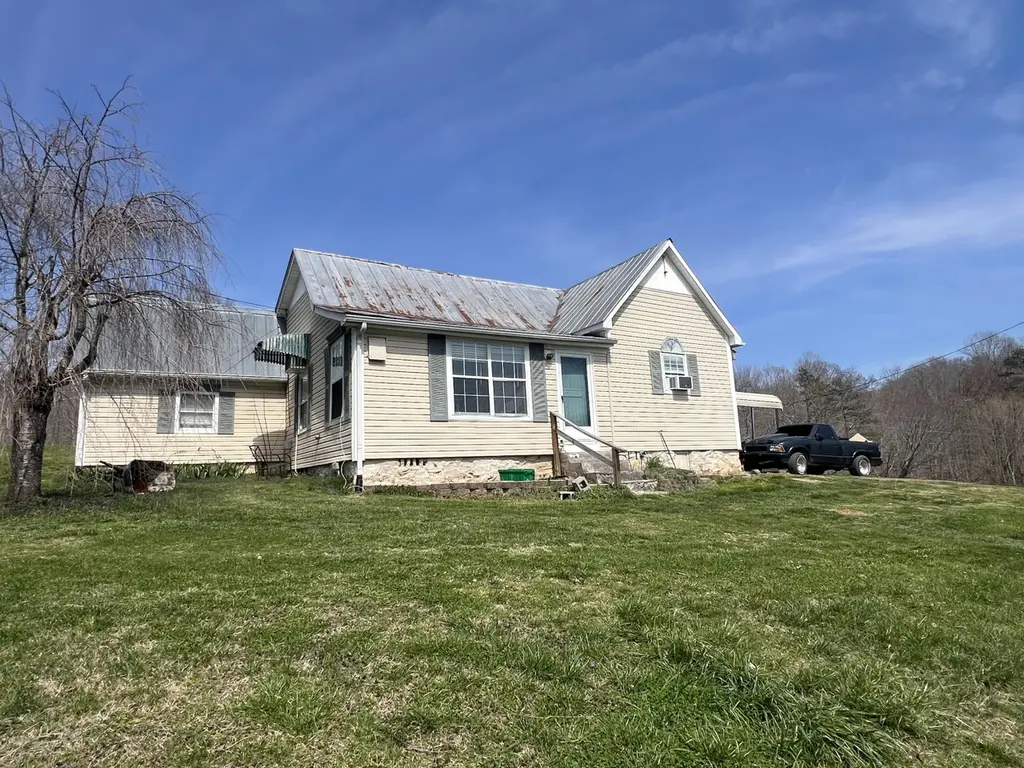
447 Arkle Rd · Corbin, KY
Flood risk 1/10 · Minimal
- FEMA flood zone
- X (unshaded)
- Chance of flooding over 30 yrs
- 0.0%
- Est. flood insurance / yr
- $507 – $1,088
Fire risk 10/10 · Severe
- Est. fire insurance / yr
- $839 – $1,559
Heat risk 4/10 · Minor
- Hot days now (above 100°F)
- 7 days/yr
- Hot days in 30 yrs
- 20 days/yr
Wind risk 2/10 · Minimal
- Chance of severe wind over 30 yrs
- 4.0%
Air-quality risk 2/10 · Minimal
- Unhealthy air days now
- 1 days/yr
- Unhealthy air days in 30 yrs
- 1 days/yr
Risk factors via First Street. Map © Google.
Why this score? — see what drove the D grade
The composite is a weighted blend of 9 inputs, each scored 0–100. Each bar is that input's sub-score; the figure is the points it added to the 100-point composite (weight × sub-score).
- ARV discount +15.0/15.0
- Cash flow +6.5/30.0
- Appreciation +6.2/10.0
- Livability +3.5/5.0
- Rent growth +2.5/5.0
- Schools +2.5/10.0
- Condition / age +2.5/5.0
- 1% rule +1.6/10.0
- DSCR +0.7/10.0
$159,000
🖨 Deal sheet (PDF) 📄 Offer letter ✓ Due diligence
Listing remarks MLS
Looking for an affordable farm?? Here it is folks!! Take a look at this historic farmhouse that was constructed in the late 1800's!! This home offers 2 bedrooms with the potential to make 3 bedrooms, 1 bath, large living room, eat in kitchen, cellar, covered patio, workshop area, and so much more!! The barn is in need of repair, but the seller has the materials for repair that will convey with the sale. All this sits on approximately 7 rolling acres!! Home will not pass secondary market loans. Call for details!!
Key facts
- Workshop area
- Eat in kitchen
- Large living room
Tags
Neighborhood map
What this means for you Summary
Snapshot
- This is a 2-bed/1.0-bath single-family listed at $159k.
Deal economics
- At list price, monthly cash flow is $-271 ($-3k/yr) — negative.
- To cash-flow at today's rent, offer at most $120k (24.7% below list).
- To meet the 1% rule (rent ≥ 1% of price), the offer needs to be $105k (34.1% below list).
- Recommended offer: $105k (34.1% below list) — sets the bar for 1% rule.
- Cap rate 4.2% vs local median 3.3% in Corbin — meaningfully above typical; check what's discounted (condition, days-on-market, listing class) to confirm the premium yield is real.
Location & tenants
- Location reads 69/100 on livability (#179 in KY) — a middle-class / working-renter tenant base. Strengths: cost of living A+, housing A+, crime A-; Watch: amenities F, commute F, employment F.
- Knox County (town): math 24% / reading 38% proficiency, ranked #116 of 165 in KY (top 70%) — families likely to look elsewhere, expect single-tenant / working-renter base with shorter leases; 68% free/reduced lunch — lower-income household profile, screen leases tightly.
- Zoned schools: Knox County Middle School (math 17% / reading 42%, grade F, #151 of 217 statewide, top 71%, 429 students, 81% FRL).
- Market conditions: 20 active listings in the ZIP.
Forward outlook
- In year one you build about $5k of equity ($1k loan paydown + $4k appreciation (2.4% local appreciation)).
- Knox County population projected at -16% by 2050 — secular population decline; favor cash flow + early exit over multi-decade hold.
- By year 7, paydown + projected appreciation supports a ~$31k cash-out refi (75% LTV) — recoverable capital for the next deal without selling this one.
Negotiation context
- It's been on market 87 days — a 6% lower offer ($149k) is reasonable based on typical stale-listing flexibility.
Risks & watch-outs
- Watch-outs: built in 1930 — expect roof / HVAC / electrical / plumbing capex.
- Climate carrying-cost: severe wildfire risk — expect insurance premiums to compound above CPI over the hold.
Questions for the listing agent
- What do current leases actually rent for vs. the listed asking? Can we see a recent rent roll and the last 12 months of T-12 income?
- It's been on market 87 days. Have you received any prior offers? Is the seller open to a 34% concession, seller financing, or rate buy-down credit?
- Built in 1930 — when were the roof, HVAC, electrical panel, plumbing, and water heater last replaced?
- Why hasn't it sold? Are there any deal-killer items the seller is aware of (foundation, flood, title, zoning, code violations)?
- Is there a deadline driving the sale (1031 exchange, divorce, estate, relocation)? That informs how much negotiation room exists.
- Schools are B-rated — typically a magnet for longer-tenancy family renters. What's the average tenant stay here, and is there a school-zone premium baked into asking?
- The area grade is low — what's the realistic commute time and amenity access for the typical tenant pool here? Any planned neighborhood developments (good or bad) we should know about?
- What's the average days-on-market for RENTAL listings here right now (not sales)? A rising rental-DOM trend means longer vacancies and softer asking-rent achievability than the comps imply.
- What's the recent tenant-quality profile in this submarket — average credit score on applications, eviction rate, late-payment / NSF rate, and stable-employment percentage? A property-management company in the area should have these aggregated.
- How much new for-sale + rental construction is in the pipeline within 1–3 miles? Heavy new supply typically softens prices + rents 12–24 months out; constrained supply supports both.
Investment metrics
- 1% rule
- 0.66% ✗
- Cap rate
- 4.25%
- Cash-on-cash
- -7.31%
- DSCR
- 0.67
- GRM
- 12.6
CMA / ARV
- ARV (median comp)
- $207,070
- List price
- $159,000
- Delta
- -23.21%
- Verdict
- UNDERPRICED
- Comps
- 4 within 2.0 mi
Projected returns pro-forma
2.39% appreciation · 3.0% rent growth · sell at horizon
- IRR
- -1.3%
- Equity multiple
- 0.93×
- Total profit
- $-3,173
- Equity at exit
- $66,107
- IRR
- 3.0%
- Equity multiple
- 1.44×
- Total profit
- $19,424
- Equity at exit
- $97,874
Cash invested: $44,520 (down + closing). Projections, not guarantees.
Landlord ↔ Tenant lean methodology
- Overall (STATE)
- 83 Strongly Landlord-Friendly
- State Kentucky
- 83 Strongly Landlord-Friendly · R+16
- County
- — inherits STATE
- City
- — inherits STATE
ZIP-level market 40734
- Home prices YoY
- 1.6%
- Active inventory
- 20
- Price-to-rent
- 12.6×
Monthly cashflow live
- Estimated rent
- $1,047 medium interval (Pro) →
- Mortgage (P&I)
- −$834
- Tax est. 1.5%
- −$199 /mo · $2,385/yr
- Insurance
- −$66
- HOA
- −$0
- Lot rent
- −$0
- Vacancy / Maint / Mgmt
- −$220
- Net cashflow
- $-271
Break-even live
Sensitivity live
| Price | -10% $-161 | -5% $-216 | +0% $-271 | +5% $-326 | +10% $-381 |
|---|---|---|---|---|---|
| Rent | -10% $-354 | -5% $-313 | +0% $-271 | +5% $-230 | +10% $-189 |
| Rate | -1.0pp $-191 | -0.5pp $-231 | base $-271 | +0.5pp $-313 | +1.0pp $-354 |
UW: 25.0% down · 7.5% · 30yr · 1.5% tax · 5.0% vac · 8.0% maint · 8.0% mgmt
Financing live
Cash to close
- Down payment
- $39,750
- Closing costs
- $4,770
- Reserves months
- —
- Total cash needed
- —
Loan-product check · same deal, 3 products live
Conventional
25% down · 7.5% · 30yr
- Down + closing
- —
- Monthly P&I
- —
- Monthly cashflow
- —
- DSCR
- —
- Eligible?
- —
Personal DTI + credit; lowest rate.
DSCR
20% down · 8.5% · 30yr
- Down + closing
- —
- Monthly P&I
- —
- Monthly cashflow
- —
- DSCR
- —
- Eligible?
- —
No personal income docs; deal must DSCR.
Hard money
10% down · 12.0% · 12mo
- Down + closing
- —
- Monthly P&I
- —
- Monthly cashflow
- —
- DSCR
- —
- Eligible?
- —
Short-term bridge; refi at stabilization.
Listing history 19 events
-
2026-06-22days on market $159,000 Active 87 DOM
-
2026-06-21days on market $159,000 Active 86 DOM
-
2026-06-21days on market $159,000 Active 85 DOM
-
2026-06-18days on market $159,000 Active 83 DOM
-
2026-06-17days on market $159,000 Active 82 DOM
-
2026-06-16days on market $159,000 Active 81 DOM
-
2026-06-15days on market $159,000 Active 80 DOM
-
2026-06-13days on market $159,000 Active 78 DOM
-
2026-06-12days on market $159,000 Active 77 DOM
-
2026-06-09days on market $159,000 Active 74 DOM
-
2026-06-08days on market $159,000 Active 73 DOM
-
2026-06-07days on market $159,000 Active 72 DOM
-
2026-06-07days on market $159,000 Active 71 DOM
-
2026-06-04days on market $159,000 Active 68 DOM
-
2026-06-02days on market $159,000 Active 67 DOM
-
2026-06-01days on market $159,000 Active 66 DOM
-
2026-05-31days on market $159,000 Active 65 DOM
-
2026-05-31statusdays on market $159,000 Active 64 DOM
-
2026-03-27$159,000 Active 517-char remark
Show marketing remark (517 chars)
Looking for an affordable farm?? Here it is folks!! Take a look at this historic farmhouse that was constructed in the late 1800's!! This home offers 2 bedrooms with the potential to make 3 bedrooms, 1 bath, large living room, eat in kitchen, cellar, covered patio, workshop area, and so much more!! The barn is in need of repair, but the seller has the materials for repair that will convey with the sale. All this sits on approximately 7 rolling acres!! Home will not pass secondary market loans. Call for details!!
ⓘ Source: listings_history table (triggers on properties + properties_extension) + one-shot
backfill from property_details.listing_events for pre-trigger history.
Climate risk First Street
- Flood 1/10 Low FEMA zone X (unshaded) · 0% chance over 30 yrs
- Wildfire 10/10 Extreme
- Heat 4/10 Moderate 7 d/yr ≥100°F today · 20 d/yr by 30 yrs out
- Wind 2/10 Low 4% chance of damaging wind over 30 yrs
- Air quality 2/10 Low 1 unhealthy d/yr today · 1 by 30 yrs out
Nearby sold comps map
Loading sold comps map…
Walkable amenities ~0.75 mi
Loading nearby amenities…
Taxation est. · year 1
- Rental income
- $12,570
- − Mortgage interest
- −$8,906
- − Property taxes
- −$2,385
- − Insurance
- −$795
- − Repairs & maintenance
- −$1,006
- − Management
- −$1,006
- − Depreciation
- −$4,625
- Taxable loss
- −$6,153
- Est. tax savings @ 24.0%
- +$1,477
- After-tax cash flow
- $-1,779/yr
For passive investors: Depreciation is non-cash, so a rental often shows a tax loss while cash-flowing — sheltering income. Rental losses are passive: they offset passive income freely, and up to $25,000/yr can offset ordinary (W-2) income if you actively participate and your MAGI is under $100k (phasing out to $0 by $150k); unused losses carry forward. On sale, claimed depreciation is recaptured at up to 25%, and gains may owe capital-gains tax (a 1031 exchange can defer both). Figures are a year-1 estimate at your 24.0% rate — not tax advice; consult a CPA.
Schools (NCES district)
- District
- Knox County
- NCES district ID
- 2103150
- Math proficiency
- 24% ▼ -20.00%
- Reading proficiency
- 38% ▼ -19.00%
- Median HH income
- $24,965
- Composite
- 24.59/100
- National rank
- #7636
- State rank
- #116 of 165 in KY
Livability — Corbin
- Score
- 69/100
- State rank
- #179
- US rank
- #8891
Category grades
Schools grade is shown separately in the Schools card above.
Census & demographics
- Population (ZIP)
- 3,633
Population outlook (Knox County) Hauer SSP2
- Today (2025)
- 30,741 people
- By 2030
- 29,887 · -2.8%
- By 2040
- 27,940 · -9.1%
- By 2050
- 25,826 · -16.0%
- By 2075
- 20,895 · -32.0%
- By 2100
- 16,238 · -47.2%
Race, ethnicity, and origin ACS 2023
- Neighborhood character
- Predominantly White (98%)
- Race & ethnicity
- White 98% Two or more races 2%
- Common ancestry
- Serbian 2% Slovak 1% Lithuanian 1%
Political lean MEDSL · Knox
- 2024 margin
- Solid R (+71.1) · D 13.8% · R 85.0% · Other 1.2%
- 2008→2024 swing
- -26.6pp toward R · 2008: -44.6pp · 2024: -71.1pp
- All cycles
- 2024: R+71.1 2020: R+67.0 2016: R+67.7 2012: R+53.9 2008: R+44.6
Not yet ingested
- Civics
- —
Market trends
- HPI YoY
- ▲ 2.39%
- Current HPI
- 155.129
- Rent YoY
- —
- Metro
- —
- State GDP YoY
- ▲ 1.81%
- F500 in state
- 4
Industry mix (Fortune 500 HQ in KY)
| Industry | F500 HQs | Revenue |
|---|---|---|
| Healthcare | 1 | $118B |
|
||
| Food / Beverage | 1 | $7B |
|
||
Price history
1 event — show timeline
- 2026-03-27 Listed $159,000 ImagineMLS
Property tax history
-6.1%/yrLatest (2025): $97 · -22.0% YoY. Source: county tax records.
Cash-flow waterfall
monthlySold comps — $/sqft
last 12 mo · ≤1 miLoading sold comps…