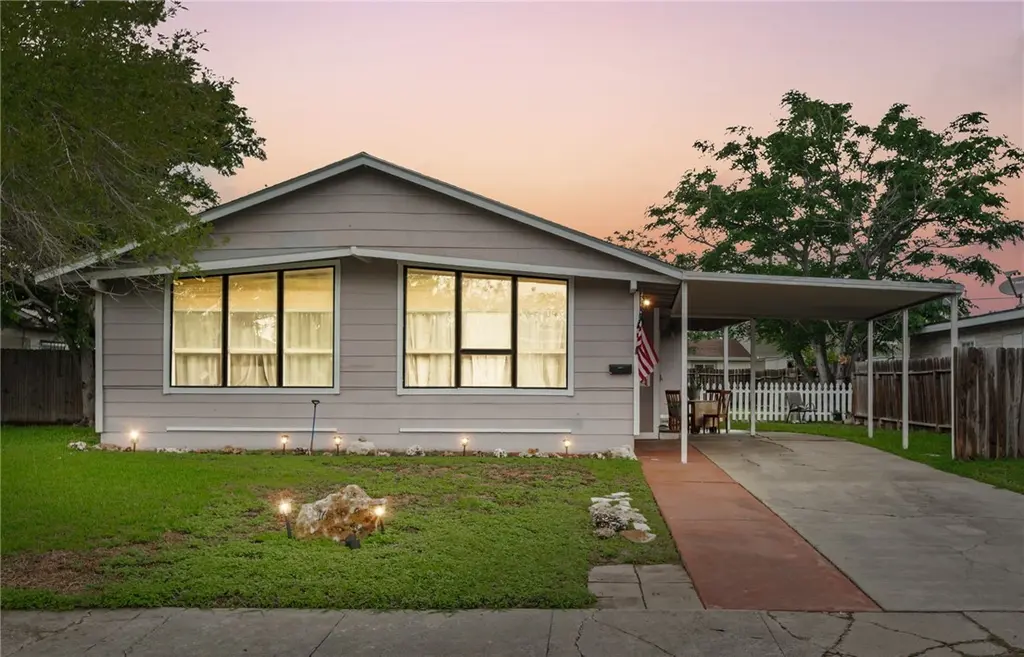
1645 Brentwood Dr · Corpus Christi, TX
Flood risk 4/10 · Minor
- FEMA flood zone
- X (unshaded)
- Chance of flooding over 30 yrs
- 0.21%
- Est. flood insurance / yr
- $507 – $1,088
Fire risk 1/10 · Minimal
- Est. fire insurance / yr
- $1,222 – $2,270
Heat risk 10/10 · Severe
- Hot days now (above 107°F)
- 7 days/yr
- Hot days in 30 yrs
- 26 days/yr
Wind risk 9/10 · Severe
- Chance of severe wind over 30 yrs
- 99.0%
Air-quality risk 1/10 · Minimal
- Unhealthy air days now
- 0 days/yr
- Unhealthy air days in 30 yrs
- 0 days/yr
Risk factors via First Street. Map © Google.
Why this score? — see what drove the B- grade
The composite is a weighted blend of 9 inputs, each scored 0–100. Each bar is that input's sub-score; the figure is the points it added to the 100-point composite (weight × sub-score).
- Cash flow +26.1/30.0
- ARV discount +11.1/15.0
- DSCR +8.8/10.0
- 1% rule +7.8/10.0
- Livability +3.9/5.0
- Rent growth +3.1/5.0
- Schools +2.8/10.0
- Condition / age +2.5/5.0
- Appreciation +0.0/10.0
$129,900
🖨 Deal sheet (PDF) 📄 Offer letter ✓ Due diligence
Listing remarks
Perfect starter home or investment opportunity tucked away in a quiet, established neighborhood! This 3-bedroom, 2-bath home offers 1,414 square feet of living space and sits on a generously sized lot, giving you plenty of room to enjoy, entertain, expand, or create the backyard setup you have been looking for. Whether you are a first-time home buyer searching for a great place to call home, or an investor looking for a solid addition to your portfolio, this property checks the boxes. Inside, the home offers a functional layout with comfortable living areas, spacious bedrooms, and the flexibility to make the space your own. The large lot provides great outdoor potential, whether that means
Key facts
- Generously sized lot
- 7,536 sq ft lot
- Parking
Tags
Property features AI
Finance
- HOA & community: Curbs, gutters, and sidewalks in the community
Exterior
- Parking: Carport
- Utilities: Natural gas available; Public water; Public sewer; Electricity available; Separate meters
- Home design: Single-story; Shingle roof
- Construction: HardiPlank and wood siding; Pillar/Post/Pier and slab foundation; Built with wood siding and HardiPlank type exterior
- Exterior features: Chain link and wood fencing; Landscaped interior lot; Subdivided lot; City street frontage
Interior
- Kitchen: Gas cooktop; Gas oven; Gas range; Disposal
- Flooring: Carpet; Hardwood; Laminate
- Bathrooms: 2 full bathrooms
- Heating & cooling: Central heating (gas); Central air conditioning
- Interior features: Air filtration; Open floor plan; Split bedrooms
- Laundry & utility: Washer hookup; Dryer hookup
Neighborhood map
What this means for you Summary
Snapshot
- This is a 3-bed/2.0-bath single-family listed at $130k.
Deal economics
- At list price, monthly cash flow is $328 ($4k/yr) — positive.
- The deal already cash-flows at list — no discount required.
- Meets the 1% rule at list price ($2k rent vs $130k).
- Recommended offer: $126k (3.0% below list) — sets the bar for market timing.
- Cap rate 9.3% vs local median 3.6% in Corpus Christi — top-decile yield for the area; either an underpriced asset or a hidden risk that comps aren't pricing in. Stress-test before assuming the spread holds.
Location & tenants
- Location reads 78/100 on livability (#66 in TX, #2,404 nationally) — a middle-class / working-renter tenant base. Strengths: commute A+, cost of living A+, housing A+; Watch: crime F.
- Corpus Christi ISD (urban): math 31% / reading 35% proficiency, ranked #562 of 826 in TX (top 68%) — families likely to look elsewhere, expect single-tenant / working-renter base with shorter leases; 63% free/reduced lunch — lower-income household profile, screen leases tightly.
- Zoned schools: Windsor Park G/T (math 85% / reading 90%, grade A+, #6 of 4,322 statewide, top 0%, 609 students, 29% FRL); Adkins Middle (math 40% / reading 39%, grade F, #660 of 1,662 statewide, top 41%, 956 students, 48% FRL); Ray H S (math 49% / reading 47%, grade D, #571 of 1,632 statewide, top 36%, 1,640 students, 69% FRL).
- Zoned-school proficiency averages 58% at this address vs 33% district-wide (+25 pts) — the actual schools serving this property are materially stronger than the Corpus Christi ISD average implies; a family-tenant draw the district grade alone would hide.
- Market conditions: Rents rising (+2.3%/yr); 434 active listings in the ZIP; 24 comparable units currently listed for rent nearby; rentals lingering (median 46d on market — plan ~5-8 weeks vacancy on turnover, expect pricing pressure); 58% of comp listings sitting > 30 days — soft ceiling on asking rent; 1,397 units permitted in Nueces County in 2024 (47 in 5+ unit buildings).
- This rent runs 36% of the median local income ($55k/yr) — at the standard rent-burdened threshold; future hikes will face affordability resistance.
Forward outlook
- Local home prices are declining (-3.0%/yr); year-one equity from $898 of loan paydown is wiped out by about $4k of value loss. Plan a longer hold.
- Nueces County population projected at +36% by 2050 — long-run rental-demand tailwind backs the buy-and-hold thesis.
Negotiation context
- It's been on market 51 days — a 3% lower offer ($126k) is reasonable based on typical stale-listing flexibility.
- 8 sale attempts since 16y ago with the ask held roughly flat each time — persistent listings suggest the price (not the market) is what's stuck; bring a comps-based counter.
Risks & watch-outs
- Watch-outs: built in 1951 — expect roof / HVAC / electrical / plumbing capex.
- Climate carrying-cost: severe wind risk, 99% chance of damaging wind over 30y; extreme-heat days projected 7→26/yr by 2055 (HVAC capex compounding) — expect insurance premiums to compound above CPI over the hold.
Questions for the listing agent
- It's been on market 51 days. Have you received any prior offers? Is the seller open to a 3% concession, seller financing, or rate buy-down credit?
- Built in 1951 — when were the roof, HVAC, electrical panel, plumbing, and water heater last replaced?
- Is there a deadline driving the sale (1031 exchange, divorce, estate, relocation)? That informs how much negotiation room exists.
- Crime grade is F in this area — have there been break-ins, vandalism, or insurance claims at this property in the last 3 years? What carrier currently insures it and at what premium?
- What's the average days-on-market for RENTAL listings here right now (not sales)? A rising rental-DOM trend means longer vacancies and softer asking-rent achievability than the comps imply.
- What's the recent tenant-quality profile in this submarket — average credit score on applications, eviction rate, late-payment / NSF rate, and stable-employment percentage? A property-management company in the area should have these aggregated.
- How much new for-sale + rental construction is in the pipeline within 1–3 miles? Heavy new supply typically softens prices + rents 12–24 months out; constrained supply supports both.
Investment metrics
- 1% rule
- 1.28% ✓
- Cap rate
- 9.33%
- Cash-on-cash
- 10.84%
- DSCR
- 1.48
- GRM
- 6.5
CMA / ARV
- ARV (median comp)
- $141,040
- List price
- $129,900
- Delta
- -7.90%
- Verdict
- FAIR
- Comps
- 20 within 1.0 mi
Show comp detail 12 sales within ~0.75 mi
| Address | Dist | Beds/Ba | Sqft | Sold | Price | $/sf | Match |
|---|---|---|---|---|---|---|---|
| 1650 Green Grove Dr | 0.19mi | 3/2.0 | 1,418 (+0%) | 4mo | $99,950 | $70 | 87 |
| 4305 Devon Dr | 0.37mi | 3/2.0 | 1,456 (+3%) | 8mo | $139,900 | $96 | 72 |
| 4026 W Vanderbilt Dr | 0.37mi | 4/3.0 (+1) | 1,412 (-0%) | 3mo | $159,900 | $113 | 71 |
| 3953 Naples St | 0.26mi | 3/2.0 | 1,290 (-9%) | 8mo | $139,000 | $108 | 66 |
| 1550 Melbourne Dr | 0.37mi | 3/2.0 | 1,516 (+7%) | 6mo | $229,000 | $151 | 66 |
| 1438 Melbourne Dr | 0.50mi | 3/2.0 | 1,464 (+4%) | 7mo | $129,900 | $89 | 65 |
| 1350 Ormond Dr | 0.63mi | 3/2.0 | 1,389 (-2%) | 8mo | $135,000 | $97 | 61 |
| 4338 Cottage St | 0.66mi | 3/1.5 | 1,428 (+1%) | 8mo | $194,999 | $137 | 59 |
| 2521 Viola | 0.73mi | 3/2.0 | 1,452 (+3%) | 7mo | $223,000 | $154 | 55 |
| 1233 Brentwood Dr | 0.65mi | 3/1.0 | 1,229 (-13%) | 6mo | $199,000 | $162 | 39 |
| 2517 Viola Ave | 0.74mi | 3/1.0 | 1,229 (-13%) | 8mo | $114,900 | $93 | 33 |
| 1210 Brentwood Dr | 0.72mi | 4/2.0 (+1) | 1,619 (+14%) | 9mo | $185,000 | $114 | 30 |
Match score weights: distance 35% · size 25% · config 20% · recency 20%. Top-matched comps best support the ARV.
Projected returns pro-forma
-3.0% appreciation · 2.32% rent growth · sell at horizon
- IRR
- -0.9%
- Equity multiple
- 0.97×
- Total profit
- $-1,184
- Equity at exit
- $19,369
- IRR
- 8.1%
- Equity multiple
- 1.60×
- Total profit
- $21,650
- Equity at exit
- $11,231
Cash invested: $36,372 (down + closing). Projections, not guarantees.
Landlord ↔ Tenant lean methodology
- Overall (STATE)
- 87 Strongly Landlord-Friendly
- State Texas
- 87 Strongly Landlord-Friendly · R+5
- County
- — inherits STATE
- City
- — inherits STATE
ZIP-level market 78415
- Rents YoY
- 2.3%
- Active inventory
- 434
- Price-to-rent
- 6.5×
Monthly cashflow live
- Estimated rent
- $1,663 high interval (Pro) →
- Mortgage (P&I)
- −$681
- Tax from tax record
- −$250 /mo · $2,997/yr
- Insurance
- −$54
- HOA
- −$0
- Vacancy / Maint / Mgmt
- −$349
- Net cashflow
- $328
Break-even live
Sensitivity live
| Price | -10% $402 | -5% $365 | +0% $328 | +5% $292 | +10% $255 |
|---|---|---|---|---|---|
| Rent | -10% $197 | -5% $263 | +0% $328 | +5% $394 | +10% $460 |
| Rate | -1.0pp $394 | -0.5pp $361 | base $328 | +0.5pp $295 | +1.0pp $261 |
UW: 25.0% down · 7.5% · 30yr · 1.5% tax · 5.0% vac · 8.0% maint · 8.0% mgmt
Financing live
Cash to close
- Down payment
- $32,475
- Closing costs
- $3,897
- Reserves months
- —
- Total cash needed
- —
Loan-product check · same deal, 3 products live
Conventional
25% down · 7.5% · 30yr
- Down + closing
- —
- Monthly P&I
- —
- Monthly cashflow
- —
- DSCR
- —
- Eligible?
- —
Personal DTI + credit; lowest rate.
DSCR
20% down · 8.5% · 30yr
- Down + closing
- —
- Monthly P&I
- —
- Monthly cashflow
- —
- DSCR
- —
- Eligible?
- —
No personal income docs; deal must DSCR.
Hard money
10% down · 12.0% · 12mo
- Down + closing
- —
- Monthly P&I
- —
- Monthly cashflow
- —
- DSCR
- —
- Eligible?
- —
Short-term bridge; refi at stabilization.
Rent comps 24 comps
| Address | Beds | Baths | Sqft | Rent | $/sqft | DOM | Units | Dist |
|---|---|---|---|---|---|---|---|---|
| 1522 Cambridge Dr Corpus Christi, TX | 3.0 | 1.5 | 1278 | $1,600 | $1.25 | 45d | 1 | 0.20mi |
| 4005 Green Grove Dr Corpus Christi, TX | 3.0 | 2.0 | 1406 | $1,695 | $1.21 | 45d | 1 | 0.21mi |
| 1446 Annapolis Dr Corpus Christi, TX | 3.0 | 2.0 | 1500 | $1,700 | $1.13 | 45d | 1 | 0.26mi |
| 1405 Annapolis Dr Corpus Christi, TX | 3.0 | 1.5 | 1502 | $2,000 | $1.33 | 15d | 1 | 0.37mi |
| 4241 Green Grove Dr Corpus Christi, TX | 3.0 | 2.0 | 1345 | $1,700 | $1.26 | 45d | 1 | 0.41mi |
| 225 Watson St Corpus Christi, TX | 3.0 | 1.0 | 1472 | $1,295 | $0.88 | 45d | 1 | 0.48mi |
| 200 Clemmer St Unit A Corpus Christi, TX | 3.0 | 1.0 | 950 | $1,199 | $1.26 | 45d | 1 | 0.58mi |
| 4322 Kostoryz Rd Corpus Christi, TX | 2.0 | 1.5 | 1100 | $1,259 | $1.14 | 45d | 1 | 0.75mi |
| 1201 York Ave Corpus Christi, TX | 3.0 | 1.0 | 888 | $1,550 | $1.75 | 23d | 1 | 0.80mi |
| 3314 Casa de Palmas Dr Corpus Christi, TX | 3.0 | 2.0 | 1869 | $2,300 | $1.23 | 15d | 1 | 0.81mi |
| 4326 Vestal St Corpus Christi, TX | 3.0 | 1.0 | 984 | $1,125 | $1.14 | 15d | 1 | 0.84mi |
| 1410 Ray Dr Corpus Christi, TX | 3.0 | 1.0 | 1224 | $1,600 | $1.31 | 15d | 1 | 0.86mi |
| 2106 Harvard St Corpus Christi, TX | 3.0 | 1.0 | 912 | $1,225 | $1.34 | 45d | 1 | 0.87mi |
| 2041 Harvard St Corpus Christi, TX | 3.0 | 2.0 | 1230 | $1,400 | $1.14 | 15d | 1 | 0.91mi |
| 4818 Kendall Dr Corpus Christi, TX | 2.0 | 1.0 | 1169 | $1,250 | $1.07 | 15d | 1 | 1.06mi |
| 1837 Horne Rd Corpus Christi, TX | 3.0 | 2.0 | 1226 | $1,800 | $1.47 | 45d | 1 | 1.09mi |
| 1722 Trenton Dr Corpus Christi, TX | 4.0 | 2.0 | 1432 | $2,100 | $1.47 | 15d | 1 | 1.16mi |
| 3333 S Alameda St Corpus Christi, TX | 3.0 | 2.0 | 1000 | $1,149 | $1.15 | 45d | 1 | 1.30mi |
| 1802 16th St Unit B Corpus Christi, TX | 3.0 | 1.0 | 1575 | $1,000 | $0.63 | 45d | 1 | 1.36mi |
| 2622 Cloyde St Corpus Christi, TX | 2.0 | 1.0 | 1693 | $1,150 | $0.68 | 45d | 1 | 1.41mi |
| 443 Indiana Ave Corpus Christi, TX | 2.0 | 1.0 | 968 | $1,650 | $1.70 | 45d | 1 | 1.43mi |
| 455 Louisiana Ave Corpus Christi, TX | 2.0 | 1.0 | 1528 | $3,000 | $1.96 | 23d | 1 | 1.44mi |
| 4822 Mokry Dr Corpus Christi, TX | 2.0 | 1.0 | 903 | $1,200 | $1.33 | 23d | 1 | 1.47mi |
| 1628 18th St Corpus Christi, TX | 2.0 | 1.0 | 1112 | $1,000 | $0.90 | 45d | 1 | 1.48mi |
Listing history 33 events
-
2026-06-21days on market $129,900 Active 51 DOM
-
2026-06-18days on market $129,900 Active 48 DOM
-
2026-06-17days on market $129,900 Active 47 DOM
-
2026-06-16days on market $129,900 Active 46 DOM
-
2026-06-15days on market $129,900 Active 45 DOM
-
2026-06-14days on market $129,900 Active 43 DOM
-
2026-06-10days on market $129,900 Active 40 DOM
-
2026-06-09days on market $129,900 Active 39 DOM
-
2026-06-08days on market $129,900 Active 38 DOM
-
2026-06-07days on market $129,900 Active 37 DOM
-
2026-06-05days on market $129,900 Active 34 DOM
-
2026-06-03days on market $129,900 Active 33 DOM
-
2026-06-02days on market $129,900 Active 32 DOM
-
2026-06-01days on market $129,900 Active 31 DOM
-
2026-05-31days on market $129,900 Active 30 DOM
-
2026-05-30days on market $129,900 Active 29 DOM
-
2026-05-09$129,900 Active 1358-char remark
-
2026-05-02historical 1358-char remark
-
2026-04-24$129,900 Active 1358-char remark
-
2026-03-06historical
-
2026-03-06status Active
-
2026-02-23$155,000 Active
-
2026-01-26price $155,000
-
2026-01-26status Active
-
2026-01-26price $150,000
-
2025-11-20price $155,000
-
2025-11-18$165,000 Active
-
2025-07-01$189,900 Active
-
2016-03-15soldstatus
-
2010-10-26soldstatus
-
2010-10-12soldstatus
-
2010-03-26$35,700
-
2002-02-08soldstatus
ⓘ Source: listings_history table (triggers on properties + properties_extension) + one-shot
backfill from property_details.listing_events for pre-trigger history.
Tax reassessment forecast TX · Resets to sale price
- Current annual tax
- $2,997 · $250/mo
- Projected year-2 tax
- $2,997 · $250/mo
- Expected delta
- $0/yr ($0/mo · 0.0%)
ⓘ Screening estimate from a state-policy table — verify with the county assessor before closing.
Climate risk First Street
- Flood 4/10 Moderate FEMA zone X (unshaded) · 21% chance over 30 yrs
- Wildfire 1/10 Low
- Heat 10/10 Extreme 7 d/yr ≥107°F today · 26 d/yr by 30 yrs out
- Wind 9/10 Extreme 99% chance of damaging wind over 30 yrs
- Air quality 1/10 Low 0 unhealthy d/yr today · 0 by 30 yrs out
Nearby sold comps map
Loading sold comps map…
Walkable amenities ~0.75 mi
Loading nearby amenities…
Taxation est. · year 1
- Rental income
- $19,952
- − Mortgage interest
- −$7,276
- − Property taxes
- −$2,997
- − Insurance
- −$650
- − Repairs & maintenance
- −$1,596
- − Management
- −$1,596
- − Depreciation
- −$3,779
- Taxable income
- $2,058
- Est. tax owed @ 24.0%
- −$494
- After-tax cash flow
- $3,447/yr
For passive investors: Depreciation is non-cash, so a rental often shows a tax loss while cash-flowing — sheltering income. Rental losses are passive: they offset passive income freely, and up to $25,000/yr can offset ordinary (W-2) income if you actively participate and your MAGI is under $100k (phasing out to $0 by $150k); unused losses carry forward. On sale, claimed depreciation is recaptured at up to 25%, and gains may owe capital-gains tax (a 1031 exchange can defer both). Figures are a year-1 estimate at your 24.0% rate — not tax advice; consult a CPA.
Schools (NCES district)
- District
- Corpus Christi ISD
- NCES district ID
- 4815270
- Math proficiency
- 31% ▼ -18.00%
- Reading proficiency
- 35% ▼ -7.00%
- Median HH income
- $45,672
- Composite
- 28.27/100
- National rank
- #6793
- State rank
- #562 of 826 in TX
Livability — Corpus Christi
- Score
- 78/100
- State rank
- #66
- US rank
- #2404
Category grades
Schools grade is shown separately in the Schools card above.
Census & demographics
- Census place
- Corpus Christi, TX
- County
- Nueces County · 296,836 people
- City population
- 296,836
- Metro
- Corpus Christi, TX
- Population (ZIP)
- 43,080
- Household income
- $54,990
- Rent vs Own
- Severe rent burden
- 1730.0
Population outlook (Nueces County) Hauer SSP2
- Today (2025)
- 418,037 people
- By 2030
- 447,123 · +7.0%
- By 2040
- 505,911 · +21.0%
- By 2050
- 567,522 · +35.8%
- By 2075
- 729,686 · +74.6%
- By 2100
- 847,087 · +102.6%
Race, ethnicity, and origin ACS 2023
- Neighborhood character
- Predominantly Hispanic (83%)
- Race & ethnicity
- Hispanic / Latino 83% Two or more races 41% White 12% Black 3%
- Hispanic origin (detail)
- Mexican 75%
- Foreign-born
- 9% · Canada
- Languages at home
- 59% English-only · Spanish 40%
Political lean MEDSL · Nueces
- 2024 margin
- R (+11.5) · D 43.8% · R 55.3%
- 2008→2024 swing
- -7.1pp toward R · 2008: -4.4pp · 2024: -11.5pp
- All cycles
- 2024: R+11.5 2020: R+2.9 2016: R+1.5 2012: R+3.2 2008: R+4.4
Not yet ingested
- Civics
- —
Market trends
- HPI YoY
- ▼ -173.20%
- Current HPI
- 158.011
- Rent YoY
- ▲ 2.32%
- Metro
- Corpus Christi, TX
- State GDP YoY
- ▲ 3.95%
- F500 in state
- 110
Industry mix (Fortune 500 HQ in TX)
| Industry | F500 HQs | Revenue |
|---|---|---|
| Energy | 16 | $1,198B |
|
||
| Technology | 5 | $198B |
|
||
| Engineering / Construction | 4 | $72B |
|
||
| Energy Services | 3 | $60B |
|
||
| Utilities | 3 | $41B |
|
||
| Healthcare | 2 | $330B |
|
||
Price history
+263.9% since first listed17 events — show timeline
- 2026-05-09 Listed $129,900 CBMLS
- 2026-05-02 Delisted — CBMLS
- 2026-04-24 Listed $129,900 CBMLS
- 2026-03-06 Delisted — CBMLS
- 2026-03-06 Relisted — CBMLS
- 2026-02-23 Listed $155,000 CBMLS
- 2026-01-26 Price Changed $155,000 CBMLS
- 2026-01-26 Relisted — CBMLS
- 2026-01-26 Price Changed $150,000 CBMLS
- 2025-11-20 Price Changed $155,000 CBMLS
- 2025-11-18 Listed $165,000 CBMLS
- 2025-07-01 Listed $189,900 CBMLS
- 2016-03-15 Sold (Public Records) — Public Records
- 2010-10-26 Sold (Public Records) — Public Records
- 2010-10-12 Sold (MLS) — CBMLS
- 2010-03-26 Listed $35,700 CBMLS
- 2002-02-08 Sold (Public Records) — Public Records
Property tax history
+6.8%/yrLatest (2025): $2,997 · +12.0% YoY. Source: county tax records.
Cash-flow waterfall
monthlySold comps — $/sqft
last 12 mo · ≤1 miLoading sold comps…